
| Company | Aug 25 | Sep 25 | Oct 25 | Nov 25 | Dec 25 | Jan 26 | Feb 26 | Mar 26 | Apr 26 | May 26 | Jun 26 | Jul 26 | 12-Mo |
|---|---|---|---|---|---|---|---|---|---|---|---|---|---|
| MNST | +6% | +8% | -1% | +12% | +2% | +5% | +6% | -15% | +6% | +14% | +9% | +0% | +64% |
| CELH | +39% | -9% | +5% | -32% | +12% | +15% | +2% | -34% | -5% | -1% | -12% | -0% | -36% |
| KO | +2% | -3% | +4% | +6% | -4% | +7% | +9% | -6% | +4% | +0% | +4% | +8% | +33% |
| KDP | -11% | -12% | +6% | +3% | +0% | -1% | +10% | -12% | +12% | +2% | +10% | -5% | -1% |
| PEP | +8% | -5% | +4% | +2% | -3% | +7% | +10% | -8% | +2% | -9% | -5% | +3% | +5% |
| COKE | +5% | -0% | +12% | +25% | -6% | -1% | +33% | -5% | +7% | -16% | +10% | -1% | +69% |
Source: Yahoo Finance monthly adjusted close.
Executive Summary
Rating: HOLD | MNST
Measured from adjusted close on 2026-08-04 to 2026-09-18. Sell ratings are correct when the stock falls; Hold is tracked as a +/-10% range. Daily-close data, not intraday. Calls are tracked for 182 days from publication, then frozen as a final record.
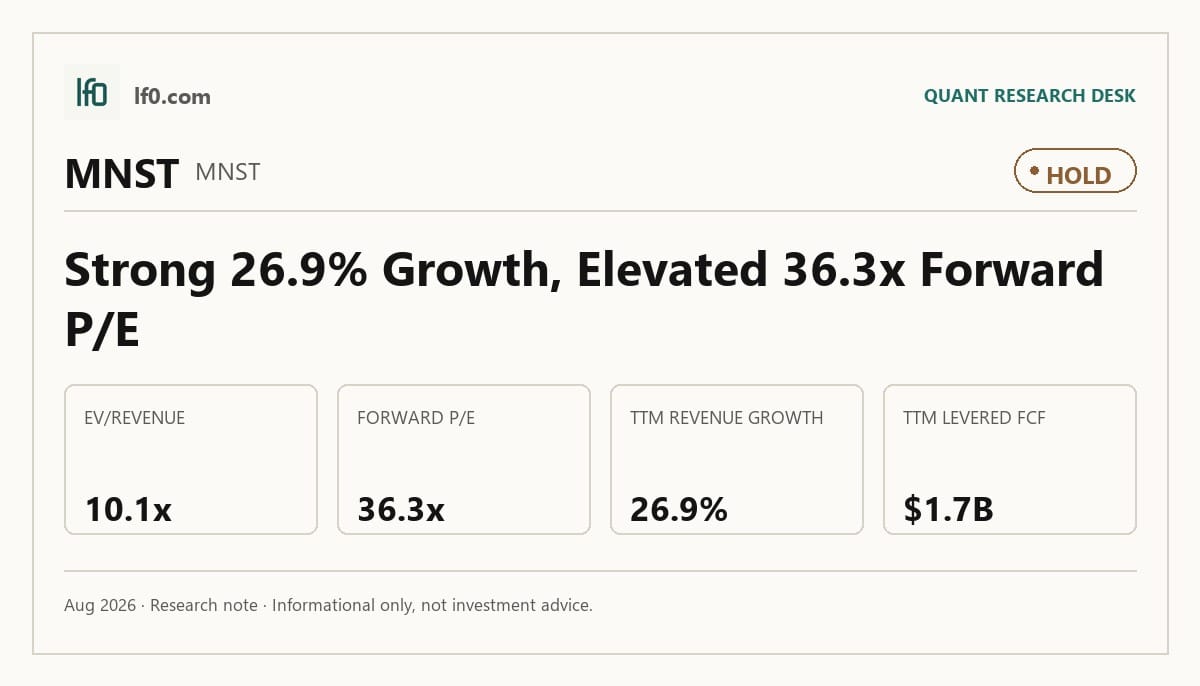
I would put my rating as a Hold because Monster Beverage already prices in a lot of the good news, with 10.1x EV/Revenue, 36.3x forward P/E, and only a 1.8% free cash flow yield on TTM results. The business is still executing well, with TTM revenue up 26.9% and TTM operating margin at 31.0%, but that combination tells me the stock is not cheap enough to ignore execution risk. I would raise my rating more towards a Buy if revenue growth stays above 20.0% for the next two quarters, meaning the Q1 2026 step-up is proving durable rather than a one-quarter rebound.
Company Profile
Monster Beverage Corporation, based in Corona, California, develops, markets, sells, and distributes energy drinks, concentrates, craft beers, flavored malt beverages, and hard seltzers through subsidiaries. It earns revenue mainly by selling ready-to-drink beverages to bottlers and distributors, and by selling concentrates and beverage bases to authorized bottling and canning partners. The company traces its roots to the 1930s Hansen juice business, became Hansen Natural Corporation in 1992, and renamed itself Monster Beverage Corporation in 2012. It operates in 80 countries, has 6,891 employees, and sells through The Coca-Cola Company bottlers, beer distributors, and direct retail channels. Monster is listed on Nasdaq under MNST.
Economic Moat
Business Model
Monster’s distribution system with The Coca-Cola Company bottler network is the hardest element to replicate within 3 years, because the company has already transitioned all U.S. third-party rights to TCCC network bottlers and, except for a handful of countries, TCCC is its preferred distribution partner globally according to their SEC filings. In my view, that route-to-market is more durable than a product launch cycle because it is embedded in long-term distribution agreements of up to 20 years, including the February 2025 renewal of the International Distribution Coordination Agreement for an additional five-year term. A well-funded challenger can copy a can design or a flavor line, but it cannot quickly rebuild the same shelf access, bottler priority, and international reach. Secondary support comes from Monster’s trademark portfolio, which now exceeds 21,600 registered trademarks and pending applications worldwide, and from its perpetual flavor ownership for certain Monster Energy brand concentrates, which makes brand substitution and formula cloning harder.
The business has also broadened, but not in a way that dilutes the core moat. Monster had 3 operating and reportable segments in fiscal 2022 and now has 4, after the 2022 Monster Brewing Company acquisition and the 2023 Bang Energy acquisition expanded the portfolio. The shelf is still anchored by Monster Energy, Reign, Bang, Predator, Fury, and a wider set of international flavors, so the company looks more like a portfolio manager than a single-brand franchise. I think that matters because the moat is not just a single product; it is the combination of brand equity, distribution access, and the ability to keep refreshing the lineup without losing shelf space.
Business & Operating Risks
The single most material risk is Monster’s dependence on The Coca-Cola Company, because the company has transitioned third-party U.S. distribution rights into TCCC’s network and expects TCCC to remain the preferred global distributor. According to the risk factors in their SEC 10-K, Monster has reduced distributor diversification, and TCCC owned approximately 20.9% of common stock as of February 13, 2026. That concentration can slow or block channel changes, and disagreements over distribution agreements have already arisen and may arise again.
The second risk is bottler and contract packer concentration. Monster continued to outsource manufacturing of most non-alcohol finished goods in 2025, and the filing says there are limited alternative packing facilities with adequate capacity for many products. If a strike, work stoppage, or demand spike hits one of those partners, Monster may be unable to secure replacement capacity at commercially reasonable rates and within a reasonably short time period, which would hit shipments, gross margin, and shelf availability at the same time.
A third risk is category pressure in energy drinks, where Monster derives most of its revenue and faces competitive pressure from Celsius Holdings, PRIME, C4, Alani Nu, GHOST, ZOA, and PepsiCo’s long-term distribution arrangement with Celsius. The filing also flags limited shelf space and the possibility of price erosion, which means share gains are not free and may require trade spend or lower pricing. In my view, these risks pressure the distribution moat, but they do not break it yet; the bigger threat is channel concentration, not a collapse in brand relevance.
Management Discussion & Analysis
Management is actively responding to the concentration risk by leaning harder into pricing, international expansion, and capital returns, although the TCCC dependence itself remains unresolved. The company raised prices in the fourth quarters of fiscal 2025 and 2024, and gross profit margin improved to 55.8% in FY2025 from 54.0% in FY2024, which tells me pricing power is still intact. At the same time, promotional allowances, commissions, and other expenses rose to $1.6B in FY2025 from $1.3B in FY2024, or 16.0% of gross billings from 14.7%, so more of the price benefit is being recycled into shelf support.
International growth is doing more of the heavy lifting. Sales outside the United States rose to 3.44B in FY2025 from 2.96B in FY2024 and reached 41% of net sales, so the growth case is increasingly tied to execution abroad and foreign-currency-adjusted sales growth of 16.2% in FY2025. Capital allocation remains shareholder friendly: Monster ended FY2025 with $2.09 billion of cash and cash equivalents, $677.1M of short-term investments, and $487.3M of long-term investments, while still repurchasing shares and keeping capital expenditures, excluding repurchases, likely below $250M through December 31, 2026. That mix supports the equity, but it also means investors should watch whether buybacks are being done at attractive prices rather than simply absorbing excess cash.
Prior filings showed a similar pattern of optimism, and the numbers mostly confirmed it. Management had pointed to pricing actions as a margin driver, and FY2025 gross profit margin did improve, so that claim held up. By contrast, Alcohol Brands net sales fell to $134.7M in FY2025 from $172.3M in FY2024, which means the alcohol push has not yet become a meaningful offset to the core energy franchise. The Bang Energy acquisition completed on July 31, 2023, but Monster Energy Drinks still accounted for 92.4% of FY2025 net sales, so the acquisition did not materially diversify the business mix by FY2025. On balance, management is executing on pricing and cash generation, but the diversification narrative has not yet translated into a broader earnings base.
Recent Events
The most significant development I see here is the $500M share repurchase authorization approved on May 14, 2026. That extends Monster’s capital return program and signals management still sees the stock as a better use of cash than incremental balance-sheet build, which supports the shareholder-return case rather than a reinvestment-heavy one.
Governance continuity is the other clear signal. Stockholders re-elected all ten directors on May 14, 2026, ratified Ernst & Young LLP for FY2026, and approved named executive compensation, which tells me the board and management team still have shareholder backing. Mark J. Hall’s notice on June 1, 2026 that he will resign from the board on August 1, 2026 and leave the company on April 1, 2027 removes a long-tenured insider, but I view that as a manageable change rather than a strategic break.
Taken together, these 8-Ks leave the moat thesis intact: the buyback adds direct support to per-share value, while the planned board departure is a continuity issue, not a signal that the operating model is under stress.
Financial Analysis
Growth
MNST — Financial Growth (Quarterly, USD Mil)
| Metric | 2025-03-31 | 2025-06-30 | 2025-09-30 | 2025-12-31 | 2026-03-31 |
|---|---|---|---|---|---|
| REVENUE (USD Mil) | 1,854.6 | 2,111.6 | 2,197.1 | 2,131.1 | 2,353.3 |
| EBIT (USD Mil) | 582 | 631.6 | 675.4 | 542.6 | 750.7 |
| EBITDA (USD Mil) | 606.9 | 659.2 | 705 | 575.1 | 779.1 |
| NET INCOME (USD Mil) | 443 | 488.8 | 524.5 | 449.2 | 569.5 |
| DILUTED EPS | 0.5 | 0.5 | 0.5 | 0.5 | 0.6 |
Source: Yahoo Finance — Quarterly Financial Statements
Monster Beverage’s revenue rose from $1.9B in Q1 2025 to $2.4B in Q1 2026, a 26.9% year-over-year increase. That followed $2.1B in Q2 2025, $2.2B in Q3 2025, and $2.1B in Q4 2025, so the latest quarter looks like a rebound rather than a straight-line acceleration. EBITDA grew faster than revenue in Q1 2026, up 28.8% year over year to $779.1M, while net income rose 25.8% to $569.5M. I read that as evidence that the core energy franchise is still scaling efficiently, and it is consistent with the distribution advantage described above.
Profitability
MNST — Profitability (TTM)
| Metric | TTM |
|---|---|
| Operating Margin (TTM) | 31.0% |
| Net Margin (TTM) | 23.1% |
| Return on Assets (TTM) | 17.7% |
| Return on Equity (TTM) | 26.7% |
| Gross Margin (TTM) | 55.5% |
| EBITDA Margin (TTM) | 32.1% |
Source: Yahoo Finance — Trailing Twelve Months (TTM)
Monster’s TTM gross margin was 55.5%, EBITDA margin was 32.1%, operating margin was 31.0%, and net margin was 23.1%. The spread from gross margin to operating margin is only 24.5 percentage points, which tells me the business is already past the early scale-up phase and is converting a little more than half of gross profit into operating profit. EBITDA margin sits just 1.1 points above operating margin, so depreciation and amortisation are not masking a weak earnings base. TTM ROA was 17.7% and TTM ROE was 26.7%, and the 8.9-point gap suggests returns are being amplified by leverage rather than pure asset productivity alone. For investors, the key watchpoint is whether operating margin stays above 30.0% and net margin keeps tracking it, because that would confirm the business is still compounding efficiently rather than relying on one-off pricing gains.
Valuation
MNST — Valuation Multiples
| Metric | Value |
|---|---|
| Market Cap (USD Mil) | 92,109 |
| Enterprise Value (USD Mil) | 88,602 |
| Trailing P/E | 45.5 |
| Forward P/E | 36.3 |
| Price/Sales (TTM) | 10.5 |
| Price/Book (mrq) | 10.6 |
| EV/Revenue | 10.1 |
| EV/EBITDA | 31.4 |
| Beta (5Y Monthly) | 0.52 |
| FCF Yield % (TTM) | 1.8% |
| Forward EPS (USD) | 2.6 |
| Analyst Target Price – Low (USD) | 70 |
| Analyst Target Price – Mean (USD) | 96.4 |
| Analyst Target Price – High (USD) | 113 |
| # Analyst Opinions | 23 |
Source: Yahoo Finance
Monster trades at 10.1x EV/Revenue, 31.4x EV/EBITDA, 45.5x trailing P/E, and 36.3x forward P/E, with a 1.8% TTM FCF yield. That is a premium multiple set, but it is backed by 31.0% operating margin, 23.1% net margin, and a net-cash balance sheet, so I do not think the premium is arbitrary. On the analysis here, I would put fair value in a range of 85-105 per share: below that, the stock starts to look more attractive relative to its growth and cash conversion; above that, the market is asking for continued execution with little room for disappointment.
That range sits broadly around the 70–113 analyst target band, with a 96.4 mean across 23 opinions, so I am not fighting consensus so much as leaning a bit more on leverage-adjusted cash generation than the street appears to. I also think the implied earnings path matters: with forward EPS at 2.6, the stock is trading at about 36.3x forward earnings, which is rich versus peers unless Monster keeps compounding revenue and margins together. In my view, the market is paying for durability, not just growth, and that is why the valuation only works if the margin structure stays near current levels.
Leverage
MNST — Leverage & Coverage (Quarterly)
| Metric | Value |
|---|---|
| Total Debt/Equity % (mrq) | 1.1 |
| Current Ratio (mrq) | 3.3 |
| Total Debt (mrq, USD Mil) | 94.5 |
| Operating Cash Flow (TTM, USD Mil) | 2,195.6 |
| Levered Free Cash Flow (TTM, USD Mil) | 1,684.3 |
| Net Debt/EBITDA (TTM) | -1 |
| FCF Margin % (TTM) | 19.2% |
Source: Yahoo Finance — Quarterly Financial Statements
Monster’s balance sheet is effectively net cash, not net debt. Total Debt/Equity was 1.1, Current Ratio was 3.3, and Total Debt was $94.5M, while cash generation was much larger than debt service needs. Total Cash was $3B, Operating Cash Flow was $2.2B TTM, Levered Free Cash Flow was $1.7B TTM, Net Debt/EBITDA was -1.0x, and FCF Margin was 19.2%.
That leaves very little refinancing risk because the company does not need external funding to meet near-term obligations. EBITDA is converting into cash cleanly, so the business has room to absorb a downturn, fund buybacks, and still keep leverage negligible. The leverage profile also supports the valuation premium: a company with this much cash flexibility can sustain a higher multiple than a peer with similar growth but a stretched balance sheet.
Insider Activity
The insider transaction record I see here is one-sided: 15 open-market sales and 0 open-market purchases across 51 filings parsed from 2025-01-08 to 2026-05-22. The selling is also concentrated, with several insiders transacting rather than a single isolated seller, which points to limited near-term alignment between insiders and outside shareholders. I would not overread it on its own, but it is a bear signal when paired with a stock that already trades at a premium multiple.
Comparable Analysis
Growth
| Company | Revenue TTM (USD Mil) | Revenue Growth YoY % | EBITDA TTM (USD Mil) | Diluted EPS TTM |
|---|---|---|---|---|
| MNST | 8,793.1 | 26.9% | 2,822.3 | 2.1 |
| CELH | 2,968.6 | 137.7% | 679.3 | 0.4 |
| KO | 50,129 | 6.7% | 16,998 | 3.3 |
| KDP | 16,944 | 9.4% | 4,442 | 1.4 |
| PEP | 96,904 | 6.4% | 18,882 | 7.6 |
| COKE | 7,494.8 | 8.3% | 1,216 | 7.3 |
Source: Yahoo Finance
MNST’s revenue growth of 26.9% TTM is far ahead of KO at 6.7%, PEP at 6.4%, KDP at 9.4%, and COKE at 8.3%, while CELH is the only peer with a faster top line at 137.7% TTM. That premium is justified only in part: MNST is growing much faster than the mature beverage peers, but CELH’s faster growth is coming off a much smaller $3B revenue base, so MNST still looks like the more durable large-cap grower rather than the highest-growth name.
Valuation
| Company | Trailing P/E | Forward P/E | EV/Revenue | EV/EBITDA | Price/Sales (TTM) | Price/Book (mrq) | Market Cap (USD Mil) | Enterprise Value (USD Mil) | Beta (5Y Monthly) | FCF Yield % (TTM) | Forward EPS | Analyst Target Price – Low | Analyst Target Price – Mean | Analyst Target Price – High | # Analyst Opinions |
|---|---|---|---|---|---|---|---|---|---|---|---|---|---|---|---|
| MNST | 45.5 | 36.3 | 10.1 | 31.4 | 10.5 | 10.6 | 92,109 | 88,602 | 0.52 | 1.8% | 2.6 | 70 | 96.4 | 113 | 23 |
| CELH | 68.7 | 15 | 3.1 | 13.4 | 2.5 | 6.1 | 7,552 | 9,103 | 0.92 | 2.4% | 2 | 39 | 54.3 | 85 | 21 |
| KO | 26.2 | 24.5 | 8.1 | 23.8 | 7.4 | 10.3 | 372,429 | 403,774 | 0.34 | 1.4% | 3.5 | 75 | 94.7 | 104 | 23 |
| KDP | 23 | 12.3 | 4.6 | 17.6 | 2.5 | 1.7 | 42,313 | 78,387 | 0.41 | -38.6% | 2.5 | 28 | 35.2 | 42 | 17 |
| PEP | 18.3 | 15.5 | 2.4 | 12.4 | 2 | 8.6 | 190,011 | 233,250 | 0.36 | 4.1% | 9 | 124 | 155 | 183 | 22 |
| COKE | 24.9 | 4.6 | 0.4 | 2.3 | 1.6 | 3.8 | 12,048 | 2,761 | 0.55 | 4.4% | 38.9 | — | — | — | — |
Source: Yahoo Finance
MNST trades at 10.1x EV/Revenue, 45.5x trailing P/E, 36.3x forward P/E, and a 1.8% FCF yield, versus KO at 8.1x EV/Revenue, 26.2x trailing P/E, 24.5x forward P/E, and 1.4% FCF yield; PEP at 2.4x EV/Revenue, 18.3x trailing P/E, 15.5x forward P/E, and 4.1% FCF yield; KDP at 4.6x EV/Revenue, 23.0x trailing P/E, 12.3x forward P/E, and a negative 38.6% FCF yield; CELH at 3.1x EV/Revenue, 68.7x trailing P/E, 15.0x forward P/E, and 2.4% FCF yield; and COKE at 0.4x EV/Revenue, 24.9x trailing P/E, 4.6x forward P/E, and 4.4% FCF yield. On a peer-multiple basis, MNST screens expensive, but the gap is only partly offset by its stronger growth and cleaner balance sheet. Using the peer EV/Revenue range of 0.4x to 8.1x on MNST’s $8.8B TTM revenue gives an illustrative EV range of about $3.2B to $71B, or roughly $0 to $71 per share after netting MNST’s $3B cash and $94.5M debt across 978.0M shares, which shows the stock is already pricing in a premium outcome rather than a base case.
Profitability
| Company | Operating Margin (TTM) | Net Margin (TTM) | Return on Assets (TTM) | Return on Equity (TTM) | Gross Margin (TTM) | EBITDA Margin (TTM) |
|---|---|---|---|---|---|---|
| MNST | 31.0% | 23.1% | 17.7% | 26.7% | 55.5% | 32.1% |
| CELH | 19.8% | 5.9% | 11.5% | 8.1% | 50.3% | 22.9% |
| KO | 34.9% | 28.6% | 9.4% | 42.1% | 61.9% | 33.9% |
| KDP | 19.0% | 10.8% | 3.6% | 6.3% | 53.8% | 26.2% |
| PEP | 16.8% | 10.8% | 8.9% | 51.5% | 54.2% | 19.5% |
| COKE | 7.4% | 7.7% | 12.7% | 135.2% | 39.7% | 16.2% |
Source: Yahoo Finance
MNST’s operating margin of 31.0%, net margin of 23.1%, gross margin of 55.5%, and EBITDA margin of 32.1% all sit above CELH’s 19.8%, 5.9%, 50.3%, and 22.9%, above KDP’s 19.0%, 10.8%, 53.8%, and 26.2%, and above PEP’s 16.8%, 10.8%, 54.2%, and 19.5%, while KO is the only peer with a higher operating margin at 34.9% and net margin at 28.6%. The pattern looks structural rather than cyclical: MNST’s gross margin advantage over CELH and KDP is paired with a wider operating-margin gap, which points to better cost of goods and better operating leverage, not just lower overhead.
Leverage
| Company | Total Debt/Equity % (mrq) | Current Ratio (mrq) | Total Debt (mrq, USD Mil) | Operating Cash Flow TTM (USD Mil) | Free Cash Flow TTM (USD Mil) | Net Debt/EBITDA (TTM) | FCF Margin % (TTM) |
|---|---|---|---|---|---|---|---|
| MNST | 1.1 | 3.3 | 94.5 | 2,195.6 | 1,684.3 | -1 | 19.2% |
| CELH | 22.4 | 1.8 | 675.9 | 329.8 | 177.8 | 0.2 | 6.0% |
| KO | 115.5 | 1.3 | 44,261 | 16,342 | 5,218.8 | 1.6 | 10.4% |
| KDP | 86 | 2.3 | 28,891 | 2,063 | -16,345.5 | 6.3 | -96.5% |
| PEP | 238.9 | 0.9 | 53,214 | 13,456 | 7,831.9 | 2.3 | 8.1% |
| COKE | 197.9 | 1.2 | 1,118.8 | 939 | 531.1 | 0.9 | 7.1% |
Source: Yahoo Finance
MNST’s total debt to equity of 1.1 and net debt to EBITDA of -1.0x are cleaner than every peer except KO’s 1.6x net debt to EBITDA and COKE’s 0.9x, while PEP sits at 2.3x and KDP at 6.3x. That cash-rich profile is a real support for valuation because MNST’s 19.2% FCF margin and $1.7B of FCF TTM translate into about $1.72 per share of annual free cash flow, giving it far more financial flexibility than CELH’s 6.0% FCF margin or KDP’s negative 96.5% FCF margin. The leverage gap also explains part of the valuation gap versus peers: investors are paying for balance-sheet safety as well as for the business itself.
Conclusion
I would put my rating as a Hold because Monster’s premium multiple is already backed by real operating strength, but the stock still needs the current growth rate to hold up. The key tension is that the moat is intact and the numbers are good, yet the market is already paying for that durability at 10.1x EV/Revenue and 36.3x forward P/E.
I would raise my rating more towards a Buy if revenue growth stays above 20.0% for the next two quarters, meaning the Q1 2026 rebound is not just a one-off, and if operating margin stays above 30.0%, which would show the company is still converting pricing into profit rather than spending it away on promotions. If that happens, the current multiple would look easier to defend because the earnings base would be larger and the cash conversion would remain strong.
I would move from Hold to Sell if revenue growth falls below 15.0% for two straight quarters, because that would tell me the growth premium is fading while the stock still trades at a rich sales multiple. I would also get more cautious if FCF margin slips below 15.0%, which would mean the current 19.2% cash conversion is no longer supporting buybacks and the balance-sheet cushion is less valuable than it looks today.
After weighing both paths, I still lean to Hold. The bull case is already visible in the numbers, while the bear case would need only a modest slowdown to matter, so I do not see enough upside from here to move beyond a neutral stance.
What’s your take? I rated Monster Beverage (MNST) HOLD above — but the goal here is to get this right, not just to publish an opinion. What would you add to this analysis, or which risk or catalyst do you think I’m under- or over-weighting? Tell me in the comments.
Sources
- SEC 10-K Annual Report — filed 2026-02-27
- SEC 8-K Filing (2026-06-04)
- SEC 8-K Filing (2026-05-15)
- SEC 8-K Filing (2026-05-07)
- SEC 8-K Filing (2026-02-26)
- SEC Form 4 Insider Transaction (2026-05-27)
- SEC Form 4 Insider Transaction (2026-05-27)
- SEC Form 4 Insider Transaction (2026-05-15)
- SEC 10-K Annual Report — FY2026
- SEC 10-K Annual Report — FY2025
- SEC 10-K Annual Report — FY2024
- SEC 10-K Annual Report — FY2023
- SEC 10-K Annual Report — FY2022
Data sourced from Yahoo Finance and SEC EDGAR. Not investment advice.
Leave a Comment