
| Company | Oct 25 | Nov 25 | Dec 25 | Jan 26 | Feb 26 | Mar 26 | Apr 26 | May 26 | Jun 26 | Jul 26 | Aug 26 | Sep 26 | 12-Mo |
|---|---|---|---|---|---|---|---|---|---|---|---|---|---|
| HUBS | +5% | -25% | +9% | -30% | -6% | -8% | -9% | -1% | -17% | +30% | +10% | -22% | -56% |
| CRM | +10% | -11% | +15% | -20% | -8% | -4% | -5% | +8% | -18% | +17% | +40% | -11% | -2% |
| GDDY | -3% | -4% | -3% | -19% | -13% | -5% | +5% | -1% | -1% | -3% | +18% | -2% | -30% |
| WIX | -18% | -34% | +9% | -16% | -19% | +28% | -17% | -25% | -19% | +21% | +60% | -18% | -59% |
| ZM | +6% | -3% | +2% | +7% | -20% | +9% | +21% | +5% | -15% | +11% | +1% | -6% | +10% |
| TWLO | +35% | -4% | +10% | -15% | +0% | +4% | +18% | +29% | +8% | -4% | +19% | +24% | +192% |
Source: Yahoo Finance monthly adjusted close.
Quick Thesis
- Rated Hold — growth is solid, but margins are still too thin for a higher call.
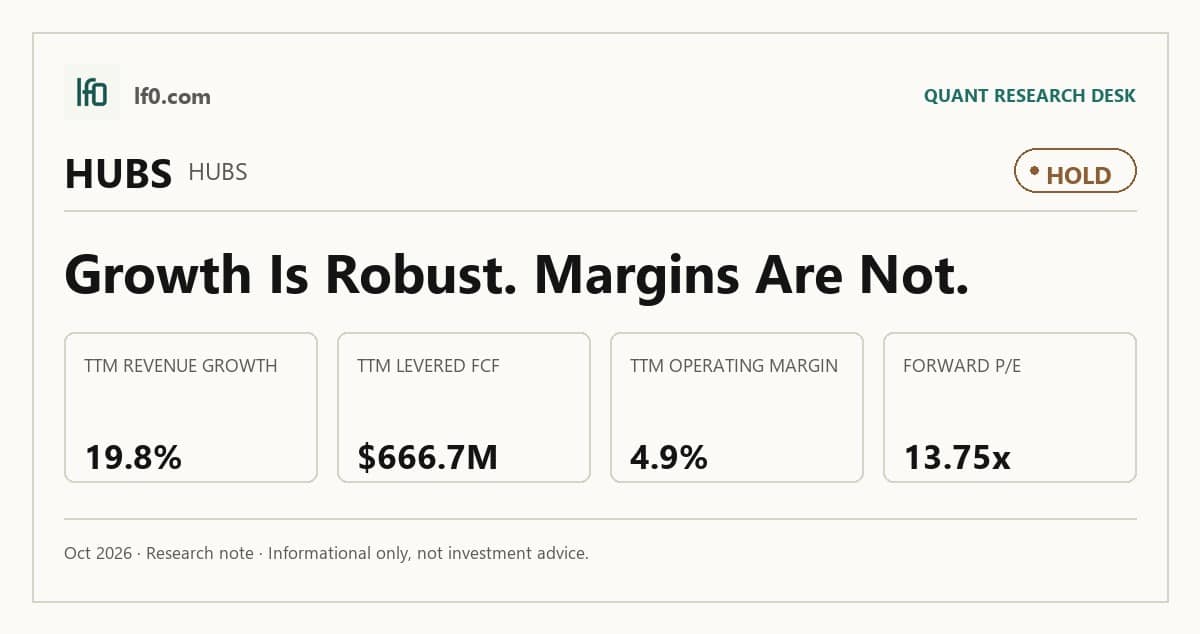
- Revenue reached $911.7M in Q2 2026, up 19.8% TTM.
- The key risk is only 4.9% operating margin and 4.3% net margin.
- Valuation is fair to slightly cheap at 2.98x EV/revenue and 13.7x forward P/E.
- I would move more constructive if operating margin moves toward 7.0%.
Executive Summary
Rating: HOLD | HUBS
Measured from adjusted close on 2026-10-12 to 2026-10-12. Sell ratings are correct when the stock falls; Hold is tracked as a +/-10% range. Daily-close data, not intraday. Calls are tracked for 182 days from publication, then frozen as a final record.
I would put my rating as a Hold because HubSpot is still growing revenue quickly, but it has not yet turned that scale into enough operating leverage to justify a stronger call. Revenue reached $911.7M in Q2 2026, up from $760.9M in Q2 2025, yet operating margin was only 4.9% TTM and net margin was 4.3% TTM, so the business is still spending heavily to defend growth rather than converting it into durable profit.
The most important strength is cash generation. Levered free cash flow was $666.7M TTM, which translates into a 5.8% FCF yield and gives the company room to keep investing without stressing the balance sheet. The main risk is that the current growth rate may not be enough to absorb the cost base if revenue decelerates further.
I would become more constructive if HubSpot can hold revenue growth above 15% for another two quarters while lifting operating margin toward 7.0%, because that would show the model is scaling rather than merely expanding. If growth slips below 10.0% for two consecutive quarters, I would move from Hold toward Sell because the valuation would then be leaning on a growth premium that the business is no longer earning.
Company Profile
HubSpot provides an agentic customer platform for mid-market B2B companies with 2 to 2,000 employees, sold primarily on subscription. The platform combines AI-powered agents, Smart CRM, and connected hubs for marketing, sales, service, operations, content, and commerce, supported by integrations, templates, partners, and training. Founded in 2005, it is listed on Nasdaq under HUBS and had 288,706 customers in more than 135 countries as of December 31, 2025.
Economic Moat
Business Model
The core of HubSpot’s moat is Smart CRM, which sits at the center of a unified customer view across lead, sales, service, operations, commerce, and content data. In my view, that data layer is hard to replicate quickly because it becomes more valuable as more teams use the same login and interface, and because it is embedded across multiple hubs rather than a single point product. The freemium motion, Solutions Partner network, and more than 2,000 integrations reinforce adoption and make switching harder for mid-market customers.
The AI layer strengthens the platform, but I do not see it as a standalone moat. Breeze and the AI-powered agents matter because they improve enrichment, qualification, support, and content creation after a customer is already inside the system, which makes the installed base more valuable rather than creating a separate barrier on its own.
Business & Operating Risks
The most material disclosed risk is pricing and renewal pressure on the subscription base. HubSpot says customers have no obligation to renew because substantially all contracts are one year or less, and that means a weaker renewal cycle would show up first in lower average revenue per customer rather than in a sudden collapse in logos. Competition from larger suites and AI-native point applications adds to that pressure because rivals can bundle similar functionality at low incremental cost.
Execution on AI is another real risk. The company is committing meaningful resources to Breeze and machine learning before knowing how quickly customers will adopt those tools, and it also depends on third-party data, APIs, and cloud hosting, including Amazon Web Services. The disclosed risks do not directly threaten the Smart CRM moat itself, but they do test whether HubSpot can keep the platform differentiated enough to defend pricing and retention.
Management Discussion & Analysis
Management is responding to those risks by leaning harder into product breadth and capital return. The new share repurchase authorization and the revolving credit facility give the company flexibility, while the continued investment in AI suggests management is trying to deepen the platform rather than defend a narrower product set. That is the right response to the competitive pressure, although the unresolved question is whether the spend will translate into better operating leverage.
The spending pattern is still the key tell. Sales and marketing and R&D both rose in 2025, which supports the growth strategy, but it also means management is choosing to buy scale before harvesting margin. I think that is defensible, but it is not yet proof that the moat is widening.
Recent Events
The March 31, 2026 board refresh, which expanded the board to 12 directors and added Mike Berry as future Audit Committee chair, is a governance-positive change. It does not alter the operating thesis, but it does support oversight at a company that is still scaling.
The March 11, 2026 bylaw amendment moved Securities Act and Exchange Act disputes into federal district courts, which should reduce forum-shopping risk and make litigation handling more predictable. The February and May 2026 8-Ks were routine earnings releases, so I do not see a new strategic catalyst or a structural setback in the recent filings.
Financial Analysis
Growth
HUBS — Financial Growth (Quarterly, USD Mil)
| Metric | 2025-06-30 | 2025-09-30 | 2025-12-31 | 2026-03-31 | 2026-06-30 |
|---|---|---|---|---|---|
| REVENUE (USD Mil) | 760.9 | 809.5 | 846.7 | 881 | 911.7 |
| EBIT (USD Mil) | -5.2 | 23.1 | 61.7 | 39.5 | 50 |
| EBITDA (USD Mil) | 28 | 58.8 | 100.2 | 79.8 | 94.4 |
| NET INCOME (USD Mil) | -3.3 | 16.5 | 54.4 | 32.6 | 43.3 |
| DILUTED EPS | -0.1 | 0.3 | 1 | 0.6 | 0.9 |
Source: Yahoo Finance — Quarterly Financial Statements
Revenue rose from $760.9M in Q2 2025 to $911.7M in Q2 2026, and the latest four quarters show a steady climb from $809.5M to $846.7M to $881M to $911.7M. That is still healthy growth, but the pace has eased from 10.4% year over year in Q3 2025 to 6.8% in Q2 2026, which tells me the business is scaling well but not accelerating.
EBITDA moved from $28M to $94.4M over the same span, but the Q1 2026 dip to $79.8M shows that margin expansion is not linear. I read that as a reminder that revenue growth alone is not enough here; the thesis depends on the company turning that growth into more consistent operating leverage.
Profitability
HUBS — Profitability (TTM)
| Metric | TTM |
|---|---|
| Operating Margin (TTM) | 4.9% |
| Net Margin (TTM) | 4.3% |
| Return on Assets (TTM) | 2.4% |
| Return on Equity (TTM) | 7.9% |
| Gross Margin (TTM) | 83.2% |
| EBITDA Margin (TTM) | 4.5% |
Source: Yahoo Finance — Trailing Twelve Months (TTM)
TTM gross margin was 83.3%, operating margin was 4.9%, net margin was 4.3%, EBITDA margin was 4.5%, ROA was 2.4%, and ROE was 7.9%. The spread between gross margin and operating margin shows the product itself is efficient, but the company is still spending heavily on sales, product, and support to keep the platform growing.
That gap is the right way to think about the stock. HubSpot is already profitable, but the market will not pay a premium multiple forever unless operating margin starts to widen in a visible way. In my view, the next important proof point is whether the company can lift operating margin without sacrificing the growth rate that still supports the franchise.
Valuation
HUBS — Valuation Multiples
| Metric | Value |
|---|---|
| Current Share Price (USD) | 231.5 |
| Market Cap (USD Mil) | 11,544 |
| Enterprise Value (USD Mil) | 10,283 |
| Trailing P/E | 82.7 |
| Forward P/E | 13.7 |
| Price/Sales (TTM) | 3.3 |
| Price/Book (mrq) | 6.9 |
| EV/Revenue | 3 |
| EV/EBITDA | 65.6 |
| Beta (5Y Monthly) | 1.24 |
| FCF Yield % (TTM) | 5.8% |
| Forward EPS (USD) | 16.8 |
| Analyst Target Price – Low (USD) | 190 |
| Analyst Target Price – Mean (USD) | 248.8 |
| Analyst Target Price – High (USD) | 320 |
| # Analyst Opinions | 30 |
Source: Yahoo Finance
HubSpot trades at 2.98x EV/revenue, 3.35x price/sales, and 13.7x forward P/E, with a current share price of $231.5 and an enterprise value of $10.3B. The cleaner cash signal is the 5.8% FCF yield, which implies the stock is not expensive on cash generation, even though trailing P/E is 82.7x because the earnings base is still catching up.
On the analysis here, I would put fair value in a range of roughly $220-$280. That sits around the $248.8 analyst mean target and inside the $190-$$320 consensus range, so I do not need to fight the Street to justify a Hold. I would not pay much more than that range unless operating margin moves materially higher, because the current multiple already assumes that revenue growth stays durable.
The implied earnings picture is similar. Forward EPS is 16.8, and that looks reasonable against peers that have stronger margins but slower growth, while HubSpot’s own forward multiple is still below the richer software names. In my view, the market is paying for growth and cash conversion, but not yet for a full margin re-rating.
Leverage
HUBS — Leverage & Coverage (Quarterly)
| Metric | Value |
|---|---|
| Total Debt/Equity % (mrq) | 14.3 |
| Current Ratio (mrq) | 1.4 |
| Total Debt (mrq, USD Mil) | 236.9 |
| Operating Cash Flow (TTM, USD Mil) | 856.4 |
| Levered Free Cash Flow (TTM, USD Mil) | 666.7 |
| Net Debt/EBITDA (TTM) | -7 |
| FCF Margin % (TTM) | 19.3% |
Source: Yahoo Finance — Quarterly Financial Statements
Total debt was $236.9M mrq, total debt/equity was 14.3%, and the current ratio was 1.4x, so the balance sheet is comfortably liquid. More important, HubSpot had $856.4M of operating cash flow and $666.7M of levered free cash flow over the last twelve months, which means the business is funding itself rather than leaning on debt.
Net debt/EBITDA was -7.0x, which is a net cash position, and FCF margin was 19.3%. That combination gives management flexibility to keep investing in the platform, but it also means the investment case is not about balance-sheet repair; it is about whether the company can convert that financial strength into better operating margins.
Insider Activity
The insider tape is net negative. Brian Halligan sold shares in multiple transactions, while the buying was smaller and more limited, so the overall pattern does not read as strong insider conviction at the current price.
I do not put too much weight on one quarter of insider activity, but I do think the direction matters when the stock is already priced for continued growth. The message here is caution rather than alarm.
Comparable Analysis
Growth
| Company | Revenue TTM (USD Mil) | Revenue Growth YoY % | EBITDA TTM (USD Mil) | Diluted EPS TTM |
|---|---|---|---|---|
| HUBS | 3,449 | 19.8% | 156.7 | 2.8 |
| CRM | 43,938 | 10.8% | 12,899 | 10.9 |
| GDDY | 5,104.1 | 6.6% | 1,379 | 6.7 |
| WIX | 2,133.7 | 14.9% | -147.8 | -3.4 |
| ZM | 4,993.1 | 4.9% | 1,333.8 | 10.8 |
| TWLO | 5,572.3 | 22.0% | 499.8 | 7.2 |
Source: Yahoo Finance
HubSpot’s 19.8% revenue growth TTM puts it near the top of the peer set, ahead of CRM at 10.8%, GDDY at 6.6%, and ZM at 4.9%, while trailing TWLO’s 22.0% and WIX’s 14.9%. That is the right place for the stock to be if investors are paying for growth, but the comparison also shows that HubSpot is not alone in delivering strong top-line expansion.
Valuation
| Company | Current Share Price (USD) | Trailing P/E | Forward P/E | EV/Revenue | EV/EBITDA | Price/Sales (TTM) | Price/Book (mrq) | Market Cap (USD Mil) | Enterprise Value (USD Mil) | Beta (5Y Monthly) | FCF Yield % (TTM) | Forward EPS | Analyst Target Price – Low | Analyst Target Price – Mean | Analyst Target Price – High | # Analyst Opinions |
|---|---|---|---|---|---|---|---|---|---|---|---|---|---|---|---|---|
| HUBS | 231.5 | 82.7 | 13.7 | 3 | 65.6 | 3.3 | 6.9 | 11,544 | 10,283 | 1.24 | 5.8% | 16.8 | 190 | 248.8 | 320 | 30 |
| CRM | 239 | 21.9 | 14.9 | 5 | 17 | 4.5 | 5.1 | 196,697 | 219,547 | 1.26 | 9.0% | 16 | 160 | 283.4 | 475 | 54 |
| GDDY | 103.1 | 15.3 | 9.3 | 3.1 | 11.5 | 2.6 | 1,944.3 | 13,051 | 15,855 | 0.94 | 9.2% | 11 | 76 | 106.8 | 170 | 16 |
| WIX | 76.4 | — | 11.2 | 2 | -29.5 | 1.5 | -1.9 | 3,198 | 4,367 | 1.01 | 13.8% | 6.8 | 50 | 79.7 | 135 | 20 |
| ZM | 99.8 | 9.3 | 15.7 | 4.3 | 16 | 5.8 | 2.6 | 29,114 | 21,329 | 1.03 | 6.8% | 6.3 | 79 | 118.2 | 135 | 25 |
| TWLO | 287.9 | 39.8 | 42.3 | 7.7 | 85.8 | 7.9 | 4.9 | 44,213 | 42,865 | 1.36 | 2.2% | 6.8 | 165 | 265.7 | 335 | 28 |
Source: Yahoo Finance
HubSpot’s 2.98x EV/revenue is below CRM at 5.0x, ZM at 4.3x, and TWLO at 7.7x, while its 13.7x forward P/E is below CRM at 14.9x and far below TWLO at 42.3x. Against that backdrop, the stock looks fair to slightly cheap on a growth-adjusted basis, especially because its balance sheet is stronger than most of the group.
The peer set also helps frame the market’s message. HubSpot’s 5.8% FCF yield is below CRM and GDDY, but it is still solid for a company growing this fast, and the market is not assigning it a premium multiple that would require perfect execution. That is why I think the current valuation supports a Hold rather than a more aggressive call.
Profitability
| Company | Operating Margin (TTM) | Net Margin (TTM) | Return on Assets (TTM) | Return on Equity (TTM) | Gross Margin (TTM) | EBITDA Margin (TTM) |
|---|---|---|---|---|---|---|
| HUBS | 4.9% | 4.3% | 2.4% | 7.9% | 83.2% | 4.5% |
| CRM | 21.4% | 22.0% | 5.7% | 19.4% | 77.3% | 29.4% |
| GDDY | 27.1% | 17.8% | 9.9% | 442.9% | 63.8% | 27.0% |
| WIX | -5.6% | -8.2% | -5.8% | — | 66.6% | -6.9% |
| ZM | 24.6% | 65.2% | 6.1% | 32.1% | 77.7% | 26.7% |
| TWLO | 7.8% | 20.6% | 2.1% | 13.5% | 48.6% | 9.0% |
Source: Yahoo Finance
HubSpot’s 83.3% gross margin is the best in the group, but its 4.9% operating margin and 4.3% net margin trail CRM at 21.4% and 22.0%, GDDY at 27.1% and 17.8%, and TWLO at 7.8% and 20.6%. The message is clear: the product economics are strong, but the company is still spending more aggressively than the most profitable peers.
That gap matters because it explains why HubSpot trades at a discount to some faster-monetizing software names despite similar or better growth. Until operating margin starts to move up, the market is likely to keep treating HubSpot as a good business rather than a best-in-class earnings compounder.
Leverage
| Company | Total Debt/Equity % (mrq) | Current Ratio (mrq) | Total Debt (mrq, USD Mil) | Operating Cash Flow TTM (USD Mil) | Free Cash Flow TTM (USD Mil) | Net Debt/EBITDA (TTM) | FCF Margin % (TTM) |
|---|---|---|---|---|---|---|---|
| HUBS | 14.3 | 1.4 | 236.9 | 856.4 | 666.6 | -7 | 19.3% |
| CRM | 110.4 | 0.8 | 42,376 | 15,750 | 17,731.9 | 2.4 | 40.4% |
| GDDY | 57,334.3 | 0.6 | 3,841.4 | 1,728.8 | 1,205 | 1.9 | 23.6% |
| WIX | — | 0.6 | 2,038.7 | 421.1 | 442.4 | -7.3 | 20.7% |
| ZM | 0.5 | 3.8 | 60.3 | 2,000.2 | 1,975.5 | -5.4 | 39.6% |
| TWLO | 11.9 | 4.6 | 1,065.5 | 1,060.7 | 954.7 | -3.2 | 17.1% |
Source: Yahoo Finance
HubSpot’s 14.3% debt/equity and -7.0x net debt/EBITDA are much cleaner than CRM’s 110.4% and 2.4x, and far better than GDDY’s 57,334.3% and 1.9x. The company also has a 1.4x current ratio, which is enough liquidity for a software platform that is already generating strong free cash flow.
That balance-sheet strength supports the valuation case because it reduces financial risk while the company is still investing for growth. In other words, HubSpot does not need a lower multiple to compensate for leverage, but it does need better margin conversion to justify a higher one.
Conclusion
I would put my rating as a Hold because the stock’s main tension is still unresolved: HubSpot has the growth and balance-sheet quality to deserve respect, but it has not yet shown enough operating leverage to earn a clear premium. Revenue is still rising at a healthy pace, and the company is generating real cash, yet the 4.9% operating margin and 4.3% net margin tell me the earnings base is not catching up fast enough.
I would raise my rating more toward a Buy if operating margin moves toward 7.0% while revenue growth stays above 15.0% for another two quarters. That would tell me the platform is scaling in a way that converts growth into profit, not just into more spending. On the current $3.1B revenue base, that margin move would add meaningful annual operating profit and would make the current multiple easier to defend.
I would move from Hold toward Sell if revenue growth falls below 10.0% for two straight quarters, especially if operating margin also slips back toward 3.0%. That combination would mean the market is still paying for a growth premium that the business is no longer delivering, and it would remove the main support under the valuation.
For now, I think the more likely path is a slower rerating rather than a sharp break either way. The stock already reflects a lot of optimism, but the business still has enough cash generation and balance-sheet strength that I would wait for the margin line to prove itself before turning more bullish.
What to Watch Next
- Operating margin toward 7.0% — would support a move toward Buy.
- Revenue growth above 15.0% for two more quarters — would confirm the growth base is intact.
- Revenue growth below 10.0% for two quarters — would raise the risk of a Sell call.
- FCF yield staying near 5.8% — would support the current valuation.
- Net debt/EBITDA staying negative — would keep the balance sheet a strength.
What’s your take? I rated HubSpot (HUBS) HOLD above — but the goal here is to get this right, not just to publish an opinion. What would you add to this analysis, or which risk or catalyst do you think I’m under- or over-weighting? Tell me in the comments.
Sources
- SEC 10-K Annual Report — filed 2026-02-11
- SEC 8-K Filing (2026-05-07)
- SEC 8-K Filing (2026-04-01)
- SEC 8-K Filing (2026-03-11)
- SEC 8-K Filing (2026-02-11)
- SEC Form 4 Insider Transaction (2026-06-02)
- SEC Form 4 Insider Transaction (2026-06-02)
- SEC Form 4 Insider Transaction (2026-06-02)
Data sourced from Yahoo Finance and SEC EDGAR. Not investment advice.
Leave a Comment