
| Company | Oct 25 | Nov 25 | Dec 25 | Jan 26 | Feb 26 | Mar 26 | Apr 26 | May 26 | Jun 26 | Jul 26 | Aug 26 | Sep 26 | 12-Mo |
|---|---|---|---|---|---|---|---|---|---|---|---|---|---|
| INOD | -3% | -23% | -11% | +9% | -20% | -13% | +9% | +149% | -28% | -17% | -10% | +17% | -15% |
| EXLS | -11% | +2% | +7% | -8% | -20% | -3% | +5% | -9% | -11% | +31% | +12% | -10% | -22% |
| ICFI | -13% | -3% | +9% | +9% | -11% | -21% | +10% | -4% | +6% | +11% | +10% | -7% | -10% |
| CNDT | -15% | -18% | -1% | -28% | +5% | -12% | +34% | +1% | -16% | +8% | +10% | -9% | -44% |
| TASK | -25% | -14% | +3% | -8% | -2% | -3% | -3% | -2% | -26% | +30% | +36% | -5% | -33% |
| EPAM | +8% | +14% | +10% | +2% | -32% | -4% | -16% | -10% | -23% | +33% | +12% | -8% | -28% |
Source: Yahoo Finance monthly adjusted close.
Quick Thesis
- Rated Hold — exceptional growth, but the stock already prices in a lot of it.
- Strongest support: 169.8M of levered free cash flow TTM and an 8.0% FCF yield.
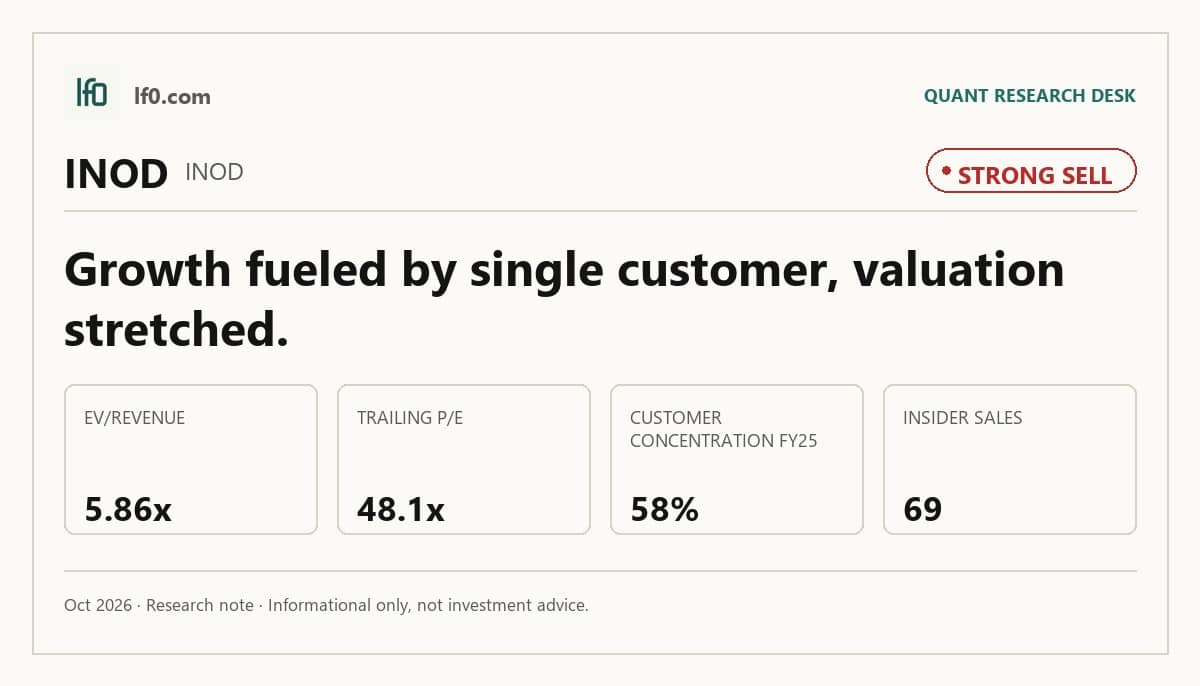
- Biggest risk: one DDS customer generated about 58% of fiscal 2025 revenue.
- Valuation is rich at 5.9x EV/Revenue and 31.4x EV/EBITDA.
- I would turn more constructive if DDS concentration falls below 50% while quarterly revenue stays above 90M.
Executive Summary
Rating: STRONG SELL | INOD
Measured from adjusted close on n/a to 2026-10-09. Sell ratings are correct when the stock falls; Hold is tracked as a +/-10% range. Daily-close data, not intraday. Calls are tracked for 182 days from publication, then frozen as a final record.
I would put my rating as a Hold because Innodata’s growth is real, but the market is already paying for it at a level that leaves little margin for error. The company has moved from a broad data-engineering vendor toward a more specialized AI lifecycle provider, and I think that is the right strategic direction; the problem is that the current valuation assumes that momentum persists without interruption. The key strength is the combination of 169.8M of levered free cash flow TTM and a net-cash balance sheet, which gives management room to keep investing without financial strain. The key risk is customer concentration, with one DDS customer generating about 58% of fiscal 2025 revenue, so a contract reset would hit the numbers quickly. I would raise my rating more towards a Buy if DDS concentration falls below 50% of revenue while quarterly revenue stays above 90M, because that would show the growth base is broadening rather than simply scaling around one account.
Company Profile
Innodata Inc. is a data engineering and AI services company that supports training, post-training, evaluation, and deployment for frontier AI labs, technology companies, and enterprises. It earns revenue through project-based master service agreements, with work ordered under statements of work, service orders, or purchase orders, and it also sells AI-enabled platforms including Synodex, which structures medical records, and Agility PR Solutions, a media intelligence and public relations software platform. Founded in 1988, it began building proprietary AI language models in 2016 and 2017, then expanded into integrated AI lifecycle data services. The company is headquartered in Ridgefield Park, New Jersey and operates globally across more than 70 countries.
Economic Moat
Business Model
The training and post-training data pipeline is the most defensible part of Innodata’s model because the company is embedded across the AI lifecycle from data development to alignment, safety evaluation, and deployment support. I feel that a competitor can copy a labeling workflow, but it is much harder to replicate the combination of specialized human judgment, secure delivery, and repeated exposure to frontier-model use cases within a short time frame. Its ISO/IEC 27001:2022 certified operations in Asia and New Jersey, plus proprietary platforms such as Synodex and Agility, add support, but the operating model itself is the real moat. That matters because the business is not selling generic labor; it is selling a workflow that becomes more valuable as model builders need auditable, high-stakes evaluation.
Business & Operating Risks
One customer in the DDS segment generated about 58% of total revenues in fiscal 2025, and the contracts are generally terminable on 30 to 90 days’ notice, so customer concentration is the clearest disclosed risk. The company also depends on third-party technology and third-party content, especially in Agility, where outside providers can restrict access, stop supplying content, or raise prices. A third risk is pricing pressure from leaner AI vendors and a rapidly evolving regulatory backdrop, which can raise compliance cost while squeezing margins. The concentration risk does not directly break the moat, but it does mean the moat is narrower in practice than the business description suggests, because one account can still dominate the earnings stream.
Management Discussion & Analysis
Management is still investing for growth, and I think that is the right response to the concentration risk even if it does not solve it yet. Cash and cash equivalents rose to 84.9M at December 31, 2025 from 46.9M a year earlier, while 2026 capital expenditures are expected to approximate 12.1M for technology, equipment, new platform development, and infrastructure upgrades. Revenue increased to 251.7M in 2025 from 170.5M in 2024, but the mix remained uneven because DDS carried the growth while Synodex softened and Agility slipped into a small loss. In my view, management is actively responding to the need for scale and capability, yet the customer mix remains the unresolved issue.
Recent Events
The March 19, 2026 credit amendment raised the secured revolving facility to as much as 50M and pushed maturity to April 4, 2029, which gives management more liquidity if working capital needs rise. I read that as a practical support for the moat rather than a strategic shift, because it helps the company fund larger AI programs without stressing the balance sheet. The March 9, 2026 compensation package for President and Chief Revenue Officer Rahul Singhal, effective January 1, 2026, also reinforces execution focus by tying pay to revenue delivery. The June 4, 2026 annual meeting was constructive as well: stockholders elected all five director nominees, approved BDO India Services Private Limited as auditor for FY2026, and authorized the amended equity compensation plan.
Financial Analysis
Growth
INOD — Financial Growth (Quarterly, USD Mil)
| Metric | 2025-06-30 | 2025-09-30 | 2025-12-31 | 2026-03-31 | 2026-06-30 |
|---|---|---|---|---|---|
| REVENUE (USD Mil) | 58.4 | 62.5 | 72.4 | 90.1 | 92.1 |
| EBIT (USD Mil) | 8.9 | 11.8 | 10.9 | 16.9 | 15.9 |
| EBITDA (USD Mil) | 10.5 | 13.5 | 12.9 | 19.1 | 18.2 |
| NET INCOME (USD Mil) | 7.2 | 8.3 | 8.8 | 14.9 | 14.4 |
| DILUTED EPS | 0.2 | 0.2 | 0.2 | 0.4 | 0.4 |
Source: Yahoo Finance — Quarterly Financial Statements
Revenue rose from $58.4M in Q2 2025 to $92.1M in Q2 2026, and that step-up is what makes the equity interesting. The pace accelerated sharply in Q1 2026 and stayed elevated in Q2 2026, which tells me the business is still compounding rather than merely lapping an easy comparison. EBITDA also expanded to $18.2M in Q2 2026 from $10.5M a year earlier, so the growth is still converting into profit, not just top-line scale. That combination supports the moat thesis above, but it also explains why the market is willing to pay a premium multiple.
Profitability
INOD — Profitability (TTM)
| Metric | TTM |
|---|---|
| Operating Margin (TTM) | 17.2% |
| Net Margin (TTM) | 14.7% |
| Return on Assets (TTM) | 14.2% |
| Return on Equity (TTM) | 37.8% |
| Gross Margin (TTM) | 43.2% |
| EBITDA Margin (TTM) | 18.7% |
Source: Yahoo Finance — Trailing Twelve Months (TTM)
TTM gross margin was 43.2%, operating margin was 17.2%, EBITDA margin was 18.7%, and net margin was 14.7%. The spread between gross margin and operating margin shows that the company still carries a meaningful overhead load, but it is already converting a healthy share of revenue into profit. Return on assets was 14.2% TTM and return on equity was 37.8% TTM, which tells me the business is producing strong returns on a relatively small equity base. I would watch ROA more closely than ROE, because the latter is amplified by the balance-sheet structure.
Valuation
INOD — Valuation Multiples
| Metric | Value |
|---|---|
| Current Share Price (USD) | 62 |
| Market Cap (USD Mil) | 2,133 |
| Enterprise Value (USD Mil) | 1,858 |
| Trailing P/E | 48.1 |
| Forward P/E | 29.7 |
| Price/Sales (TTM) | 6.7 |
| Price/Book (mrq) | 13.4 |
| EV/Revenue | 5.9 |
| EV/EBITDA | 31.4 |
| Beta (5Y Monthly) | 2.98 |
| FCF Yield % (TTM) | 8.0% |
| Forward EPS (USD) | 2.1 |
| Analyst Target Price – Low (USD) | 111 |
| Analyst Target Price – Mean (USD) | 122.8 |
| Analyst Target Price – High (USD) | 140 |
| # Analyst Opinions | 4 |
Source: Yahoo Finance
INOD trades at 5.9x EV/Revenue, 31.4x EV/EBITDA, 48.1x trailing P/E, and 29.7x forward P/E, so the market is clearly paying for sustained growth and margin durability. On the analysis here, I would put fair value in a range of roughly $45-$70 per share, which is below the $111-$140 analyst target range and below the $122.8 consensus mean; with four analyst opinions, that is a real consensus, and my range sits under it because I weight customer concentration and execution risk more heavily than the consensus appears to. Forward EPS is 2.09, and that is the right lens for the stock because the valuation is really about how much of that earnings power can compound rather than whether the current year looks strong. Relative to peers, the implied earnings path is richer than EXLS, ICFI, TASK, and EPAM on a forward basis, but the stock also carries a much higher multiple, so the premium only works if growth stays unusually strong. The 8.0% FCF yield is the main support under the valuation, but it does not fully offset the rich revenue multiple.
Leverage
INOD — Leverage & Coverage (Quarterly)
| Metric | Value |
|---|---|
| Total Debt/Equity % (mrq) | 2.4 |
| Current Ratio (mrq) | 1.7 |
| Total Debt (mrq, USD Mil) | 3.8 |
| Operating Cash Flow (TTM, USD Mil) | 196.2 |
| Levered Free Cash Flow (TTM, USD Mil) | 169.8 |
| Net Debt/EBITDA (TTM) | -4.2 |
| FCF Margin % (TTM) | 53.5% |
Source: Yahoo Finance — Quarterly Financial Statements
The balance sheet is a clear strength: total debt was $3.8M, total cash was $250.4M, and net debt/EBITDA was -4.2x TTM. Current ratio was 1.7x, so the company has enough liquidity to fund working capital without leaning on external capital. Operating cash flow was $196.2M TTM and levered free cash flow was $169.8M TTM, which means earnings are turning into cash efficiently. That cash profile matters because it gives management room to keep investing in the AI delivery platform while still protecting the downside.
Insider Activity
The insider transaction record is one-sided selling: 69 open-market sales, $147.3M total, and no open-market purchases in the 2025-02-26 to 2026-06-04 window. The pattern is broad rather than isolated, with the CEO and EVP and COO both active, which points to weak insider alignment at the margin. I do not read that as a thesis-breaker, but it is a bear signal because there is no offsetting open-market buying to balance it.
Comparable Analysis
LF0 has published standalone analyses of these peers: EPAM Systems (EPAM) (rated Hold).
Growth
| Company | Revenue TTM (USD Mil) | Revenue Growth YoY % | EBITDA TTM (USD Mil) | Diluted EPS TTM |
|---|---|---|---|---|
| INOD | 317.2 | 57.8% | 59.2 | 1.3 |
| EXLS | 2,237.3 | 15.6% | 379.1 | 1.6 |
| ICFI | 1,821.1 | -0.3% | 197.1 | 4.8 |
| CNDT | 2,939 | -11.9% | 76 | -1.2 |
| TASK | 1,226.8 | 5.0% | 215.1 | 1.2 |
| EPAM | 5,616.8 | 4.5% | 753.4 | 7.4 |
Source: Yahoo Finance
INOD’s revenue TTM was 317.2M, up 57.8% year over year, versus 15.6% for EXLS, 5.0% for TASK, 4.5% for EPAM, -0.3% for ICFI, and -11.9% for CNDT. That is the clearest reason the stock trades at a premium: the market is paying for a much faster top-line inflection than any named peer. On a like-for-like basis, INOD’s growth is also translating into a larger earnings base than the smaller peers, which is why the multiple can look high without being irrational.
Valuation
| Company | Current Share Price (USD) | Trailing P/E | Forward P/E | EV/Revenue | EV/EBITDA | Price/Sales (TTM) | Price/Book (mrq) | Market Cap (USD Mil) | Enterprise Value (USD Mil) | Beta (5Y Monthly) | FCF Yield % (TTM) | Forward EPS | Analyst Target Price – Low | Analyst Target Price – Mean | Analyst Target Price – High | # Analyst Opinions |
|---|---|---|---|---|---|---|---|---|---|---|---|---|---|---|---|---|
| INOD | 62 | 48.1 | 29.7 | 5.9 | 31.4 | 6.7 | 13.4 | 2,133 | 1,858 | 2.98 | 8.0% | 2.1 | 111 | 122.8 | 140 | 4 |
| EXLS | 36.8 | 23.3 | 14.2 | 2.6 | 15.3 | 2.5 | 6.4 | 5,621 | 5,796 | 0.84 | 4.7% | 2.6 | 39 | 44.6 | 48 | 8 |
| ICFI | 87.6 | 18.1 | 11.4 | 1.2 | 10.7 | 0.9 | 1.5 | 1,570 | 2,117 | 0.53 | 5.3% | 7.7 | 80 | 107.2 | 124 | 4 |
| CNDT | 1.6 | — | 160 | 0.3 | 13.3 | 0.1 | 0.5 | 249 | 1,009 | 1.46 | 38.6% | 0 | 5 | 5 | 5 | 2 |
| TASK | 8.1 | 6.9 | 5.5 | 0.9 | 5.1 | 0.6 | 2.7 | 746 | 1,100 | 2.01 | 13.4% | 1.5 | 7 | 8.5 | 12 | 6 |
| EPAM | 113.2 | 15.4 | 8.1 | 0.9 | 7 | 1 | 1.7 | 5,842 | 5,237 | 1.39 | 11.1% | 14.1 | 94 | 122.8 | 200 | 17 |
Source: Yahoo Finance
INOD trades at 5.9x EV/Revenue, 31.4x EV/EBITDA, 48.1x trailing P/E, and 29.7x forward P/E, versus EXLS at 2.6x, 15.3x, 23.3x, and 14.2x; ICFI at 1.2x, 10.7x, 18.1x, and 11.4x; TASK at 0.9x, 5.1x, 6.9x, and 5.5x; and EPAM at 0.9x, 7.0x, 15.4x, and 8.1x. The stock has also lagged over the past year: a $1 investment would be worth $0.7 in INOD, versus $0.9 in ICFI, $0.9 in TASK, $0.8 in EXLS, and $0.8 in EPAM. I think the market is paying for growth, but the valuation premium is much larger than the peer growth gap, so the setup is more demanding than the headline revenue trend alone suggests.
Profitability
| Company | Operating Margin (TTM) | Net Margin (TTM) | Return on Assets (TTM) | Return on Equity (TTM) | Gross Margin (TTM) | EBITDA Margin (TTM) |
|---|---|---|---|---|---|---|
| INOD | 17.2% | 14.7% | 14.2% | 37.8% | 43.2% | 18.7% |
| EXLS | 14.6% | 11.2% | 12.0% | 25.9% | 38.5% | 17.0% |
| ICFI | 8.4% | 4.9% | 4.2% | 8.6% | 37.2% | 10.8% |
| CNDT | -4.0% | -7.8% | -1.2% | -20.5% | 18.6% | 2.6% |
| TASK | 11.6% | 8.8% | 9.4% | 25.4% | 38.3% | 17.5% |
| EPAM | 10.9% | 7.2% | 8.5% | 11.2% | 29.4% | 13.4% |
Source: Yahoo Finance
INOD’s gross margin of 43.2%, operating margin of 17.2%, EBITDA margin of 18.7%, and net margin of 14.7% all exceed EXLS at 38.5%, 14.6%, 17.0%, and 11.2%; ICFI at 37.2%, 8.4%, 10.8%, and 4.9%; TASK at 38.3%, 11.6%, 17.5%, and 8.8%; and EPAM at 29.4%, 10.9%, 13.4%, and 7.2%. Return on assets was 14.2% and return on equity was 37.8%, both above the peer set, which tells me the company is not just growing faster but also converting that growth into better returns. The margin gap versus peers is most visible below gross profit, so the operating model is still the key driver of the premium.
Leverage
| Company | Total Debt/Equity % (mrq) | Current Ratio (mrq) | Total Debt (mrq, USD Mil) | Operating Cash Flow TTM (USD Mil) | Free Cash Flow TTM (USD Mil) | Net Debt/EBITDA (TTM) | FCF Margin % (TTM) |
|---|---|---|---|---|---|---|---|
| INOD | 2.4 | 1.7 | 3.8 | 196.2 | 169.8 | -4.2 | 53.5% |
| EXLS | 56.6 | 1.2 | 490.2 | 327.7 | 262.3 | 0.5 | 11.7% |
| ICFI | 53.8 | 1.4 | 564.8 | 219.5 | 82.7 | 2.8 | 4.5% |
| CNDT | 127.4 | 1.6 | 851 | -1 | 96 | 8.2 | 3.3% |
| TASK | 182.2 | 2.9 | 546.4 | 173.3 | 99.7 | 1.7 | 8.1% |
| EPAM | 4.3 | 2.8 | 152.2 | 538.8 | 650.2 | -0.8 | 11.6% |
Source: Yahoo Finance
INOD’s total debt/equity was 2.402%, current ratio was 1.7x, total debt was $3.8M, operating cash flow was $196.2M, free cash flow was $169.8M, net debt/EBITDA was -4.2x, and FCF margin was 53.5%. That is far cleaner than EXLS at 56.6% debt/equity and 0.5x net debt/EBITDA, ICFI at 53.8% and 2.8x, TASK at 182.2% and 1.7x, and EPAM at 4.3% and -0.8x. The leverage gap helps explain why INOD can sustain a richer multiple than some peers, but the valuation still depends on growth staying strong enough to justify it.
Conclusion
I would put my rating as a Hold because the core tension is now clear: Innodata has the growth, cash generation, and balance-sheet flexibility to keep compounding, but the stock already discounts a lot of that strength and the customer base is still too concentrated for me to underwrite a cleaner Buy. The latest numbers do not show the concentration risk breaking the thesis yet, because revenue is still above 90M a quarter and EBITDA remains in the high-teens millions, but the business is still leaning heavily on one DDS account. That is why I am not more aggressive on the upside.
I would raise my rating more towards a Buy if quarterly revenue stays above 90M for another two quarters and EBITDA holds near the current 18M–19M run rate, because that would show the Q1 2026 and Q2 2026 scale is repeatable rather than a short-lived spike. I would also want to see DDS concentration fall below 50% of revenue, meaning no single customer dominates the segment the way one account does today. If that happens, the current 31.4x EV/EBITDA would look easier to defend because the earnings base would be broader and less fragile.
I would move from Hold to Sell if quarterly revenue falls back below 70M, because that would tell me the concentration risk is no longer just a disclosure item. A drop from roughly 92M to below 70M would remove more than 20M of quarterly revenue, and with an 18.7% EBITDA margin that would imply roughly 4M of lost quarterly EBITDA before any second-order pricing pressure. In my view, that would be the clearest sign that the premium multiple is no longer supported by the operating trend.
Weighing both sides, I think the bull case is more likely to show up first because the company has already delivered two quarters above 90M of revenue and still carries net cash. Even so, I would not pay up for the stock until I see another quarter or two that proves the customer mix is broadening rather than just scaling around one account.
What to Watch Next
- Quarterly revenue above 90M — would support a move toward Buy.
- EBITDA holding near 18M–19M — would confirm the current scale is repeatable.
- DDS concentration below 50% of revenue — would reduce single-customer risk.
- Quarterly revenue below 70M — would argue for a Sell.
- Net cash remaining positive — would keep balance-sheet risk low.
What’s your take? I rated Innodata (INOD) STRONG SELL above — but the goal here is to get this right, not just to publish an opinion. What would you add to this analysis, or which risk or catalyst do you think I’m under- or over-weighting? Tell me in the comments.
Sources
- SEC 10-K Annual Report — filed 2026-02-26
- SEC 8-K Filing (2026-06-08)
- SEC 8-K Filing (2026-05-07)
- SEC 8-K Filing (2026-03-24)
- SEC 8-K Filing (2026-03-10)
- SEC 8-K Filing (2026-02-26)
- SEC Form 4 Insider Transaction (2026-06-08)
- SEC Form 4 Insider Transaction (2026-06-08)
- SEC Form 4 Insider Transaction (2026-06-08)
- SEC 10-K Annual Report — FY2026
- SEC 10-K Annual Report — FY2025
- SEC 10-K Annual Report — FY2024
- SEC 10-K Annual Report — FY2023
- SEC 10-K Annual Report — FY2022
Data sourced from Yahoo Finance and SEC EDGAR. Not investment advice.
Leave a Comment