
| Company | Oct 25 | Nov 25 | Dec 25 | Jan 26 | Feb 26 | Mar 26 | Apr 26 | May 26 | Jun 26 | Jul 26 | Aug 26 | Sep 26 | 12-Mo |
|---|---|---|---|---|---|---|---|---|---|---|---|---|---|
| NVTS | +86% | -35% | -18% | +20% | +5% | -3% | +88% | +61% | -33% | -39% | +7% | +0% | +61% |
| ON | +2% | +0% | +8% | +11% | +11% | -7% | +63% | +20% | -22% | -14% | -9% | +4% | +56% |
| STM | -13% | -6% | +13% | +8% | +21% | +3% | +60% | +26% | +8% | -30% | -4% | +7% | +91% |
| NXPI | -8% | -7% | +12% | +4% | +0% | -13% | +49% | +9% | -12% | -18% | -2% | +6% | +6% |
| MTSI | +19% | +18% | -2% | +28% | +13% | -10% | +27% | +29% | +4% | -34% | +5% | +8% | +129% |
| DIOD | +0% | -13% | +7% | +20% | +15% | +0% | +57% | -2% | +4% | -25% | +10% | +7% | +82% |
Source: Yahoo Finance monthly adjusted close.
Quick Thesis
- Rated sell because the stock prices in a turnaround that the numbers do not yet show.
- Strongest support is $557.4M of cash at mrq, which buys time.
- Biggest risk is -$66.5M of operating cash flow TTM, so cash is being consumed.
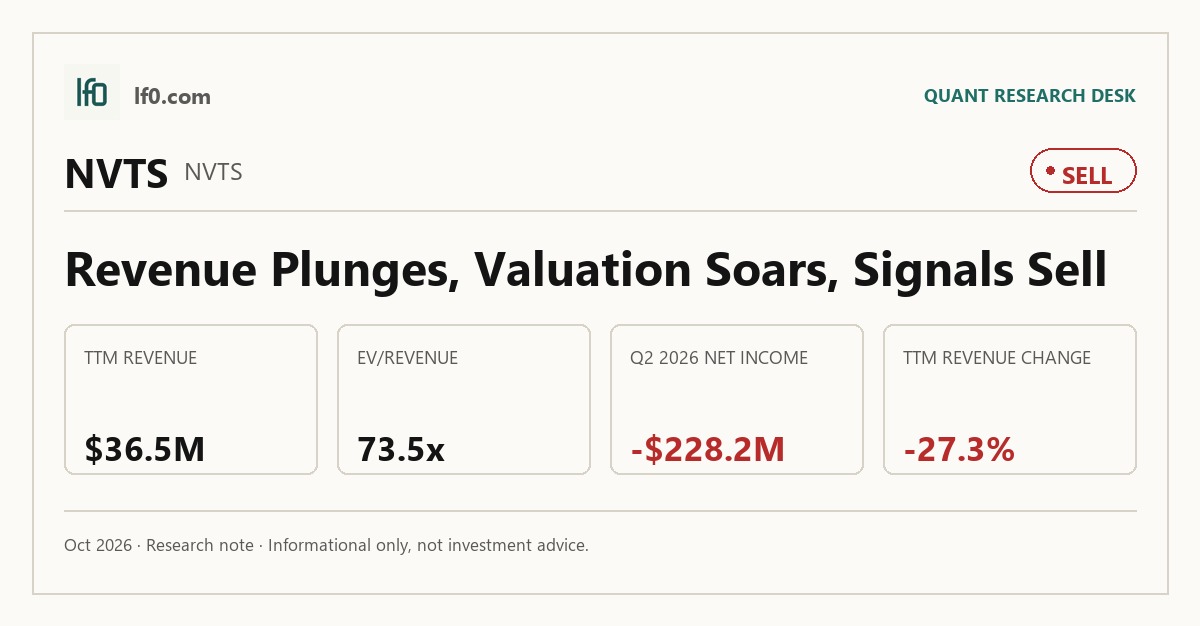
- Valuation is rich at 73.5x EV/revenue and 89.1x price/sales TTM.
- I would turn more constructive only if quarterly revenue stays above $10.5M and margins improve.
Executive Summary
Rating: SELL | NVTS
We’ll begin tracking this call’s performance since publication once sufficient adjusted-close data is available.
I would put my rating as a Sell because Navitas is still priced for a profitability inflection that is not visible in the latest numbers. Revenue was $10.5M in Q2 2026, while net income was -$228.2M in the same quarter, so the issue is not liquidity but the lack of operating leverage. The balance sheet gives management time to execute Navitas 2.0, but the market is already paying 73.5x EV/revenue and 89.1x price/sales TTM for a business that is still burning cash. I would raise my rating more towards a Hold if quarterly revenue can stay above $10.5M for several quarters and EBITDA losses narrow enough to show the pivot is scaling.
Company Profile
Navitas Semiconductor designs and markets wide bandgap power semiconductors, including gallium nitride (GaN) power integrated circuits, silicon carbide (SiC) devices, silicon controllers, and digital isolators for power conversion and charging. It operates a fabless model, outsourcing wafer fabrication, assembly, and test to third-party partners, which keeps capital intensity lower than an integrated device manufacturer. The company was founded in 2014, went public in 2021 through a business combination with Live Oak Acquisition Corp. II, and added SiC products through the GeneSiC Semiconductor acquisition in 2022. Navitas 2.0 is a strategic pivot toward AI data centers, grid infrastructure, performance computing, and industrial electrification, so the company is trying to move from a consumer-led mix toward higher-power end markets.
Economic Moat
Business Model
The most defensible part of Navitas’s model is its full-stack wide bandgap offering, because it combines GaN power integrated circuits and high-voltage SiC devices in one portfolio. I feel that breadth is hard to replicate quickly, especially once a supplier has shipped at scale and built field reliability. Navitas says it has shipped over 300 million GaN devices and nearly 30 million SiC devices as of December 31, 2025, and that shipping history matters more to customers than a lab prototype. The company also has over 300 patents issued or pending worldwide, and its October 2024 patent cross-license with Infineon suggests the intellectual property base has commercial value. The fabless model adds flexibility because Navitas can scale without owning fabs, and that structure fits the AI data center and grid markets it is now targeting.
Business & Operating Risks
The biggest disclosed risk is execution of the Navitas 2.0 pivot, because the company is now relying on larger die sizes, advanced process nodes, and longer qualification cycles. That is a real moat test: if the new markets ramp slowly, the product breadth described above does not translate into revenue fast enough to protect the business model. Navitas also depends on design wins that may not convert into revenue for a year or more, if ever, and it relies on a few key distributors, so a missed program can hit more than one channel at once. Supply chain is another pressure point because the company has historically relied on TSMC as its sole supplier of GaN wafers, and TSMC plans to cease GaN production in July 2027. In my view, these risks do not break the moat today, but they do threaten the speed at which the moat can turn into earnings.
Management Discussion & Analysis
Management is responding to those risks, but mostly through restructuring and financing rather than through visible operating momentum. The company raised about $100M in a November 2025 PIPE and another $122M of net proceeds through an at-the-market offering in May 2026, which strengthens liquidity but also confirms that the pivot is still being funded by dilution. It also recorded $16.6M of restructuring and impairment charges in Q4 2025, alongside distributor rationalization and resource realignment, which tells me management is shrinking the legacy mix to focus on higher-power markets. That is the right strategic response, but the latest revenue trend shows the transition has not yet produced durable top-line traction. The key point is that management is addressing the execution risk, yet the market still has to see that the new mix can scale before the moat thesis becomes a financial thesis.
Recent Events
The most important recent event was the May 11, 2026 at-the-market offering, which authorized up to $125M of Class A stock and was fully sold by May 12, 2026 with $122M of net proceeds. That improves near-term liquidity, but it also reinforces that the company is still leaning on equity markets rather than operating cash flow. A second event was the May 18, 2026 settlement with Live Oak Sponsor, followed by share issuances tied to Triggering Event I and Triggering Event II, which reduced one source of legal uncertainty but also confirmed that dilution from the merger structure is still flowing through the cap table. I do not see these events as moat-destroying; I see them as evidence that the company has time to execute, but not yet the earnings power to fund the pivot on its own.
Financial Analysis
Growth
NVTS — Financial Growth (Quarterly, USD Mil)
| Metric | 2025-06-30 | 2025-09-30 | 2025-12-31 | 2026-03-31 | 2026-06-30 |
|---|---|---|---|---|---|
| REVENUE (USD Mil) | 14.5 | 10.1 | 7.3 | 8.6 | 10.5 |
| EBIT (USD Mil) | -21.7 | -19.4 | -24.8 | -27.3 | -26.8 |
| EBITDA (USD Mil) | -16 | -13.8 | -19.2 | -21.6 | -21.2 |
| NET INCOME (USD Mil) | -49.1 | -19.2 | -31.8 | -33.8 | -228.2 |
| DILUTED EPS | -0.2 | -0.1 | -0.1 | -0.1 | -0.9 |
Source: Yahoo Finance — Quarterly Financial Statements
Revenue has been choppy, but the latest quarter does show a sequential rebound: $7.3M in Q4 2025, $8.6M in Q1 2026, and $10.5M in Q2 2026. That matters because it suggests the business is not in a straight-line decline, even though the TTM revenue base is still only $36.5M and down 27.3% year over year. EBITDA stayed negative at -$21.2M in Q2 2026, so the top-line recovery has not yet translated into operating scale. I view the latest quarter as an early sign that the pivot may be stabilizing, but not yet as proof of durable demand.
Profitability
NVTS — Profitability (TTM)
| Metric | TTM |
|---|---|
| Operating Margin (TTM) | -255.0% |
| Net Margin (TTM) | 0.0% |
| Return on Assets (TTM) | -9.0% |
| Return on Equity (TTM) | -52.6% |
| Gross Margin (TTM) | 38.1% |
| EBITDA Margin (TTM) | -190.5% |
Source: Yahoo Finance — Trailing Twelve Months (TTM)
TTM gross margin of 38.1% shows Navitas still captures healthy value at the product level, but the rest of the margin stack is weak: operating margin was -255% and EBITDA margin was -191%. That gap tells me the problem is scale and overhead absorption, not product economics alone. The TTM net margin is listed at 0%, but the quarterly income statement shows repeated net losses, including -$228M in Q2 2026, so I would not read that as breakeven profitability. Return on assets was -8.99% TTM and return on equity was -52.6% TTM, which confirms that capital is not yet earning a return. For me, the key cross-check is that the gross margin base is respectable, but the moat still has to prove it can support positive operating margin.
Valuation
NVTS — Valuation Multiples
| Metric | Value |
|---|---|
| Current Share Price (USD) | 12.4 |
| Market Cap (USD Mil) | 3,256 |
| Enterprise Value (USD Mil) | 2,685 |
| Trailing P/E | — |
| Forward P/E | -98.4 |
| Price/Sales (TTM) | 89.1 |
| Price/Book (mrq) | 4 |
| EV/Revenue | 73.5 |
| EV/EBITDA | -38.6 |
| Beta (5Y Monthly) | 3.88 |
| FCF Yield % (TTM) | -0.1% |
| Forward EPS (USD) | -0.1 |
| Analyst Target Price – Low (USD) | 8 |
| Analyst Target Price – Mean (USD) | 14.1 |
| Analyst Target Price – High (USD) | 21 |
| # Analyst Opinions | 8 |
Source: Yahoo Finance
Navitas is priced on revenue, not earnings. The stock trades at 73.5x EV/revenue, 89.1x price/sales TTM, and -98.4x forward P/E, with a current share price of $12.4 and a market cap of $3.26e+03. That is a demanding setup for a company with -0.12 FCF yield TTM and forward EPS of -$0.126. The analyst target range of $8 to $21 across 8 opinions gives a real consensus to compare against, and my view sits inside that band but below the $14.1 mean because I weight the cash burn and negative operating leverage more heavily than the market appears to. On the analysis here, I would put fair value in a range of roughly $8 to $14, with the upper end only justified if the revenue rebound turns into sustained margin repair. That range is still rich relative to peers on a growth-adjusted basis because the company’s revenue base is small, its leverage is not the issue, and the market is paying for earnings that have not arrived yet.
Leverage
NVTS — Leverage & Coverage (Quarterly)
| Metric | Value |
|---|---|
| Total Debt/Equity % (mrq) | 0.6 |
| Current Ratio (mrq) | 21.8 |
| Total Debt (mrq, USD Mil) | 5.1 |
| Operating Cash Flow (TTM, USD Mil) | -66.5 |
| Levered Free Cash Flow (TTM, USD Mil) | -3.8 |
| Net Debt/EBITDA (TTM) | 7.9 |
| FCF Margin % (TTM) | -10.4% |
Source: Yahoo Finance — Quarterly Financial Statements
Total debt was $5.136M at mrq, so the balance sheet is lightly levered in absolute terms. The current ratio was 21.79 and cash was $557.4M, which gives Navitas a large liquidity cushion. The problem is cash generation: operating cash flow was -$66.47M TTM, levered free cash flow was -$3.815M TTM, and FCF margin was -10.44% TTM. Net debt/EBITDA was 7.934x because EBITDA is still negative, so the leverage ratio is more a sign of weak earnings than of true debt stress. In my view, this is a cash-rich but still cash-burning balance sheet, and that distinction matters because the company can fund the pivot, but it cannot yet fund itself.
Insider Activity
The insider record is overwhelmingly net selling, with 43 open-market sales and 0 open-market purchases in the 2025-02-26 to 2026-06-02 window. The activity is concentrated, led by Ranbir Singh, but it is also broad because multiple directors and the CEO sold shares in the same period. I read that as a negative signal for alignment, especially when the stock is still asking investors to underwrite a multi-quarter execution story.
Comparable Analysis
Growth
| Company | Revenue TTM (USD Mil) | Revenue Growth YoY % | EBITDA TTM (USD Mil) | Diluted EPS TTM |
|---|---|---|---|---|
| NVTS | 36.5 | -27.3% | -69.6 | -1.3 |
| ON | 6,197.8 | 9.2% | 2,089.9 | 1.5 |
| STM | 13,099 | 26.1% | 2,786 | -0.1 |
| NXPI | 13,185 | 19.5% | 5,068 | 11.9 |
| MTSI | 1,164 | 35.8% | 276.1 | 3.3 |
| DIOD | 1,634.7 | 21.7% | 221.3 | 1.9 |
Source: Yahoo Finance
NVTS’s revenue TTM was $36.5M and revenue growth was -27.3%, while ON grew 9.2%, STM 26.1%, NXPI 19.5%, MTSI 35.8%, and DIOD 21.7%. That gap is stark: NVTS is not being valued like a growth leader, yet the current multiple still assumes a meaningful recovery. I also note that MTSI’s 35.8% growth and NXPI’s 19.5% growth come with far larger revenue bases, which makes NVTS’s small and shrinking base look more fragile than the headline growth numbers at peers.
Valuation
| Company | Current Share Price (USD) | Trailing P/E | Forward P/E | EV/Revenue | EV/EBITDA | Price/Sales (TTM) | Price/Book (mrq) | Market Cap (USD Mil) | Enterprise Value (USD Mil) | Beta (5Y Monthly) | FCF Yield % (TTM) | Forward EPS | Analyst Target Price – Low | Analyst Target Price – Mean | Analyst Target Price – High | # Analyst Opinions |
|---|---|---|---|---|---|---|---|---|---|---|---|---|---|---|---|---|
| NVTS | 12.4 | — | -98.4 | 73.5 | -38.6 | 89.1 | 4 | 3,256 | 2,685 | 3.88 | -0.1% | -0.1 | 8 | 14.1 | 21 | 8 |
| ON | 84.9 | 55.5 | 18.7 | 5.5 | 16.2 | 5.3 | 4.6 | 33,049 | 33,913 | 2 | 5.0% | 4.5 | 75 | 104.3 | 150 | 26 |
| STM | 57.3 | — | 22.5 | 3.8 | 17.8 | 3.9 | 2.9 | 51,079 | 49,713 | 1.51 | 0.2% | 2.5 | 52 | 75 | 98 | 12 |
| NXPI | 243.7 | 20.4 | 13.4 | 5.3 | 13.7 | 4.7 | 5.4 | 61,442 | 69,558 | 1.82 | 5.8% | 18.1 | 190 | 311.1 | 400 | 29 |
| MTSI | 321.6 | 96.3 | 37.9 | 20.9 | 88.1 | 21.1 | 15.9 | 24,561 | 24,312 | 1.71 | 0.4% | 8.5 | 300 | 395.3 | 475 | 15 |
| DIOD | 103.8 | 55.8 | 17.8 | 2.8 | 20.3 | 2.9 | 2.4 | 4,782 | 4,501 | 1.90 | 3.7% | 5.8 | 133 | 162.5 | 192 | 2 |
Source: Yahoo Finance
NVTS trades at 73.5x EV/revenue and 89.1x price/sales, versus ON at 5.5x and 5.3x, STM at 3.8x and 3.9x, NXPI at 5.3x and 4.7x, MTSI at 20.9x and 21.1x, and DIOD at 2.8x and 2.9x. On a peer EV/revenue frame, NVTS’s $36.5M revenue base implies an enterprise value range of about $139M to $764M, or roughly $0.5 to $2.9 per share after netting $557.4M of cash and $5.136M of debt and dividing by 262.6M shares. That is far below the current $12.4 share price, so the market is paying for a much cleaner earnings conversion than the peer set is currently giving it. The $1 invested comparison also argues against the stock’s premium: NVTS would have turned $1 into $1.51 over the past year, while ON, STM, MTSI, and DIOD all did better. In my view, the valuation premium is not supported by the peer tape.
Profitability
| Company | Operating Margin (TTM) | Net Margin (TTM) | Return on Assets (TTM) | Return on Equity (TTM) | Gross Margin (TTM) | EBITDA Margin (TTM) |
|---|---|---|---|---|---|---|
| NVTS | -255.0% | 0.0% | -9.0% | -52.6% | 38.1% | -190.5% |
| ON | 19.5% | 10.2% | 6.8% | 8.3% | 42.8% | 33.7% |
| STM | 6.9% | 3.6% | 2.1% | 2.7% | 34.5% | 21.3% |
| NXPI | 30.4% | 22.6% | 10.5% | 27.9% | 56.1% | 38.4% |
| MTSI | 23.3% | 20.7% | 6.4% | 17.2% | 56.5% | 23.7% |
| DIOD | 7.5% | 5.3% | 2.0% | 4.7% | 31.7% | 13.5% |
Source: Yahoo Finance
NVTS’s gross margin was 38.1%, which is not far from ON’s 42.8% and STM’s 34.5%, but its operating margin of -255% and EBITDA margin of -191% are far weaker than any scaled peer. NXPI posted a 30.4% operating margin and 38.4% EBITDA margin, while MTSI posted 23.3% and 23.7%, so the gap is not about the industry being unprofitable. The issue is that NVTS has not yet converted gross profit into operating profit, which tells me the business still lacks the scale discipline that peers already have.
Leverage
| Company | Total Debt/Equity % (mrq) | Current Ratio (mrq) | Total Debt (mrq, USD Mil) | Operating Cash Flow TTM (USD Mil) | Free Cash Flow TTM (USD Mil) | Net Debt/EBITDA (TTM) | FCF Margin % (TTM) |
|---|---|---|---|---|---|---|---|
| NVTS | 0.6 | 21.8 | 5.1 | -66.5 | -3.8 | 7.9 | -10.4% |
| ON | 65.1 | 3.5 | 4,709 | 1,672 | 1,656.7 | 0.4 | 26.7% |
| STM | 23.4 | 2.8 | 4,232 | 2,260 | 106 | -0.6 | 0.8% |
| NXPI | 93.3 | 2 | 10,976 | 3,129 | 3,555 | 1.5 | 27.0% |
| MTSI | 26.9 | 2.3 | 414.1 | 271.2 | 104.3 | -0.9 | 9.0% |
| DIOD | 4.4 | 3.2 | 89 | 250 | 176.8 | -1.6 | 10.8% |
Source: Yahoo Finance
NVTS has only $5.136M of debt and a 21.79 current ratio, so it is much less levered than ON, NXPI, or MTSI on a balance-sheet basis. That said, the company’s -10.44% FCF margin and -$66.47M of operating cash flow TTM mean the liquidity cushion is being used to absorb losses, not to compound returns. Peers such as ON and NXPI generate positive free cash flow margins of 26.7% and 27.0%, which is why their leverage looks more productive even when their debt balances are much larger. The comparison is useful because it shows that NVTS’s low debt is a strength only if the business can stop burning cash.
Conclusion
I would put my rating as a Sell because the stock is already discounting a successful pivot before the financial evidence is there. The latest quarter did improve sequentially, with revenue rising to $10.5M, but that is still not enough to offset the fact that TTM revenue is only $36.5M, operating margin is -255%, and free cash flow margin is -10.44%. The cash balance of $557.4M gives Navitas time, yet the company is still funding itself through dilution and the market is paying 73.5x EV/revenue for a business that has not proven it can convert the new AI and grid opportunity into durable earnings.
I would raise my rating more towards a Hold if quarterly revenue can stay above $10.5M for several quarters and EBITDA losses narrow enough to show the pivot is scaling, because that would tell me the new mix is becoming repeatable rather than episodic. A cleaner bull case would also require operating margin moving materially closer to zero, meaning the company is finally absorbing fixed costs instead of adding to them. If gross margin stays near 38.1% while operating expense growth slows, the model would start to look more self-funding and the equity case would improve.
The bear case is that design wins remain slow to convert, the TSMC GaN wafer transition in 2027 creates supply friction, and revenue stays trapped in the $8.6M to $10.5M quarterly range. In that scenario, the current valuation becomes harder to defend because the market would still be paying a premium multiple for a company that is not yet producing positive operating cash flow or positive EBITDA.
Weighing both sides, I lean to the bear case because the stock is already pricing in a cleaner execution path than the numbers justify. The cash balance buys time, but the next leg of value creation still has to come from sustained revenue and margin improvement, and I do not see enough proof yet that the pivot is moving fast enough to justify the current price.
What to Watch Next
- Quarterly revenue above $10.5M — would support the case that the pivot is stabilizing.
- EBITDA loss narrowing materially — would show the new mix is scaling.
- Operating margin moving toward zero — would signal fixed costs are being absorbed.
- Cash burn slowing from -$66.5M TTM operating cash flow — would reduce dependence on dilution.
- Progress on the TSMC GaN wafer transition — would lower supply-chain risk ahead of 2027.
What’s your take? I rated Navitas Semiconductor (NVTS) SELL above — but the goal here is to get this right, not just to publish an opinion. What would you add to this analysis, or which risk or catalyst do you think I’m under- or over-weighting? Tell me in the comments.
Sources
- SEC 10-K Annual Report — filed 2026-02-27
- SEC 8-K Filing (2026-06-04)
- SEC 8-K Filing (2026-05-22)
- SEC 8-K Filing (2026-05-22)
- SEC 8-K Filing (2026-05-13)
- SEC 8-K Filing (2026-05-11)
- SEC 8-K Filing (2026-05-05)
- SEC Form 4 Insider Transaction (2026-06-03)
- SEC Form 4 Insider Transaction (2026-05-29)
- SEC Form 4 Insider Transaction (2026-05-29)
Data sourced from Yahoo Finance and SEC EDGAR. Not investment advice.
Leave a Comment