| Company | Aug 25 | Sep 25 | Oct 25 | Nov 25 | Dec 25 | Jan 26 | Feb 26 | Mar 26 | Apr 26 | May 26 | Jun 26 | Jul 26 | 12-Mo |
|---|---|---|---|---|---|---|---|---|---|---|---|---|---|
| VNOM | +7% | -4% | -2% | -1% | +6% | +10% | +10% | +2% | +5% | -7% | -7% | +5% | +25% |
| FANG | +1% | -4% | +0% | +7% | -1% | +9% | +6% | +14% | +4% | -6% | -8% | +15% | +40% |
| DVN | +9% | -2% | -7% | +14% | -1% | +10% | +8% | +16% | +2% | -13% | -6% | +9% | +39% |
| PR | +1% | -9% | -2% | +15% | -2% | +15% | +13% | +18% | +1% | -11% | -3% | +16% | +56% |
| BSM | -1% | +8% | +0% | +9% | -5% | +11% | +4% | +0% | -5% | -3% | +3% | +7% | +30% |
| TPL | -4% | +0% | +1% | -8% | -0% | +21% | +51% | -9% | -7% | -11% | +12% | -8% | +26% |
Source: Yahoo Finance monthly adjusted close.
Executive Summary
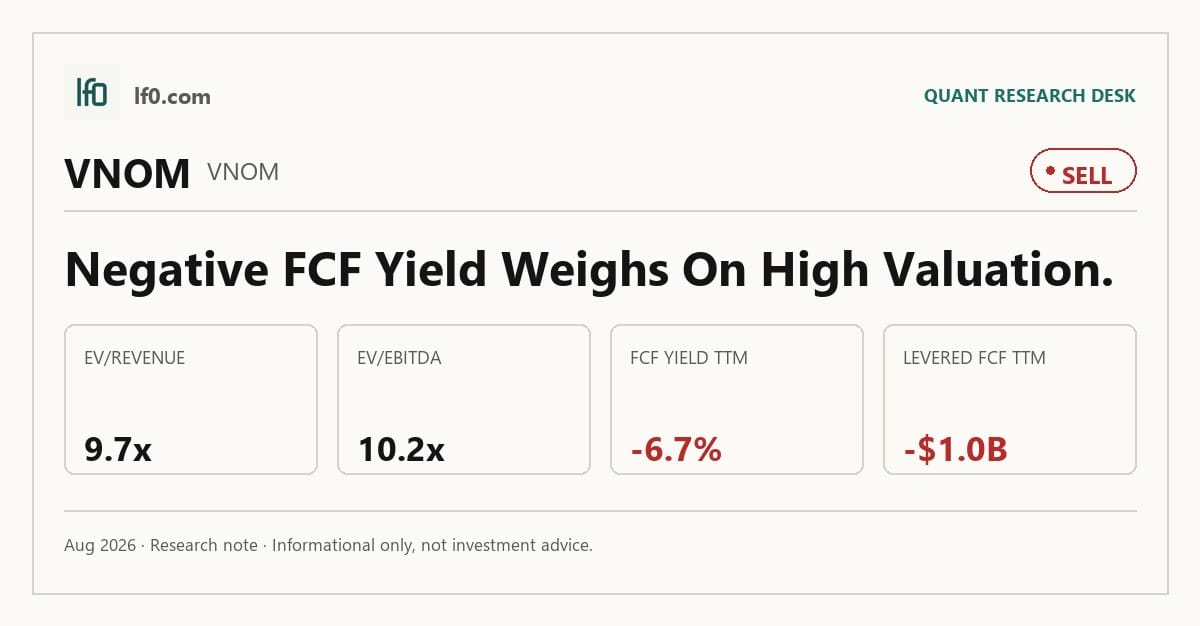
Rating: SELL | VNOM
Measured from adjusted close on 2026-08-04 to 2026-09-18. Sell ratings are correct when the stock falls; Hold is tracked as a +/-10% range. Daily-close data, not intraday. Calls are tracked for 182 days from publication, then frozen as a final record.
I would put my rating as a Sell because VNOM’s royalty asset base is strong, but the stock already prices in a lot of Permian scale while free cash flow remains deeply negative. Revenue reached $511M in Q1 2026, up 108.6% year over year, yet levered free cash flow was still $-1B TTM and FCF margin was -66.3%, so the business is growing faster than it is converting that growth into equity cash. In my view, the key question is whether the model can turn that revenue momentum into positive free cash flow before commodity prices soften. I would move from Sell to Hold only if free cash flow turns positive and stays there for two consecutive quarters, because that would show the royalty stream is finally covering the capital and financing burden.
Company Profile
Viper Energy Inc. is a mineral and royalty company that owns nonoperating interests in oil and natural gas properties, so its revenue comes from royalty income tied to production volumes and realized commodity prices rather than drilling or operating wells itself. It went public in 2014 and later converted into a holding company structure tied to Diamondback Energy through the Viper Energy Partners LP conversion. Its producing interests are concentrated in the Permian Basin of West Texas, with most proved reserves in the Wolfberry resource play in the Midland Basin. Viper Energy is listed on Nasdaq under VNOM.
Economic Moat
Business Model
The royalty stream from mineral and royalty acreage is the most defensible part of Viper Energy’s model because it depends on third-party operators drilling on acreage Viper already owns rather than on Viper funding and running the wells itself. I feel that this is hard for a well-funded competitor to replicate quickly because the company’s cash flow is tied to long-lived mineral interests in the Permian Basin, while production timing, drilling pace, and capital intensity sit with the operators, not with Viper. A base-and-variable dividend framework also fits the model, since it can return cash without forcing the company into a capital-heavy operating structure. The trade-off is concentration: the producing properties are primarily in the Permian Basin, and most proved reserves sit in the Wolfberry resource play in the Midland Basin, so the model is exposed to one basin and a small number of producing horizons.
Business & Operating Risks
The most material disclosed risk is commodity price volatility, because Viper’s royalty income is tied directly to oil, natural gas, and natural gas liquids prices and lower prices can force impairments. That risk is already visible in the numbers: 2024 royalty income rose to $853.6M from $717.1M in 2023, but lower gas pricing offset volume gains, and 2024 depletion jumped to $214.4M from $146.1M. The reserve roll-forward also showed 2024 downward revisions of 2,894 MBOE, including 6,539 MBOE tied to lower commodity prices, which tells me the price deck affects both cash flow and reserve value. The disclosed risks do threaten the moat, but they threaten the economics of the royalty stream more than the structural ownership advantage itself.
A second risk is dependence on third-party operators, especially Diamondback, because Viper does not control drilling pace, completion timing, or capital allocation on the acreage that generates its royalties. The filing says 59% of its mineral and royalty interests are operated by Diamondback after the 2025 transactions, and the 1,191 line-of-sight wells are only expected to turn to production over the next 15 to 18 months based primarily on permitting by third-party operators or Diamondback’s completion schedule. That means the production runway is only as good as operator execution, and the filing is explicit that existing permits or active development do not ensure those wells will be turned to production given commodity volatility. The current filing also gives more explicit reserve sensitivity language and a $2.2B balance of unevaluated properties, which makes the reserve-risk discussion more concrete than in prior filings.
Balance-sheet and refinancing risk is the third issue. Viper had $1.1B of long-term debt at 2024 year-end, including $430.4M of 5.375% senior notes due 2027 and $400M of 7.375% senior notes due 2031, plus $261M drawn on the revolving credit facility. The credit facility matures on September 22, 2028 and carries a total net debt to EBITDAX covenant of not greater than 4.0x, so a commodity downturn could tighten borrowing capacity quickly. Net interest expense rose to $73.8M in 2024 from $47.4M in 2023, which shows leverage is already a drag on earnings rather than a distant risk.
Management Discussion & Analysis
Management is signaling a capital-light, risk-managed posture rather than an aggressive growth push. According to management’s discussion in the 10-K, the company is still using fixed price swaps, fixed price basis swaps, and costless collars to reduce royalty income volatility, and it ended December 31, 2024 with a $15.3M net asset derivative position. That tells me the priority is cash flow smoothing, not balance-sheet expansion, which fits a royalty business exposed to commodity swings. The $261M of outstanding borrowings on the revolving credit facility, carried at a 7.34% weighted average interest rate in 2024, shows management is willing to use leverage, but the floating-rate structure means higher rates still flow through to earnings.
The purchaser concentration data also matters: no purchaser exceeded 10% of income in 2024, after two purchasers were above that threshold in 2023 and 2022, which reduces near-term counterparty risk and supports a steadier royalty stream. At the same time, management’s hedging discipline does not change the underlying earnings sensitivity, because derivative gains can be offset by lower realized sales values. In other words, the hedge book softens volatility, but it does not remove the commodity link that drives the model.
Management credibility looks solid but not flawless. In 2024, the GRP Acquisition was presented as a major expansion step, funded with 9.02 million common units, $759.6M in cash, the 2031 Notes, and $200M from Diamondback, and the subsequent 2025 filing did not contradict that capital allocation choice. Prior filings also showed a consistent message that commodity prices are volatile and difficult to predict, and the current filing keeps that framing intact instead of pretending the cycle is controllable. I would call that a measured record rather than a perfect one.
Recent Events
The most significant development I see is the June 2, 2025 merger agreement with Sitio Royalties, disclosed on June 3 and June 4, 2025. Viper is moving to combine Sitio into a new parent in an all-equity transaction, with Viper holders expected to own about 80% and Sitio holders about 20% of the combined company. In my view, that strengthens the scale and asset concentration thesis because it adds more Permian royalty acreage under one roof, but it also introduces integration and approval risk before any synergies are realized.
The other material event is the May 1, 2025 completion of the Endeavor drop down, disclosed on May 5, 2025. Viper paid $1B in cash and issued 69.6M OpCo units and matching Class B shares for about 22,847 net royalty acres, roughly 69% of which are operated by Diamondback. I read that as a clear reinforcement of Viper’s core advantage, since it deepens exposure to operated Permian acreage and keeps the asset base tied to a high-quality sponsor relationship.
On May 20, 2025, stockholders re-elected the full board, approved named executive compensation on an advisory basis, and ratified Grant Thornton LLP as auditor. That is mostly governance housekeeping, but it also signals continuity around the same capital-allocation team that is now executing the Sitio combination and the Endeavor integration. Overall, recent 8-Ks strengthen the scale thesis, while the Sitio deal adds execution risk that investors will need to watch closely.
Financial Analysis
Growth
VNOM — Financial Growth (Quarterly, USD Mil)
| Metric | 2025-03-31 | 2025-06-30 | 2025-09-30 | 2025-12-31 | 2026-03-31 |
|---|---|---|---|---|---|
| REVENUE (USD Mil) | 245 | 297 | 418 | 434 | 511 |
| EBIT (USD Mil) | 187 | 106 | -191 | -224 | 270 |
| EBITDA (USD Mil) | 254 | 230 | -9 | 10 | 476 |
| NET INCOME (USD Mil) | 75 | 37 | -77 | -103 | 97 |
| DILUTED EPS | 0.6 | 0.3 | -0.5 | -0.6 | 0.5 |
Source: Yahoo Finance — Quarterly Financial Statements
Revenue accelerated from $245M in Q1 2025 to $511M in Q1 2026, and the Q1 2026 print was up 108.6% year over year. EBITDA rose from $254M to $476M over the same period, so earnings power is outpacing sales. The sharp step-up in the back half of 2025 looks like commodity-price driven volatility rather than a smooth operating trend, which is consistent with the MD&A’s focus on price swings and hedging. Growth is a bull signal, but it is cyclical and less durable than the headline rate suggests.
Profitability
VNOM — Profitability (TTM)
| Metric | TTM |
|---|---|
| Operating Margin (TTM) | 55.9% |
| Net Margin (TTM) | -2.9% |
| Return on Assets (TTM) | 5.2% |
| Return on Equity (TTM) | -1.8% |
| Gross Margin (TTM) | 100.0% |
| EBITDA Margin (TTM) | 95.2% |
Source: Yahoo Finance — Trailing Twelve Months (TTM)
TTM gross margin was 100.0%, EBITDA margin was 95.2%, operating margin was 55.9%, net margin was -2.9%, ROA was 5.2%, and ROE was -1.8%. The spread between gross margin and operating margin is wide, which means the business keeps almost all revenue after direct costs but still gives up a large share to overhead, so the main issue is not pricing power but the cost structure above the gross line. EBITDA margin staying near operating margin also shows depreciation and amortisation are not the main drag.
The negative net margin and negative ROE tell me the company is still not delivering durable bottom-line profit, even though ROA is positive. The gap between ROA and ROE suggests returns are being held back by leverage and financing costs rather than by weak asset productivity alone. Investors should watch for net margin moving into positive territory and staying there, because that would show the business is finally converting its strong gross economics into shareholder earnings.
Valuation
VNOM — Valuation Multiples
| Metric | Value |
|---|---|
| Market Cap (USD Mil) | 15,730 |
| Enterprise Value (USD Mil) | 15,311 |
| Forward P/E | 18.1 |
| Price/Sales (TTM) | 10 |
| EV/Revenue | 9.7 |
| EV/EBITDA | 10.2 |
| FCF Yield % (TTM) | -6.7% |
| Forward EPS (USD) | 2.4 |
| Analyst Target Price – Low (USD) | 46 |
| Analyst Target Price – Mean (USD) | 56.4 |
| Analyst Target Price – High (USD) | 65 |
| # Analyst Opinions | 19 |
Source: Yahoo Finance
VNOM trades on a valuation stack that is rich on cash flow and earnings, with EV/Revenue at 9.7x and Price/Sales at 10.0x TTM. That multiple implies the market is pricing in a long runway of high-margin royalty cash flows, not just one strong year, because the stock is already valued at nearly 10x sales even though trailing earnings are not the cleanest guide here. Forward P/E is 18.1x, EV/EBITDA is 10.2x, and FCF Yield is -6.7% TTM, so the market is paying for durability that free cash flow has not yet confirmed.
Price/Book is 1.7x, which is not extreme, but it is less informative here because book value is only $26.3 per share versus a market value that is far above accounting capital. PEG is 1.5x, Beta is 0.25, and analyst targets run from $46 to $65 across 19 opinions, with a mean of $56.4. On the analysis here, I would put fair value in a range of roughly $46-$65, which sits inside the analyst consensus and tells me the market is not wildly mispricing the name, just paying up for a cash-flow profile that still needs to prove itself. Forward EPS of $2.42 is modest relative to the valuation, so the stock is not cheap on earnings power either. The combination of a premium revenue multiple and negative free cash flow is why I still see the setup as more demanding than attractive.
Leverage
VNOM — Leverage & Coverage (Quarterly)
| Metric | Value |
|---|---|
| Total Debt/Equity % (mrq) | 15.5 |
| Current Ratio (mrq) | 6.2 |
| Total Debt (mrq, USD Mil) | 1,603 |
| Operating Cash Flow (TTM, USD Mil) | 1,180 |
| Levered Free Cash Flow (TTM, USD Mil) | -1,046.6 |
| Net Debt/EBITDA (TTM) | 1 |
| FCF Margin % (TTM) | -66.3% |
Source: Yahoo Finance — Quarterly Financial Statements
Viper Energy’s leverage is manageable, but the cash profile is weak. Total Debt/Equity is 15.5%, Current Ratio is 6.2, and Total Debt is $1.6B, so the balance sheet has near-term liquidity headroom. Operating Cash Flow was $1.2B TTM, but Levered Free Cash Flow was $-1B and FCF Margin was -66.3%, which means EBITDA is not converting cleanly into residual cash because capital spending and other uses are absorbing it. Net Debt/EBITDA is 1.0x, a moderate credit load rather than a stretched one.
That gap between operating cash flow and levered free cash flow is the key issue. The royalty model can generate cash at the operating line, but the equity case depends on what is left after financing and other uses, and that is still negative. In my view, the current ratio gives flexibility today, but negative free cash flow means that cushion erodes if commodity prices weaken or if the revolving facility is refinanced at a higher rate.
Insider Activity
The insider transaction record I see here shows no open-market purchases or sales in the 2025-03-01 to 2025-05-20 window, so the sample is limited to awards and tax withholding only. In my view, that leaves insiders neither net buyers nor net sellers on a market-price basis, which means the record gives no fresh alignment signal for shareholders.
Comparable Analysis
Growth
| Company | Revenue TTM (USD Mil) | Revenue Growth YoY % | Diluted EPS TTM |
|---|---|---|---|
| VNOM | 1,578 | 109.1% | -0.6 |
| FANG | 14,459 | 4.2% | 1 |
| DVN | 16,003 | -0.8% | 3.6 |
| PR | 5,076.9 | 0.9% | 0.9 |
| BSM | 410.2 | 8.5% | 1.3 |
| TPL | 839 | 20.8% | 7.3 |
Source: Yahoo Finance
VNOM’s revenue growth of 109.1% TTM is far ahead of FANG at 4.2%, DVN at -0.8%, PR at 0.9%, BSM at 8.5%, and TPL at 20.8%. That top-line growth is impressive, but VNOM’s diluted EPS was -0.6 TTM while FANG was 1.0, DVN was 3.6, PR was 0.9, BSM was 1.3, and TPL was 7.3, so the market is still waiting for revenue growth to convert into earnings. I think that is the right lens for this name: growth is real, but it is not yet self-evidently compounding shareholder value.
Valuation
| Company | Trailing P/E | Forward P/E | EV/Revenue | EV/EBITDA | Price/Sales (TTM) | Market Cap (USD Mil) | Enterprise Value (USD Mil) | FCF Yield % (TTM) | Forward EPS | Analyst Target Price – Low | Analyst Target Price – Mean | Analyst Target Price – High | # Analyst Opinions |
|---|---|---|---|---|---|---|---|---|---|---|---|---|---|
| VNOM | — | 18.1 | 9.7 | 10.2 | 10 | 15,730 | 15,311 | -6.7% | 2.4 | 46 | 56.4 | 65 | 19 |
| FANG | 204.9 | 11.4 | 5.2 | 7.5 | 3.9 | 55,911 | 75,802 | 2.5% | 17.4 | 199 | 230.3 | 272 | 28 |
| DVN | 12.4 | 8.5 | 2.2 | 5.2 | 3.2 | 51,407 | 34,628 | 3.1% | 5.2 | 44 | 59.4 | 68 | 26 |
| PR | 23.5 | 10.1 | 4.1 | 5.9 | 3.5 | 18,006 | 21,033 | -0.7% | 2.1 | 22 | 25.1 | 30 | 19 |
| BSM | 11.9 | 12.8 | 9 | 10.6 | 7.8 | 3,198 | 3,674 | 3.0% | 1.2 | 16 | 16 | 16 | 1 |
| TPL | 55.7 | 5.6 | 33.1 | 40.3 | 33.4 | 28,014 | 27,784 | -0.2% | 73.1 | 248 | 443.5 | 639 | 2 |
Source: Yahoo Finance
VNOM trades at 9.7x EV/Revenue and 10.2x EV/EBITDA, versus FANG at 5.2x and 7.5x, DVN at 2.2x and 5.2x, PR at 4.1x and 5.9x, BSM at 9.0x and 10.6x, and TPL at 33.1x and 40.3x. On a peer-multiple basis, VNOM is expensive relative to the E&P group and only looks modestly cheaper than TPL, which is the clearest sign that investors are paying for royalty quality rather than for broad commodity exposure. Using the peer EV/Revenue range of 2.2x to 33.1x on VNOM’s $1.6B revenue TTM gives a very wide implied enterprise value range, which tells me this peer set is too mixed for a precise target but still leaves VNOM looking fully valued on cash flow. A $1 investment a year ago would be worth $1.26 in VNOM versus $1.41 in FANG, $1.40 in DVN, $1.56 in PR, $1.30 in BSM, and $1.26 in TPL, so VNOM has lagged the stronger E&P names while keeping pace with the more expensive land-royalty comp.
Profitability
| Company | Operating Margin (TTM) | Net Margin (TTM) | Return on Assets (TTM) | Return on Equity (TTM) | EBITDA Margin (TTM) |
|---|---|---|---|---|---|
| VNOM | 55.9% | -2.9% | 5.2% | -1.8% | 95.2% |
| FANG | 5.8% | 2.0% | -0.1% | 0.5% | 70.2% |
| DVN | 6.9% | 14.2% | 6.1% | 15.2% | 42.0% |
| PR | 9.2% | 12.8% | 5.3% | 6.9% | 70.2% |
| BSM | 14.2% | 72.5% | 14.9% | 27.8% | 84.6% |
| TPL | 77.2% | 60.0% | 25.2% | 36.5% | 82.3% |
Source: Yahoo Finance
VNOM’s 55.9% operating margin and 95.2% EBITDA margin are well above FANG’s 5.8% and 70.2%, DVN’s 6.9% and 42.0%, PR’s 9.2% and 70.2%, BSM’s 14.2% and 84.6%, and TPL’s 77.2% and 82.3%. The gross margin gap is not comparable because VNOM reports 100.0%, so the real story is operating leverage, not cost of revenue. ROA is 5.2%, which is close to DVN at 6.1% and PR at 5.3%, but ROE is -1.8%, well below DVN at 15.2%, PR at 6.9%, BSM at 27.8%, and TPL at 36.5%. That ROA and ROE split tells me VNOM’s return profile is being held down by capital structure and cash burn, not by a lack of asset productivity.
Leverage
| Company | Total Debt/Equity % (mrq) | Current Ratio (mrq) | Total Debt (mrq, USD Mil) | Operating Cash Flow TTM (USD Mil) | Free Cash Flow TTM (USD Mil) | Net Debt/EBITDA (TTM) | FCF Margin % (TTM) |
|---|---|---|---|---|---|---|---|
| VNOM | 15.5 | 6.2 | 1,603 | 1,180 | -1,046.6 | 1 | -66.3% |
| FANG | 32.6 | 0.6 | 13,898 | 8,231 | 1,397.2 | 1.4 | 9.7% |
| DVN | 56.4 | 1 | 8,695 | 6,424 | 1,607.5 | 1 | 10.0% |
| PR | 32.7 | 0.7 | 3,704 | 3,524.6 | -130.8 | 1 | -2.6% |
| BSM | 17.4 | 2.3 | 187 | 307.9 | 95.5 | 0.5 | 23.3% |
| TPL | 1.2 | 4.2 | 18 | 551.2 | -56.1 | -0.3 | -6.7% |
Source: Yahoo Finance
VNOM’s debt/equity is 15.5% and net debt/EBITDA is 1.0x, close to DVN at 56.4% and 1.0x, PR at 32.7% and 1.0x, and FANG at 32.6% and 1.4x, while BSM is lower at 17.4% and 0.5x and TPL is effectively net cash at -0.3x. The difference is that VNOM’s FCF margin is -66.3%, far weaker than FANG’s 9.7%, DVN’s 10.0%, and BSM’s 23.3%, which means the balance sheet is not the problem but cash conversion is. That matters because the market can tolerate moderate leverage when free cash flow is positive, but it is less forgiving when the company still needs commodity prices and operator activity to cooperate.
Conclusion
I would put my rating as a Sell because VNOM’s royalty model is real, but the current valuation already assumes a cleaner cash conversion path than the company has delivered. The tension is straightforward: revenue growth is strong and the balance sheet is not stretched, yet TTM levered free cash flow is still $-1B and FCF margin is -66.3%, so the equity is not being supported by cash returns today.
I would raise my rating more towards a Hold if free cash flow turns positive and stays there for two consecutive quarters, because that would show the royalty stream is finally covering the capital and financing burden rather than just inflating reported revenue. On the current $511M Q1 2026 revenue base, even a modest positive FCF margin would swing annual cash generation by hundreds of millions of dollars, which would materially improve the deleveraging path and make the 10.2x EV/EBITDA multiple easier to justify.
I would move from Sell to a more defensive stance if oil and gas pricing weakens enough to push royalty income back toward the 2023 pattern, because the 2024 reserve revisions already showed how quickly lower prices can cut both cash flow and reserve value. A move that pushes net debt/EBITDA materially above the current 1.0x, or a Sitio close that adds scale without visible cash conversion, would tell me the market is paying for acreage growth that is not translating into shareholder cash.
Weighing both sides, I lean to the bear case arriving first because the company still needs commodity prices and operator activity to cooperate before the valuation can be defended on cash generation. The royalty model is attractive, but until free cash flow turns positive, I do not think the current multiple leaves enough room for disappointment.
What’s your take? I rated Viper Energy (VNOM) SELL above — but the goal here is to get this right, not just to publish an opinion. What would you add to this analysis, or which risk or catalyst do you think I’m under- or over-weighting? Tell me in the comments.
Sources
- SEC 10-K Annual Report — filed 2025-02-26
- SEC 8-K Filing (2025-06-04)
- SEC 8-K Filing (2025-06-03)
- SEC 8-K Filing (2025-05-20)
- SEC 8-K Filing (2025-05-05)
- SEC 8-K Filing (2025-05-05)
- SEC 8-K Filing (2025-04-23)
- SEC Form 4 Insider Transaction (2025-05-22)
- SEC Form 4 Insider Transaction (2025-05-22)
- SEC Form 4 Insider Transaction (2025-05-22)
- SEC 10-K Annual Report — FY2025
- SEC 10-K Annual Report — FY2024
Data sourced from Yahoo Finance and SEC EDGAR. Not investment advice.
Leave a Comment