
Quick Thesis
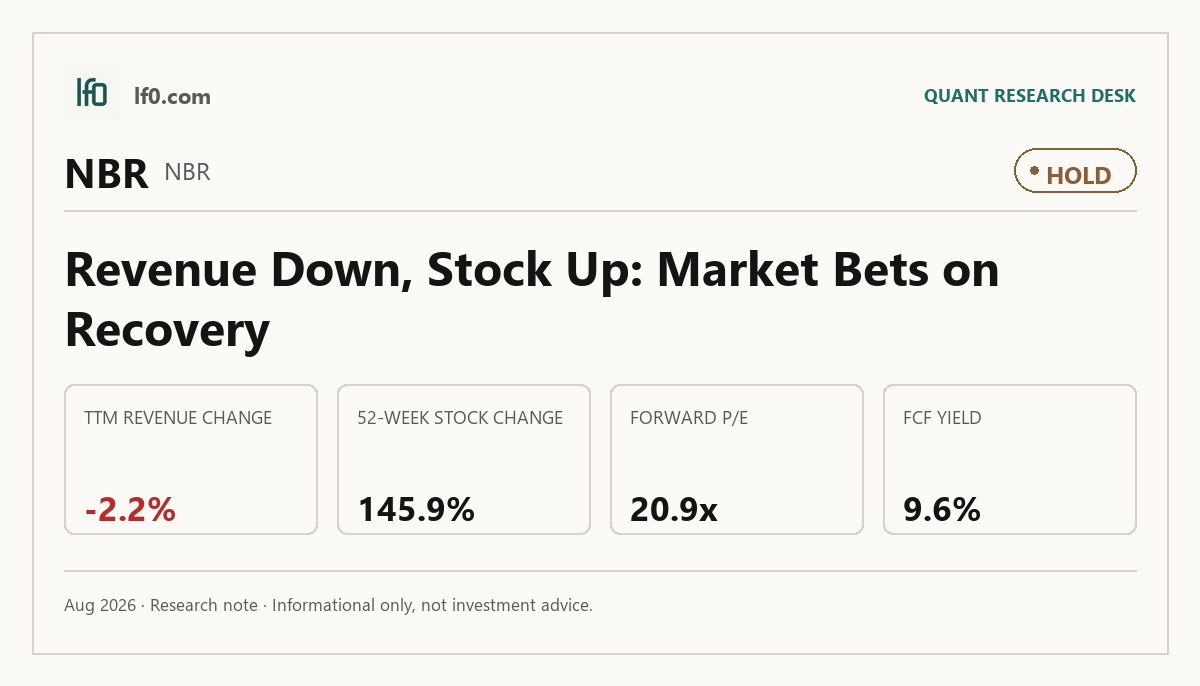
- Rated hold — the market has priced in a recovery faster than revenue has delivered.
- Best strength: 9.6% TTM FCF yield with 1.8x net debt/EBITDA.
- Main risk: Saudi Aramco was 30.0% of 2025 operating revenue, with the top three customers at 41.0%.
- Valuation is mixed: 4.4x EV/EBITDA looks cheap, but 20.9x forward P/E is not.
- I would turn more constructive if quarterly revenue reclaims $832.8M and holds there.
Executive Summary
Rating: HOLD | NBR
Measured from adjusted close on 2026-08-28 to 2026-10-13. Sell ratings are correct when the stock falls; Hold is tracked as a +/-10% range. Daily-close data, not intraday. Calls are tracked for 182 days from publication, then frozen as a final record.
I would put my rating as a Hold because Nabors has improved the portfolio and balance sheet, but the latest revenue trend still does not justify a more aggressive call. The company’s 9.6% TTM FCF yield and 1.8x net debt/EBITDA support the equity, yet Q2 2026 revenue of $814.8M remained below Q2 2025 revenue of $832.8M, so the core drilling base is still stabilizing rather than reaccelerating. In my view, the key question is whether the international and technology mix can offset a softer U.S. rig market without relying on leverage to do the work. I would raise my rating more towards a Buy if revenue can hold above $830M for two consecutive quarters and operating margin moves into the low teens, meaning the business is converting more of each revenue dollar into operating profit.
Company Profile
Nabors Industries Ltd. is a global drilling contractor and equipment provider that earns revenue from dayrate drilling contracts, performance software, tubular running services, managed pressure drilling, and sales and aftermarket service of rig equipment. It was formed as a Bermuda exempted company on December 11, 2001, and is listed on the New York Stock Exchange under NBR. The company operates in more than 20 countries and, as of December 31, 2025, marketed 121 land rigs and 13 offshore platform rigs. Nabors also completed the Parker Drilling Company acquisition on March 11, 2025, then sold Quail Tools, LLC on August 20, 2025, which left the portfolio more focused on drilling and technology services. The business is supported by a global workforce of about 13,900 employees in FY2025.
Economic Moat
Business Model
The most defensible part of Nabors’ model is the integration of drilling hardware, automation software, and field services into the rig itself, because that bundle is harder to copy than a stand-alone rig fleet. Nabors ties downhole hardware, surface equipment, RigCLOUD, Rig Zone Robotics, tubular running services, and managed pressure drilling into one operating system, and I feel a well-funded rival would need several years to match both the equipment stack and the field execution behind it. That is reinforced by the company’s own view that it can replace third-party providers on its rigs, which makes the service layer stickier than a pure dayrate business. The scale helps too: 242 actively marketed land rigs, 27 offshore platform rigs, and operations in more than 20 countries give Nabors a broader footprint than a niche contractor.
Business & Operating Risks
The biggest disclosed risk is customer concentration, led by Saudi Aramco, which supplied 30.0% of consolidated operating revenues in 2025, while the three largest contract drilling customers together supplied 41.0% of revenue. If one of those relationships weakens, the revenue hit would be immediate and hard to replace. Contract renegotiation and suspension are the next pressure point because drilling contracts can be renegotiated, suspended, or terminated on short notice, sometimes without an early termination payment. Oil and natural gas price volatility remains a broad demand risk, and the company recognized 26.5M of impairment charges in 2025 related to tangible assets and equipment. The disclosed risks do threaten the moat, but they do so through utilization and customer concentration rather than by undermining the integrated rig-and-technology model itself.
Management Discussion & Analysis
Management is responding to those risks by reshaping the portfolio and extending liquidity, even if the concentration issue itself remains. The Parker Drilling acquisition added global drilling services, while the Quail Tools sale removed a non-core asset and created cash, so the mix is moving toward the integrated rig-and-technology model described above. The November 10, 2025 issuance of $700M of 7.625% senior priority guaranteed notes due November 15, 2032 pushed out near-term refinancing pressure, but it did not change the fact that the company still carries a heavy debt load. International Drilling revenue rose 10.0% in 2025 and adjusted operating income rose 52.0%, while U.S. Drilling revenue fell 5.0% and adjusted operating income fell 25.0%, so management’s own numbers show where the offset to concentration risk is coming from.
Recent Events
The most significant development was the January 15, 2026 redemption of the 7.5% Senior Guaranteed Notes due 2028. That is a balance-sheet step, not a growth initiative, and it lowers refinancing risk for a capital-intensive driller that needs flexibility through the cycle. On April 7, 2026, Nabors and Nabors Delaware added $25M of incremental letters of credit capacity under the A&R Credit Agreement, lifting the aggregate letters of credit maximum to $150M without reducing revolver capacity. The April 28, 2026 earnings release and the June 2, 2026 annual meeting were routine, but the compensation advisory proposal failed with only 33.7% support, which tells me shareholders are still pressing management on capital discipline.
Financial Analysis
Growth
NBR — Financial Growth (Quarterly, USD Mil)
| Metric | 2025-06-30 | 2025-09-30 | 2025-12-31 | 2026-03-31 | 2026-06-30 |
|---|---|---|---|---|---|
| REVENUE (USD Mil) | 832.8 | 818.2 | 797.5 | 783.5 | 814.8 |
| EBIT (USD Mil) | 77 | 474.4 | 75.1 | 64.9 | 57.6 |
| EBITDA (USD Mil) | 252 | 634.7 | 234.2 | 221.1 | 218.1 |
| NET INCOME (USD Mil) | -30.9 | 274.2 | 10.3 | -15.2 | -22.3 |
| DILUTED EPS | -2.7 | 16.9 | 0.2 | -1.5 | -2 |
Source: Yahoo Finance — Quarterly Financial Statements
Nabors’ revenue has drifted lower across the latest four reported quarters, from $832.8M in Q2 2025 to $814.8M in Q2 2026, so the top line is stable but not yet growing. EBITDA was much more volatile, swinging from $252M in Q2 2025 to $634.7M in Q3 2025 and back to $218.1M in Q2 2026, which suggests mix and pricing swings rather than steady operating leverage. That matters for the moat because the integrated rig-and-technology model should eventually smooth earnings, but the current numbers still show a business that is not yet compounding cleanly.
Profitability
NBR — Profitability (TTM)
| Metric | TTM |
|---|---|
| Operating Margin (TTM) | 7.5% |
| Net Margin (TTM) | 7.7% |
| Return on Assets (TTM) | 3.3% |
| Return on Equity (TTM) | 22.3% |
| Gross Margin (TTM) | 38.4% |
| EBITDA Margin (TTM) | 27.5% |
Source: Yahoo Finance — Trailing Twelve Months (TTM)
TTM operating margin was 7.5%, while gross margin was 38.4% and EBITDA margin was 27.5%. The 31.0-point gap between gross and operating margin shows the core offering still converts well at the revenue line, but overhead and field support absorb much of that spread before it reaches operating profit. TTM net margin was 7.7%, so the business is only modestly above breakeven on a GAAP basis and remains sensitive to any slip in rig demand or pricing. TTM ROA was 3.3% and TTM ROE was 22.3%, which tells me leverage is amplifying returns more than asset productivity alone.
Valuation
NBR — Valuation Multiples
| Metric | Value |
|---|---|
| Market Cap (USD Mil) | 1,392 |
| Enterprise Value (USD Mil) | 3,873 |
| Trailing P/E | 5.9 |
| Forward P/E | 20.9 |
| Price/Sales (TTM) | 0.4 |
| Price/Book (mrq) | 2.5 |
| EV/Revenue | 1.2 |
| EV/EBITDA | 4.4 |
| Beta (5Y Monthly) | 1.01 |
| FCF Yield % (TTM) | 9.6% |
| Forward EPS (USD) | 4.4 |
| Analyst Target Price – Low (USD) | 80 |
| Analyst Target Price – Mean (USD) | 106.6 |
| Analyst Target Price – High (USD) | 130 |
| # Analyst Opinions | 8 |
Source: Yahoo Finance
Nabors trades on a mixed but not cheap valuation profile. EV/Revenue is 1.2x and EV/EBITDA is 4.4x, which are low enough to say the market is still discounting a cyclical drilling contractor rather than a stable cash compounder. That discount is partly justified because FCF margin is only 4.2% TTM and net debt/EBITDA is 1.8x TTM, so investors are paying for cash generation that is improving but not yet fully dependable. Trailing P/E is 5.9x, while forward P/E is 20.9x, and that jump tells me the market is pricing in a sharp normalization in current earnings power rather than a straight-line continuation of the latest quarter. FCF yield is 9.6%, which is the clearest cheapness metric here.
On the analysis here, I would put fair value in a range of roughly $80–$130 per share, which is broadly in line with the analyst target range of $80 to $130 from eight opinions. I would not call that a strong consensus, but it is a real one, and my range sits inside it rather than below it. On earnings, I would anchor forward EPS around 4.4, with a practical range of about $4.0-$4.8 if revenue stabilizes and margins hold near current levels. That looks richer than peers on a forward-EPS basis because the market is paying Nabors for a cleaner cash floor and a better balance-sheet profile, not for faster growth.
Leverage
NBR — Leverage & Coverage (Quarterly)
| Metric | Value |
|---|---|
| Total Debt/Equity % (mrq) | 147.6 |
| Current Ratio (mrq) | 1.9 |
| Total Debt (mrq, USD Mil) | 2,128.5 |
| Operating Cash Flow (TTM, USD Mil) | 702.3 |
| Levered Free Cash Flow (TTM, USD Mil) | 134.2 |
| Net Debt/EBITDA (TTM) | 1.8 |
| FCF Margin % (TTM) | 4.2% |
Source: Yahoo Finance — Quarterly Financial Statements
Nabors carries $2.1B of total debt against a current ratio of 1.9x and total debt/equity of 147.6%, so the balance sheet is levered but not stretched to the point of immediate distress. TTM operating cash flow was $702.3M and levered free cash flow was $134.2M, which means EBITDA is converting to cash, but a large share is being absorbed before it reaches equity holders. Net debt/EBITDA of 1.8x is manageable for a cyclical energy-services name, and the 4.2% FCF margin is thin relative to the debt load. I would watch for FCF margin moving toward 6% and net debt/EBITDA moving closer to 1.5x, because that would show the company is creating more room to absorb a weaker drilling cycle.
Insider Activity
The insider transaction record I see here is buying only, with one open-market purchase and no open-market sales in the 2024-12-31 to 2026-06-02 window. The activity is concentrated in a single director, John Yearwood, so the sample is limited rather than broad-based, but the absence of open-market selling still points to alignment with shareholders. I would not overread one purchase as a broad bullish signal.
Comparable Analysis
Growth
| Company | Revenue TTM (USD Mil) | Revenue Growth YoY % | EBITDA TTM (USD Mil) | Diluted EPS TTM |
|---|---|---|---|---|
| NBR | 3,214.1 | -2.2% | 884.3 | 15.5 |
| NE | 2,884.7 | -16.3% | 944.3 | 1 |
| HAL | 22,373 | 3.7% | 4,139 | 2 |
| NOV | 8,639 | -2.5% | 986 | 0.3 |
| BORR | 1,015.8 | -13.2% | 373.1 | -0.8 |
| SLB | 36,366 | 5.0% | 7,383 | 2.1 |
Source: Yahoo Finance
NBR’s revenue fell 2.2% TTM on $3.2B of revenue, versus NE down 16.3% and BORR down 13.2%, while HAL grew 3.7% and SLB grew 5.0%. That puts NBR in the middle of the group, which supports a modest premium to the shrinking offshore drillers but not a growth premium to the larger service names. The growth profile is better than the weakest peers, but it is not strong enough to justify a premium multiple on its own.
Valuation
| Company | Trailing P/E | Forward P/E | EV/Revenue | EV/EBITDA | Price/Sales (TTM) | Price/Book (mrq) | Market Cap (USD Mil) | Enterprise Value (USD Mil) | Beta (5Y Monthly) | FCF Yield % (TTM) | Forward EPS | Analyst Target Price – Low | Analyst Target Price – Mean | Analyst Target Price – High | # Analyst Opinions |
|---|---|---|---|---|---|---|---|---|---|---|---|---|---|---|---|
| NBR | 5.9 | 20.9 | 1.2 | 4.4 | 0.4 | 2.5 | 1,392 | 3,873 | 1.01 | 9.6% | 4.4 | 80 | 106.6 | 130 | 8 |
| NE | 48.2 | 22.9 | 3.1 | 9.4 | 2.6 | 1.7 | 7,462 | 8,914 | 0.92 | 3.4% | 2 | 35 | 48 | 59 | 11 |
| HAL | 18 | 12.2 | 1.6 | 8.6 | 1.3 | 2.7 | 29,568 | 35,761 | 0.75 | 6.9% | 2.9 | 29 | 43.2 | 53 | 25 |
| NOV | 74.1 | 16.2 | 1 | 8.7 | 0.9 | 1.2 | 7,400 | 8,618 | 0.94 | 9.1% | 1.3 | 17 | 22.2 | 26 | 19 |
| BORR | — | 32.1 | 3.6 | 9.8 | 1.4 | 1.5 | 1,401 | 3,664 | 1.01 | -4.7% | 0.1 | 3.5 | 5.1 | 6.2 | 6 |
| SLB | 26.2 | 17 | 2.5 | 12.4 | 2.2 | 3.1 | 81,643 | 91,509 | 0.75 | 3.6% | 3.2 | 43 | 61.9 | 71 | 29 |
Source: Yahoo Finance
NBR trades at 4.4x EV/EBITDA, 1.2x EV/Revenue, 5.9x trailing P/E, and a 9.6% FCF yield, versus HAL at 8.6x, 1.6x, 18.0x, and 6.9%, SLB at 12.4x, 2.5x, 26.2x, and 3.6%, and NE at 9.4x, 3.1x, 48.2x, and 3.4%. On forward EPS, NBR’s 4.4 is well above HAL’s 2.9, SLB’s 3.2, NE’s 2.0, and NOV’s 1.3, so the stock is pricing a much stronger earnings base than the peers despite a lower multiple. That gap is easier to accept because NBR’s net debt/EBITDA is only 1.8x, while BORR’s is 6.1x and its FCF margin is negative, so the market is rewarding balance-sheet safety as much as earnings quality.
Profitability
| Company | Operating Margin (TTM) | Net Margin (TTM) | Return on Assets (TTM) | Return on Equity (TTM) | Gross Margin (TTM) | EBITDA Margin (TTM) |
|---|---|---|---|---|---|---|
| NBR | 7.5% | 7.7% | 3.3% | 22.3% | 38.4% | 27.5% |
| NE | 10.7% | 5.2% | 3.1% | 3.3% | 35.4% | 32.7% |
| HAL | 12.8% | 7.2% | 7.3% | 14.9% | 15.1% | 18.5% |
| NOV | 7.2% | 1.1% | 3.4% | 1.5% | 21.6% | 11.4% |
| BORR | 0.1% | -24.0% | 3.8% | -24.7% | 43.7% | 36.7% |
| SLB | 12.7% | 8.5% | 6.2% | 12.9% | 17.0% | 20.3% |
Source: Yahoo Finance
NBR’s gross margin of 38.4%, EBITDA margin of 27.5%, operating margin of 7.5%, and net margin of 7.7% all beat NE on gross and EBITDA but trail HAL and SLB on operating efficiency. HAL posts only 15.1% gross margin and 18.5% EBITDA margin, while NOV sits at 21.6% gross margin and 11.4% EBITDA margin, so NBR has a better cost-of-revenue profile than most peers. The margin mix supports a quality premium over the offshore drillers, but it does not justify paying up to the integrated service leaders.
Leverage
| Company | Total Debt/Equity % (mrq) | Current Ratio (mrq) | Total Debt (mrq, USD Mil) | Operating Cash Flow TTM (USD Mil) | Free Cash Flow TTM (USD Mil) | Net Debt/EBITDA (TTM) | FCF Margin % (TTM) |
|---|---|---|---|---|---|---|---|
| NBR | 147.6 | 1.9 | 2,128.5 | 702.3 | 134.2 | 1.8 | 4.2% |
| NE | 42.6 | 1.9 | 1,908.2 | 881.7 | 252.9 | 1.5 | 8.8% |
| HAL | 74.2 | 2 | 8,199 | 2,750 | 2,052.2 | 1.5 | 9.2% |
| NOV | 37.2 | 2.4 | 2,326 | 916 | 673.4 | 1.2 | 7.8% |
| BORR | 258.6 | 2.5 | 2,486.8 | 133.2 | -66 | 6.1 | -6.5% |
| SLB | 47 | 1.4 | 12,810 | 6,533 | 2,955.1 | 1.2 | 8.1% |
Source: Yahoo Finance
NBR’s debt/equity is 147.6%, but net debt/EBITDA is only 1.8x and FCF margin is 4.2%, versus BORR at 258.6% debt/equity, 6.1x net debt/EBITDA, and negative 6.5% FCF margin. HAL, NOV, and SLB all sit near 1.2x net debt/EBITDA with FCF margins of 9.2%, 7.8%, and 8.1%, so NBR is levered, but not in the same risk bucket as BORR. The current ratio of 1.9x and $509.8M of cash also give it more flexibility than the more levered offshore names.
Conclusion
I would put my rating as a Hold because Nabors has a better balance sheet and cleaner portfolio than it did a year ago, but the market has already priced in a recovery that the latest revenue trend has not yet confirmed. The tension is simple: the company is generating real cash, yet the core drilling base is still not growing fast enough to make the current valuation feel cheap on a forward basis. That is why I am not more aggressive here, even though the leverage profile is manageable.
I would raise my rating more towards a Buy if quarterly revenue can hold above $830M for two consecutive quarters, because that would show the fleet is finally stabilizing after the Parker Drilling integration and the Quail Tools sale. If operating margin also moves into the low teens, meaning roughly 3 to 4 points above the current 7.5% TTM level, that would add about $100M to $130M of annual operating profit on the current revenue base and would materially improve the deleveraging path. On the downside, I would move from Hold to Sell if revenue slips back below $780M for a quarter, because that would tell me the recent stabilization was temporary and that utilization is still drifting lower. A second warning sign would be FCF margin falling back toward 2%, since that would cut cash generation by roughly half from the current 4.2% TTM level and leave less room to service the $2.1B debt load if dayrates soften.
Weighing both paths, I think the bear case is less likely to hit first, but the bull case still needs proof that has not arrived yet. The stock has already moved a long way, and until the revenue line turns up with better consistency, I am not willing to pay for a recovery that remains only partly visible in the numbers.
What to Watch Next
- Quarterly revenue above $830M for two straight quarters — would support raising the rating toward Buy.
- Operating margin in the low teens — would show earnings leverage is finally improving.
- FCF margin near 2% or lower — would argue the cash floor is weakening.
- Revenue below $780M in a quarter — would signal utilization is still slipping.
- Net debt/EBITDA moving toward 1.5x — would strengthen the balance-sheet case.
What’s your take? I rated Nabors Industries (NBR) HOLD above — but the goal here is to get this right, not just to publish an opinion. What would you add to this analysis, or which risk or catalyst do you think I’m under- or over-weighting? Tell me in the comments.
Sources
- SEC 10-K Annual Report — filed 2026-02-13
- SEC 8-K Filing (2026-06-05)
- SEC 8-K Filing (2026-04-28)
- SEC 8-K Filing (2026-04-07)
- SEC 8-K Filing (2026-02-11)
- SEC 8-K Filing (2026-01-15)
- SEC Form 4 Insider Transaction (2026-06-03)
- SEC Form 4 Insider Transaction (2026-06-03)
- SEC Form 4 Insider Transaction (2026-06-03)
- SEC 10-K Annual Report — FY2026
- SEC 10-K Annual Report — FY2025
- SEC 10-K Annual Report — FY2024
- SEC 10-K Annual Report — FY2023
- SEC 10-K Annual Report — FY2022
Data sourced from Yahoo Finance and SEC EDGAR. Not investment advice.
Leave a Comment