
| Company | Aug 25 | Sep 25 | Oct 25 | Nov 25 | Dec 25 | Jan 26 | Feb 26 | Mar 26 | Apr 26 | May 26 | Jun 26 | Jul 26 | 12-Mo |
|---|---|---|---|---|---|---|---|---|---|---|---|---|---|
| PPG | +6% | -6% | -7% | +3% | +2% | +13% | +7% | -13% | +2% | +5% | +7% | -9% | +8% |
| RPM | +7% | -6% | -7% | -2% | -3% | +3% | +7% | -13% | +3% | +4% | +5% | -3% | -7% |
| ECL | +6% | -1% | -6% | +7% | -4% | +7% | +9% | -13% | -2% | -2% | +9% | -0% | +7% |
| AKZOY | +10% | +3% | -7% | -3% | +7% | +0% | +1% | -18% | +5% | +30% | -11% | +3% | +14% |
| SHW | +11% | -5% | -0% | -0% | -6% | +9% | +2% | -11% | +0% | -5% | +13% | -1% | +4% |
| AXTA | +10% | -8% | -1% | +6% | +7% | +4% | -1% | -17% | +3% | +8% | +11% | +5% | +26% |
Source: Yahoo Finance monthly adjusted close.
Quick Thesis
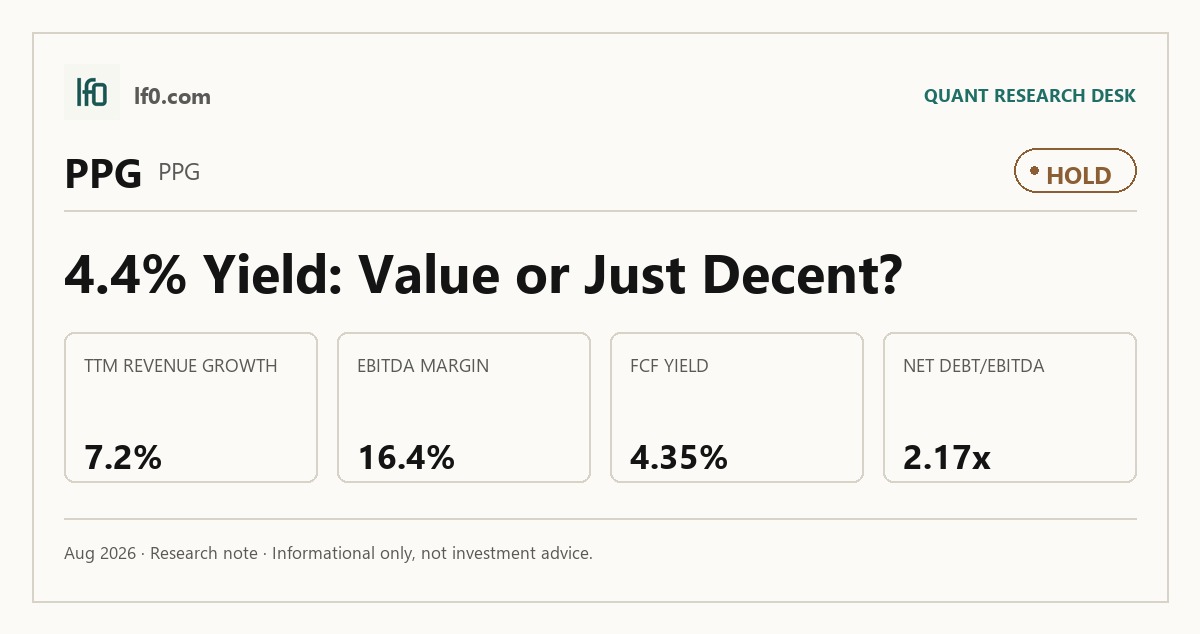
- Rated Hold — valuation already discounts steady cash generation, not a rerating.
- Strongest support: TTM operating margin of 14.0% and FCF yield of 4.4%.
- Main risk: net debt/EBITDA of 2.2x, with margin pressure still visible.
- Valuation looks fair versus peers at 11.6x EV/EBITDA and 13.2x forward P/E.
- I would turn more constructive if FCF margin moves above 8.0%, meaning cash conversion improves.
Executive Summary
Rating: HOLD | PPG
Measured from adjusted close on 2026-08-31 to 2026-10-14. Sell ratings are correct when the stock falls; Hold is tracked as a +/-10% range. Daily-close data, not intraday. Calls are tracked for 182 days from publication, then frozen as a final record.
I would put my rating as a Hold because PPG is a profitable, diversified coatings business, but the current valuation already reflects that stability and not a clear earnings step-up. The key strength is the company’s 14.0% TTM operating margin, which shows the core franchise still converts sales into profit at a healthy rate. The key risk is leverage and margin pressure: net debt/EBITDA is 2.2x, so a modest cost shock would still flow through earnings before pricing fully catches up. I would raise my rating more towards a Buy if free cash flow margin moves above 8.0%, meaning cash conversion improves enough to support a higher multiple.
Company Profile
PPG Industries, Inc. manufactures and distributes paints, coatings, and specialty products for industrial equipment, packaging, aircraft, marine equipment, automotive original equipment, automotive refinish, pavement marking, and architectural end markets. Incorporated in Pennsylvania in 1883, it markets and sells in more than 50 countries and operates through three segments: Global Architectural Coatings, Performance Coatings, and Industrial Coatings. Its footprint includes principal manufacturing and distribution facilities across North America, Europe, Latin America, and Asia, with 43,500 employees as of December 31, 2025. PPG also runs research and development centers and spent $446M on research and development in 2025, equal to 2.8% of annual net sales. The company is listed on the New York Stock Exchange under PPG and finances itself with a global operating base and ongoing operating cash flow.
Economic Moat
Business Model
PPG’s moat is built on specification-led coatings, technical service, and brand strength rather than on simple scale alone. In my view, the hardest part to replicate is the industrial coatings model, where PPG works inside original equipment manufacturer workflows and has to earn qualification, application know-how, and service trust before it can win volume. The architectural coatings franchise adds a second layer of defense through trusted brands and a broad distribution network, while aerospace and automotive refinish products benefit from highly specified formulations that are harder to displace quickly. R&D spending of $446M, or 2.8% of sales, reinforces that edge because it keeps the product set close to customer needs rather than commoditized.
Business & Operating Risks
The main disclosed risk is raw material inflation and supply disruption, because raw materials are PPG’s single largest production cost component and shortages have already affected production in the past. Foreign exchange, tariffs, geopolitical tension, and weak industrial demand add a second layer of pressure because they can hit both reported sales and margins at the same time. Cybersecurity, AI adoption, and acquisition integration are also material because PPG depends on global systems for orders, shipping, payroll, and vendor payments, and the company has completed more than 50 acquisitions over the last decade. I do not think these risks break the moat itself, but they do threaten the margin durability that the moat is supposed to protect.
Management Discussion & Analysis
Management is responding, but not in a way that removes the pressure yet. The company is still returning capital through buybacks and dividends while also funding restructuring, and that tells me the priority is preserving flexibility rather than aggressively deleveraging. The October 2024 restructuring is the clearest operational response: it is meant to deliver about $175M of annualized pre-tax savings, with about $75M booked in 2025 and another $50M expected in 2026. That helps offset the risks above, but the 2025 decline in adjusted EPS to $7.58 shows the savings are still compensating for pressure rather than creating a clean inflection.
Recent Events
The most important recent development is the finance leadership transition. On April 28, 2026, PPG named Jamie A. Beggs as Senior Vice President and Chief Financial Officer, effective July 6, 2026, as Vincent J. Morales retires the same day. I view that as constructive because it preserves continuity in capital allocation and reporting discipline. The board also approved performance-based Market Stock Unit awards tied to stock-price performance and 2028 adjusted EPS, which aligns management pay with the earnings repair the thesis needs. The recent 8-Ks are therefore supportive, but they do not yet change the core investment case.
Financial Analysis
Growth
PPG — Financial Growth (Quarterly, USD Mil)
| Metric | 2025-06-30 | 2025-09-30 | 2025-12-31 | 2026-03-31 | 2026-06-30 |
|---|---|---|---|---|---|
| REVENUE (USD Mil) | 4,195 | 4,082 | 3,914 | 3,930 | 4,495 |
| EBIT (USD Mil) | 660 | 621 | 447 | 578 | 640 |
| EBITDA (USD Mil) | 795 | 759 | 581 | 710 | 774 |
| NET INCOME (USD Mil) | 450 | 453 | 300 | 382 | 437 |
| DILUTED EPS | 2 | 2 | 1.3 | 1.7 | 1.9 |
Source: Yahoo Finance — Quarterly Financial Statements
PPG’s revenue was essentially flat in the latest twelve months, with net sales of $15.9B in FY2025 versus $15.8B in FY2024, a 0.2% increase. The quarterly path was choppy: revenue fell from $4.2B in Q2 2025 to $3.9B in Q4 2025, then recovered to $4.5B in Q2 2026, so the latest quarter was up 7.2% year over year. EBITDA and net income followed the same pattern, which tells me the business is stabilizing rather than accelerating. That is consistent with the moat thesis: the franchise is resilient, but it is not yet compounding fast enough to justify a premium call.
Profitability
PPG — Profitability (TTM)
| Metric | TTM |
|---|---|
| Operating Margin (TTM) | 14.0% |
| Net Margin (TTM) | 9.6% |
| Return on Assets (TTM) | 6.0% |
| Return on Equity (TTM) | 19.3% |
| Gross Margin (TTM) | 41.2% |
| EBITDA Margin (TTM) | 16.4% |
Source: Yahoo Finance — Trailing Twelve Months (TTM)
TTM gross margin was 41.2%, EBITDA margin was 16.4%, operating margin was 14.0%, and net margin was 9.6%. The 27.2-point gap between gross and operating margin shows PPG still converts a solid share of sales into gross profit, but overhead and depreciation absorb a meaningful portion before earnings reach the bottom line. TTM ROA was 6.1% and ROE was 19.3%, which tells me leverage is helping returns but also means those returns are not purely driven by asset efficiency. The profitability profile is solid, yet not strong enough to support a rerating on its own.
Valuation
PPG — Valuation Multiples
| Metric | Value |
|---|---|
| Trailing P/E | 16.3 |
| Forward P/E | 13.2 |
| EV/Revenue | 1.9 |
| EV/EBITDA | 11.6 |
| Forward EPS (USD) | 8.7 |
| Analyst Target Price – Low (USD) | 115 |
| Analyst Target Price – Mean (USD) | 126.2 |
| Analyst Target Price – High (USD) | 138 |
Source: Yahoo Finance
PPG trades at 1.9x enterprise value to revenue and 1.6x price to sales on TTM revenue, which tells me the market is paying for a steady industrial cash generator rather than a reacceleration story. The earnings multiples are more informative because PPG is profitable: 16.3x trailing P/E, 13.2x forward P/E, and 11.6x EV/EBITDA. The 4.4% FCF yield and 2.2x net debt/EBITDA support that view, while 3.0x price to book and $7.2 of cash per share against $38.0 of book value per share show a balance sheet that is workable but not underlevered. Analyst targets cluster at $115.0 to $138.0, with a $126.2 mean across 20 opinions, so my fair-value range of roughly $118-$132 sits inside consensus and slightly above the current market because I give more weight to cash conversion than to the still-modest growth profile. On earnings, I would frame fair value around 8.7 of forward EPS, which is close to the company’s 8.7 forward EPS and below the richer peer EPS profiles at SHW and ECL; that makes PPG look fairly priced on a like-for-like basis rather than cheap. I merged the rating view here because the stock is not expensive enough to be a Sell, but the leverage and growth mix are not strong enough to justify a Buy.
Leverage
PPG — Leverage & Coverage (Quarterly)
| Metric | Value |
|---|---|
| Total Debt/Equity % (mrq) | 86.9 |
| Current Ratio (mrq) | 1.6 |
| Total Debt (mrq, USD Mil) | 7,468 |
| Operating Cash Flow (TTM, USD Mil) | 2,164 |
| Levered Free Cash Flow (TTM, USD Mil) | 1,104.6 |
| Net Debt/EBITDA (TTM) | 2.2 |
| FCF Margin % (TTM) | 6.7% |
Source: Yahoo Finance — Quarterly Financial Statements
PPG’s leverage is moderate, not stretched. Total debt/equity was 86.9%, current ratio was 1.6, and total debt was $7.5B. That debt load is manageable because operating cash flow was $2.2B TTM and levered free cash flow was $1.1B, so the business is still converting earnings into cash after capex and interest. Net debt/EBITDA was 2.2x, which leaves room to absorb a downturn before refinancing pressure becomes acute, and FCF margin was 6.7%, a decent but not wide cash cushion for a cyclical coatings and materials business. The balance sheet is therefore a neutral signal: it supports the equity, but it does not create a financing edge.
Insider Activity
The insider transaction record I see here is one-sided: 0 open-market purchases and 9 open-market sales for $15.8M over 2025-02-14 to 2026-04-15. The only open-market trade in the recent window is a sale by Anne M. Foulkes, Sr. VP, Legal & Spl. P, which does not help the alignment case. In my view, that is a mild bear signal because insiders are net sellers and there is no offsetting open-market buying.
Comparable Analysis
Growth
| Company | Revenue TTM (USD Mil) | Revenue Growth YoY % | EBITDA TTM (USD Mil) | Diluted EPS TTM |
|---|---|---|---|---|
| PPG | 16,421 | 7.2% | 2,698 | 7 |
| RPM | 7,863.4 | 7.2% | 1,197 | 5.2 |
| ECL | 16,842.5 | 9.7% | 4,135.7 | 7.5 |
| AKZOY | 9,894 | -1.4% | 1,068 | 1.5 |
| SHW | 24,410.3 | 7.5% | 4,709.1 | 10.8 |
| AXTA | 5,150 | 3.1% | 991 | 1.6 |
Source: Yahoo Finance
PPG’s revenue growth of 7.2% TTM sits in the middle of the group, behind ECL at 9.7% and just ahead of SHW at 7.5% and RPM at 7.2%. AXTA at 3.1% and AKZOY at -1.4% show weaker momentum, so PPG is not a growth leader but also not a laggard. That matters because the market should not pay a premium multiple for PPG on growth alone.
Valuation
| Company | Trailing P/E | Forward P/E | EV/Revenue | EV/EBITDA | Price/Sales (TTM) | Price/Book (mrq) | Beta (5Y Monthly) | FCF Yield % (TTM) | Forward EPS | Analyst Target Price – Low | Analyst Target Price – Mean | Analyst Target Price – High | # Analyst Opinions |
|---|---|---|---|---|---|---|---|---|---|---|---|---|---|
| PPG | 16.3 | 13.2 | 1.9 | 11.6 | 1.5 | 3 | 1.06 | 4.3% | 8.7 | 115 | 126.2 | 138 | 20 |
| RPM | 20.4 | 15.8 | 2.1 | 13.6 | 1.7 | 4.1 | 1.05 | 3.5% | 6.8 | 115 | 130.5 | 151 | 14 |
| ECL | 38.3 | 30.4 | 5.3 | 21.6 | 4.8 | 8 | 0.89 | 1.8% | 9.4 | 295 | 325 | 360 | 21 |
| AKZOY | 16.5 | 13.7 | 1.6 | 14.7 | 1.3 | 2.2 | 1.18 | 6.7% | 1.8 | 26 | 27 | 28 | 2 |
| SHW | 31.8 | 25.3 | 4 | 20.8 | 3.4 | 21.6 | 1.09 | 3.0% | 13.6 | 340 | 391 | 420 | 22 |
| AXTA | 22.7 | 12.9 | 2 | 10.5 | 1.5 | 3.1 | 1.24 | 6.8% | 2.9 | 33 | 38.6 | 44 | 14 |
Source: Yahoo Finance
PPG’s 11.6x EV/EBITDA and 13.2x forward P/E are below SHW’s 20.8x and 25.3x, well below ECL’s 21.6x and 30.4x, but above AXTA’s 10.5x and 12.9x and AKZOY’s 14.7x and 13.7x. The 4.4% FCF yield is better than RPM’s 3.5% and much better than ECL’s 1.8%, which tells me PPG is not being priced like a premium compounder. On a growth-adjusted basis, that looks fair rather than cheap, especially because PPG’s leverage is lower than SHW’s but its growth is also less exciting.
Profitability
| Company | Operating Margin (TTM) | Net Margin (TTM) | Return on Assets (TTM) | Return on Equity (TTM) | Gross Margin (TTM) | EBITDA Margin (TTM) |
|---|---|---|---|---|---|---|
| PPG | 14.0% | 9.6% | 6.0% | 19.3% | 41.2% | 16.4% |
| RPM | 15.3% | 8.4% | 7.6% | 21.4% | 41.4% | 15.2% |
| ECL | 18.5% | 12.6% | 7.2% | 22.0% | 44.2% | 24.6% |
| AKZOY | 10.8% | 6.4% | 3.3% | 14.1% | 40.3% | 10.8% |
| SHW | 18.1% | 11.0% | 9.5% | 65.1% | 49.0% | 19.3% |
| AXTA | 15.2% | 6.8% | 6.1% | 14.3% | 34.0% | 19.2% |
Source: Yahoo Finance
PPG’s 14.0% operating margin and 16.4% EBITDA margin trail ECL, SHW, and RPM, while beating AKZOY on both measures and AXTA on operating margin. Gross margin at 41.2% is close to RPM’s 41.4% and ECL’s 44.2%, which means the gap versus SHW’s 49.0% is more about product mix and scale than about basic cost control. Net margin at 9.6% is solid, but not enough to justify a premium on profitability alone.
Leverage
| Company | Total Debt/Equity % (mrq) | Current Ratio (mrq) | Net Debt/EBITDA (TTM) | FCF Margin % (TTM) |
|---|---|---|---|---|
| PPG | 86.9 | 1.6 | 2.2 | 6.7% |
| RPM | 89 | 1.7 | 2.2 | 6.1% |
| ECL | 138 | 1.8 | 2.1 | 8.8% |
| AKZOY | 131 | 1.9 | 2.9 | 8.3% |
| SHW | 390 | 0.7 | 3.1 | 10.3% |
| AXTA | 119.4 | 1.5 | 2.5 | 10.5% |
Source: Yahoo Finance
PPG’s net debt/EBITDA of 2.2x is close to RPM’s 2.2x and ECL’s 2.1x, better than SHW’s 3.1x and AKZOY’s 2.9x, and slightly better than AXTA’s 2.5x. Current ratio at 1.6 is adequate, and the 6.7% FCF margin is better than RPM’s 6.1% but below ECL’s 8.8% and SHW’s 10.3%. That combination explains part of PPG’s valuation discount to the premium names: investors are paying less because the balance sheet is safer than SHW’s, but the cash conversion is also less compelling than ECL’s.
Conclusion
I would put my rating as a Hold because the key tension is still unresolved: PPG has a durable coatings franchise, but the latest numbers do not yet show that the restructuring and pricing actions are turning into a stronger earnings run-rate. The company is profitable, the balance sheet is workable, and the market is not asking for a premium multiple, but I do not see enough evidence yet to call the stock cheap.
The bull case is straightforward. If organic sales growth stays in the low single digits through 2026 and the $175M annualized restructuring program starts to lift operating margin, I would become more constructive. A move in operating margin toward 15.5% would matter because it would show that pricing and cost actions are finally feeding through to earnings rather than just offsetting inflation. That would also improve free cash flow margin, which is the cleanest way for this thesis to re-rate.
The bear case is just as clear. If raw material inflation, foreign exchange, or softer industrial demand keep offsetting pricing, then the current 16.3x trailing P/E and 11.6x EV/EBITDA will look full rather than fair. I would move from Hold to Sell if operating margin slips below 13.0% for two consecutive quarters, meaning the cost program is not keeping pace with input pressure, or if net debt/EBITDA moves materially above 2.5x, which would mean the balance sheet is losing flexibility just as earnings quality weakens.
Weighing both sides, I lean to Hold because the upside case depends on margin repair that is visible but not yet proven, while the downside only needs a modest deterioration in cost or demand to show up quickly in earnings. That is why I would wait for better evidence before moving more positive.
What to Watch Next
- Operating margin toward 15.5% — would support a move more towards Buy.
- Free cash flow margin above 8.0% — would show better cash conversion.
- Net debt/EBITDA above 2.5x — would signal weaker balance-sheet flexibility.
- Organic sales growth staying in the low single digits — would confirm the base case.
- Two straight quarters below 13.0% operating margin — would support a move toward Sell.
What’s your take? I rated PPG Industries (PPG) HOLD above — but the goal here is to get this right, not just to publish an opinion. What would you add to this analysis, or which risk or catalyst do you think I’m under- or over-weighting? Tell me in the comments.
Sources
- SEC 10-K Annual Report — filed 2026-02-19
- SEC 8-K Filing (2026-04-28)
- SEC 8-K Filing (2026-04-28)
- SEC 8-K Filing (2026-04-21)
- SEC 8-K Filing (2026-04-15)
- SEC 8-K Filing (2026-01-27)
- SEC Form 4 Insider Transaction (2026-06-01)
- SEC Form 4 Insider Transaction (2026-06-01)
- SEC Form 4 Insider Transaction (2026-06-01)
- SEC 10-K Annual Report — FY2026
- SEC 10-K Annual Report — FY2025
- SEC 10-K Annual Report — FY2024
- SEC 10-K Annual Report — FY2023
- SEC 10-K Annual Report — FY2022
Data sourced from Yahoo Finance and SEC EDGAR. Not investment advice.
Leave a Comment