
| Company | Oct 25 | Nov 25 | Dec 25 | Jan 26 | Feb 26 | Mar 26 | Apr 26 | May 26 | Jun 26 | Jul 26 | Aug 26 | Sep 26 | 12-Mo |
|---|---|---|---|---|---|---|---|---|---|---|---|---|---|
| SYK | -4% | +4% | -5% | +5% | +5% | -15% | -4% | -3% | +3% | +3% | -1% | -15% | -25% |
| ZBH | +2% | -3% | -8% | -3% | +13% | -8% | -9% | -0% | +5% | +9% | +7% | -11% | -9% |
| BSX | +3% | +1% | -6% | -2% | -18% | -18% | -8% | -16% | -12% | +9% | +3% | -10% | -55% |
| SNN | +2% | -10% | -1% | +4% | +8% | -13% | -3% | -4% | -3% | +10% | -9% | -6% | -24% |
| ISRG | +19% | +7% | -1% | -11% | -0% | -8% | -1% | -7% | -6% | -11% | +7% | +8% | -9% |
| MDT | -5% | +16% | -8% | +7% | -5% | -11% | -7% | -9% | +7% | +9% | +6% | -4% | -6% |
Source: Yahoo Finance monthly adjusted close.
Quick Thesis
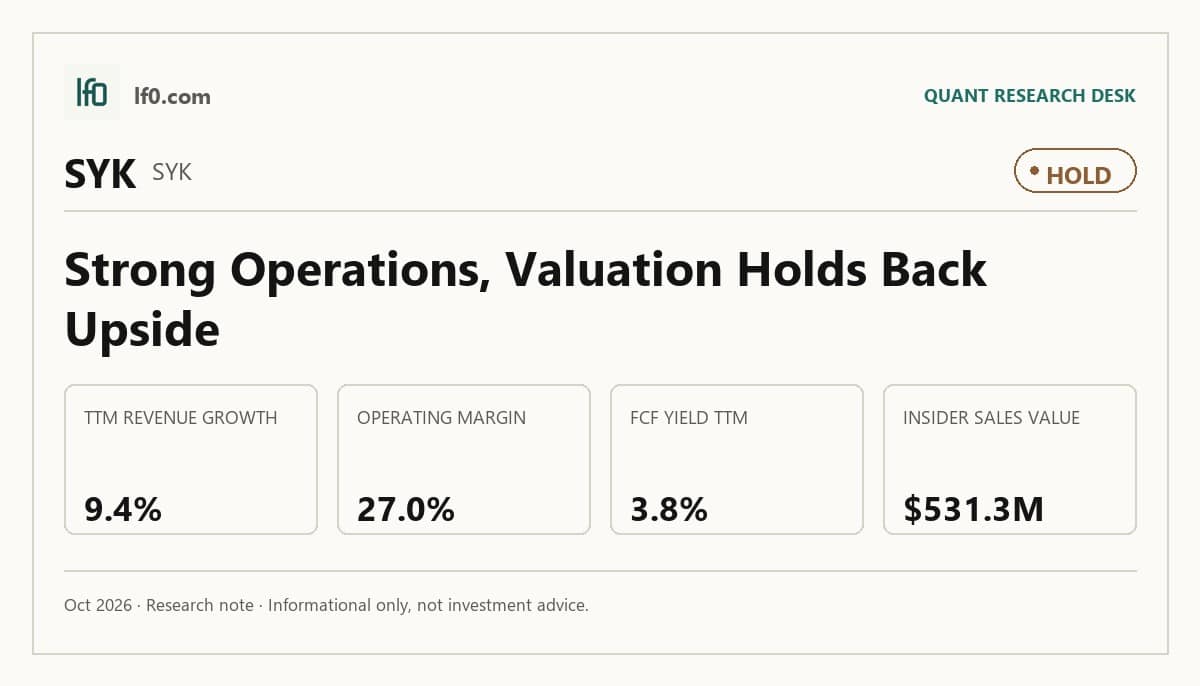
- Rated hold — strong margins and cash flow, but the stock already prices them in.
- TTM operating margin is 27.0%, with FCF margin at 15.9%.
- Main risk: execution, with $531.3M of insider selling and a March 2026 cyber incident.
- Valuation is fair to rich at 16.3x EV/EBITDA and 16.9x forward P/E.
- I would turn more constructive if Q3 2026 holds operating margin above 27.0%.
Executive Summary
Rating: HOLD | SYK
Measured from adjusted close on 2026-10-14 to 2026-10-14. Sell ratings are correct when the stock falls; Hold is tracked as a +/-10% range. Daily-close data, not intraday. Calls are tracked for 182 days from publication, then frozen as a final record.
I would put my rating as a hold because Stryker is still growing, but the current valuation already reflects a lot of that quality. Revenue grew 9.4% TTM to $25.8B, operating margin was 27.0%, and FCF margin was 15.9%, so the business is doing enough to justify a premium multiple without looking cheap. The issue is that the shares already trade at 16.3x EV/EBITDA and 16.9x forward P/E, which leaves less room for disappointment than the operating profile might suggest. I would become more constructive if the next quarter keeps operating margin above 27.0% and the cyber-related disruption does not show up in the numbers.
Company Profile
Stryker Corporation is a global medical technology company focused on MedSurg and Neurotechnology and Orthopaedics. It sells surgical equipment, endoscopy systems, patient handling and emergency care products, clinical communication tools, stroke and cranial surgery devices, and joint replacement and trauma implants to doctors, hospitals, and other healthcare facilities in about 61 countries. Founded by Dr. Homer H. Stryker in 1941 and incorporated in Michigan in 1946, the company has expanded through acquisitions, including Inari Medical in 2025, which broadened its vascular portfolio. As of December 31, 2025, it had about 56,000 employees and more than 45 countries of Mako SmartRobotics availability.
Economic Moat
Business Model
The Mako robotic-arm assisted technology platform is the clearest source of structural advantage in the business. In my view, the moat comes less from the robot itself than from the installed base, surgeon training, and procedure-specific software that make switching costly once a hospital standardizes on the system. Mako is now available in more than 45 countries, over one million robotic Mako Total Knee procedures and more than two million robotic procedures across Mako Total Knee, Mako Total Hip, and Mako Partial Knee have been performed worldwide, and the 2025 Mako 4 platform added Q-Guidance, which extends the system across more subspecialties.
That platform strength is reinforced by a broad commercial footprint and a deep patent base. Stryker owns approximately 5,600 U.S. patents and approximately 9,000 patents in other countries, and it sells directly to doctors, hospitals, and other healthcare facilities in approximately 61 countries. I think that combination matters because it supports local service intensity and makes the installed base harder to dislodge than a simple product sale would be.
Business & Operating Risks
The most material disclosed risk is supply chain and sole-source disruption. Stryker says it has experienced limited product availability due to an electronic component shortage and, in some cases, has been unable to meet demand because of supply chain challenges, which has already led to lost sales. Pricing pressure is the next issue: the company has reduced prices for certain products because of competition, and reimbursement pressure in markets such as China can force lower pricing or lower procedure volumes.
Acquisition integration is also a real risk, especially after the 2025 Inari deal and the company’s new global ERP rollout. Those two efforts raise execution risk at the same time, which means a stumble would likely hit margins before it would threaten the franchise itself. The disclosed risks are pressuring the moat at the margin, but they are not breaking the Mako-led structural advantage.
Management Discussion & Analysis
Management is still leaning into growth through acquisition, and that capital allocation choice is consistent with a company trying to widen its platform rather than de-risk the balance sheet. The 2025 acquisition spend of $5B was far larger than the $1.3B returned in dividends, while the February 2025 revolving credit agreement increased the facility to $3B and pushed maturity to February 25, 2030. That gives Stryker flexibility, but it also means the company is funding expansion before it is meaningfully deleveraging.
The operating results support that strategy. 2025 net sales grew 11.2% reported and 10.3% in constant currency excluding acquisitions and divestitures, with MedSurg and Neurotechnology up 15.7% and Orthopaedics up 4.3%. I read that as evidence that the acquisition-heavy model is still being layered onto real underlying demand, not masking a flat core. The same filing also shows higher selling, general and administrative expense as a share of sales, so the margin benefit from scale is not yet fully visible. Management is responding to the risks, but the cyber incident and integration burden mean the execution test is still live.
Recent Events
The most important recent event is the cybersecurity incident disclosed on March 12, 2026 and updated on March 23, 2026. Stryker said the event disrupted order processing, manufacturing, and shipping, which matters because even a short interruption can delay hospital deliveries and weaken customer confidence. The March 23 update was more reassuring in that the incident appeared contained and did not identify malicious activity directed at customers, suppliers, vendors, or partners, but the investigation was still ongoing.
The April 30, 2026 first-quarter earnings release shows the business was still functioning while the incident was being worked through, although I do not see evidence yet that the market has fully absorbed the operational risk. Governance was otherwise stable: shareholders re-elected all ten directors and ratified Ernst & Young LLP on May 6, 2026, and Stryker announced a planned accounting leadership transition on May 20, 2026. On balance, the recent events do not damage the moat, but they do remind me that operational reliability is part of the investment case.
Financial Analysis
Growth
SYK — Financial Growth (Quarterly, USD Mil)
| Metric | 2025-06-30 | 2025-09-30 | 2025-12-31 | 2026-03-31 | 2026-06-30 |
|---|---|---|---|---|---|
| REVENUE (USD Mil) | 6,022 | 6,057 | 7,171 | 6,020 | 6,589 |
| EBIT (USD Mil) | 1,175 | 1,208 | 1,873 | 998 | 1,705 |
| EBITDA (USD Mil) | 1,471 | 1,517 | 2,189 | 1,298 | 2,001 |
| NET INCOME (USD Mil) | 884 | 859 | 849 | 745 | 1,276 |
| DILUTED EPS | 2.3 | 2.2 | 2.2 | 1.9 | 3.3 |
Source: Yahoo Finance — Quarterly Financial Statements
Stryker’s revenue rose to $6.6B in Q2 2026 from $6B a year earlier, and EBITDA increased 36.1% to $2B from $1.5B. Net income climbed 48.6% to $1.3B, which tells me earnings are growing faster than sales and that the company is still getting operating leverage from its mix. The quarter-to-quarter swing is normal for a medtech business, so I would not overread the Q1-to-Q2 move by itself.
Profitability
SYK — Profitability (TTM)
| Metric | TTM |
|---|---|
| Operating Margin (TTM) | 27.0% |
| Net Margin (TTM) | 14.4% |
| Return on Assets (TTM) | 8.2% |
| Return on Equity (TTM) | 16.5% |
| Gross Margin (TTM) | 65.6% |
| EBITDA Margin (TTM) | 28.5% |
Source: Yahoo Finance — Trailing Twelve Months (TTM)
TTM operating margin was 27.0%, gross margin was 65.6%, and EBITDA margin was 28.5%, which leaves a wide spread between gross profit and operating profit. That spread says Stryker is already a high-quality business, but it still carries a meaningful operating expense base, so I would watch whether scale keeps pushing operating margin higher. Net margin was 14.4%, ROA was 8.16%, and ROE was 16.5%, which is a strong return profile for a medtech name and consistent with the moat described above.
Valuation
SYK — Valuation Multiples
| Metric | Value |
|---|---|
| Current Share Price (USD) | 282.5 |
| Market Cap (USD Mil) | 108,379 |
| Enterprise Value (USD Mil) | 120,349 |
| Trailing P/E | 29.3 |
| Forward P/E | 16.9 |
| Price/Sales (TTM) | 4.2 |
| Price/Book (mrq) | 4.5 |
| EV/Revenue | 4.7 |
| EV/EBITDA | 16.3 |
| Beta (5Y Monthly) | 0.78 |
| FCF Yield % (TTM) | 3.8% |
| Forward EPS (USD) | 16.7 |
| Analyst Target Price – Low (USD) | 298 |
| Analyst Target Price – Mean (USD) | 362.6 |
| Analyst Target Price – High (USD) | 465 |
| # Analyst Opinions | 26 |
Source: Yahoo Finance
Stryker trades at 4.7x EV/Revenue, 16.3x EV/EBITDA, 29.3x trailing P/E, and 16.9x forward P/E, with a 3.8% FCF yield. That is not a bargain, but it is also not an extreme multiple for a company with 27.0% operating margin and 15.9% FCF margin. With 26 analyst opinions, the target range of $298 to $465 and mean of $362.6 gives me a useful consensus band, and my own read sits inside it rather than below it.
On the analysis here, I would put fair value in a range of roughly $300–$360 per share. That range is close to the analyst mean because I give more weight to the company’s margin durability and cash conversion than to the market’s willingness to pay for growth alone. Forward EPS is $16.7, which is solid relative to ZBH, BSX, SNN, and MDT in the peer set, but not enough to justify an open-ended premium. In my view, the stock is priced for continued execution, not for a step-change in growth.
Leverage
SYK — Leverage & Coverage (Quarterly)
| Metric | Value |
|---|---|
| Total Debt/Equity % (mrq) | 64.4 |
| Current Ratio (mrq) | 2.2 |
| Total Debt (mrq, USD Mil) | 15,446 |
| Operating Cash Flow (TTM, USD Mil) | 5,525 |
| Levered Free Cash Flow (TTM, USD Mil) | 4,108.9 |
| Net Debt/EBITDA (TTM) | 1.6 |
| FCF Margin % (TTM) | 15.9% |
Source: Yahoo Finance — Quarterly Financial Statements
Stryker’s leverage is manageable rather than stretched. Total debt/equity was 64.4%, current ratio was 2.2x, and total debt was $15.4B, while total cash was $3.5B. Net debt/EBITDA was 1.6x, which leaves room to absorb a softer quarter without immediate balance-sheet pressure.
Cash generation is the more important point. Operating cash flow was $5.5B and levered free cash flow was $4.1B, so earnings are converting into real cash rather than being absorbed by capex or interest. FCF margin of 15.9% is healthy for a company still doing acquisitions, and that is why I do not see leverage as the main bear case.
Insider Activity
The insider record is one-sided: 55 open-market sales for $531.3M and no open-market purchases over the period shown. The selling is broad enough to include both a director and an executive, but it is still concentrated in a few recent clusters rather than a steady stream across many insiders. I read that as a weak alignment signal, not a panic signal, but it does not help the stock.
Comparable Analysis
LF0 has published standalone analyses of these peers: Boston Scientific (BSX) (rated Buy); Intuitive Surgical (ISRG) (rated Hold).
Growth
| Company | Revenue TTM (USD Mil) | Revenue Growth YoY % | EBITDA TTM (USD Mil) | Diluted EPS TTM |
|---|---|---|---|---|
| SYK | 25,837 | 9.4% | 7,376 | 9.7 |
| ZBH | 8,508.8 | 4.8% | 2,525 | 4.1 |
| BSX | 20,996 | 7.5% | 5,711 | 2.5 |
| SNN | 6,300 | 4.6% | 1,382 | 1.5 |
| ISRG | 11,034.4 | 18.5% | 4,180.8 | 8.7 |
| MDT | 37,542 | 13.7% | 10,408 | 4.1 |
Source: Yahoo Finance
Stryker’s 9.4% revenue growth TTM is ahead of ZBH at 4.8% and SNN at 4.6%, while trailing BSX at 7.5% and MDT at 13.7% but still behind ISRG at 18.5%. That puts SYK in the upper half of the group, which supports a premium multiple, but not one that should be stretched to ISRG levels.
Valuation
| Company | Current Share Price (USD) | Trailing P/E | Forward P/E | EV/Revenue | EV/EBITDA | Price/Sales (TTM) | Price/Book (mrq) | Market Cap (USD Mil) | Enterprise Value (USD Mil) | Beta (5Y Monthly) | FCF Yield % (TTM) | Forward EPS | Analyst Target Price – Low | Analyst Target Price – Mean | Analyst Target Price – High | # Analyst Opinions |
|---|---|---|---|---|---|---|---|---|---|---|---|---|---|---|---|---|
| SYK | 282.5 | 29.3 | 16.9 | 4.7 | 16.3 | 4.2 | 4.5 | 108,379 | 120,349 | 0.78 | 3.8% | 16.7 | 298 | 362.6 | 465 | 26 |
| ZBH | 92.1 | 22.3 | 10.2 | 2.9 | 9.8 | 2.1 | 1.4 | 17,563 | 24,709 | 0.48 | 6.1% | 9.1 | 93 | 106.8 | 130 | 22 |
| BSX | 43.3 | 17.5 | 12.8 | 3.6 | 13.1 | 3 | 2.5 | 62,766 | 75,093 | 0.57 | 3.9% | 3.4 | 44 | 59.6 | 94 | 29 |
| SNN | 27.9 | 19 | 11.6 | 2.3 | 10.6 | 1.9 | 11.4 | 11,660 | 14,691 | 0.67 | 9.1% | 2.4 | 29 | 32.3 | 38 | 5 |
| ISRG | 422.1 | 48.4 | 34.9 | 13.1 | 34.4 | 13.5 | 8.2 | 149,105 | 144,018 | 1.46 | 1.8% | 12.1 | 324 | 478.1 | 685 | 30 |
| MDT | 93 | 22.9 | 14.5 | 3.7 | 13.3 | 3.2 | 2.4 | 118,973 | 138,925 | 0.57 | 4.5% | 6.4 | 85 | 104.4 | 121 | 25 |
Source: Yahoo Finance
SYK trades at 4.7x EV/Revenue, 16.3x EV/EBITDA, and 29.3x trailing P/E, versus ZBH at 2.9x, 9.8x, and 22.3x, BSX at 3.6x, 13.1x, and 17.5x, SNN at 2.3x, 10.6x, and 19.0x, ISRG at 13.1x, 34.4x, and 48.4x, and MDT at 3.7x, 13.3x, and 22.9x. I think the market is paying for SYK’s stronger growth and better operating returns, but the premium is not cheap because its 3.8% FCF yield trails ZBH and SNN. A $1 investment a year ago would be worth $0.78 in SYK, versus $0.98 in ZBH, $0.46 in BSX, $0.81 in SNN, $0.97 in ISRG, and $1.01 in MDT, so the shares have lagged the fundamentals more than the peer set.
Profitability
| Company | Operating Margin (TTM) | Net Margin (TTM) | Return on Assets (TTM) | Return on Equity (TTM) | Gross Margin (TTM) | EBITDA Margin (TTM) |
|---|---|---|---|---|---|---|
| SYK | 27.0% | 14.4% | 8.2% | 16.5% | 65.6% | 28.5% |
| ZBH | 18.0% | 9.5% | 3.9% | 6.4% | 69.5% | 29.7% |
| BSX | 22.9% | 17.5% | 6.2% | 15.3% | 69.2% | 27.2% |
| SNN | 14.5% | 10.1% | 5.2% | 11.9% | 68.4% | 21.9% |
| ISRG | 33.6% | 28.4% | 10.5% | 17.4% | 66.7% | 37.9% |
| MDT | 19.3% | 13.9% | 5.1% | 10.6% | 65.3% | 27.7% |
Source: Yahoo Finance
SYK’s operating margin of 27.0% is above ZBH at 18.0%, BSX at 22.9%, SNN at 14.5%, and MDT at 19.3%, which points to better operating leverage rather than a pure cost-of-revenue advantage. Gross margin of 65.6% is solid but not best-in-class, while ROE of 16.5% and ROA of 8.2% are both stronger than most peers. ISRG still leads on ROA at 10.5% and ROE at 17.4%, so SYK is high quality, but not the most capital-efficient name in the group.
Leverage
| Company | Total Debt/Equity % (mrq) | Current Ratio (mrq) | Total Debt (mrq, USD Mil) | Operating Cash Flow TTM (USD Mil) | Free Cash Flow TTM (USD Mil) | Net Debt/EBITDA (TTM) | FCF Margin % (TTM) |
|---|---|---|---|---|---|---|---|
| SYK | 64.4 | 2.2 | 15,446 | 5,525 | 4,108.9 | 1.6 | 15.9% |
| ZBH | 60.2 | 1.7 | 7,601.7 | 1,743.3 | 1,072.2 | 2.8 | 12.6% |
| BSX | 50.2 | 1.2 | 12,624 | 4,529 | 2,451.4 | 2.1 | 11.7% |
| SNN | 73.1 | 2.1 | 3,785 | 1,339 | 1,059 | 2.2 | 16.8% |
| ISRG | — | 5 | 0 | 3,706.4 | 2,615.2 | -1.2 | 23.7% |
| MDT | 55.4 | 2.1 | 28,153 | 8,035 | 5,412.5 | 1.9 | 14.4% |
Source: Yahoo Finance
SYK’s net debt/EBITDA of 1.6x is moderate versus ZBH at 2.8x, BSX at 2.1x, SNN at 2.2x, and MDT at 1.9x, while ISRG sits in net cash territory. Current ratio of 2.2x is also healthy, and FCF margin of 15.9% is better than ZBH, BSX, and MDT, though below ISRG’s 23.7%. That combination tells me SYK’s balance sheet is not the reason to own the stock, but it also is not the reason to avoid it.
Conclusion
I would put my rating as a hold because Stryker’s operating quality is strong, but the shares already reflect a lot of that quality. The key tension is that the business is still compounding revenue at 9.4% TTM with a 27.0% operating margin and 15.9% FCF margin, yet the stock trades at 16.3x EV/EBITDA and 16.9x forward P/E, so the market is paying up for continued execution.
I would raise my rating more toward a buy if the next quarter keeps operating margin above 27.0%, meaning the company is turning growth into more profit rather than just buying growth with expense. I would also become more constructive if FCF margin moves toward 17% to 18%, because that would show the cash conversion profile is still improving and would make the current premium easier to defend. If Mako volume keeps expanding and the Inari integration continues without margin slippage, the premium multiple would look increasingly earned.
I would move from hold toward sell if revenue growth slips below 7% for two consecutive quarters, because that would suggest the platform mix is no longer offsetting pricing pressure and acquisition digestion. I would also turn more cautious if net debt/EBITDA rises above 2.0x, since that would mean acquisitions are outrunning cash generation and the current 1.6x level would no longer look comfortably conservative. Another warning sign would be another quarter of broad insider selling without offsetting open-market buying.
Weighing both paths, I lean to the cautious side because the stock already discounts a good deal of the operating strength. The numbers still support the franchise, but I would want to see either better cash conversion or a lower entry point before moving off hold.
What to Watch Next
- Operating margin above 27.0% — would support a move toward Buy.
- FCF margin near 17% to 18% — would strengthen the cash conversion case.
- Revenue growth below 7% for two quarters — would argue for a weaker rating.
- Net debt/EBITDA above 2.0x — would make leverage less comfortable.
- Another quarter of insider selling without buying — would keep the alignment signal weak.
What’s your take? I rated Stryker (SYK) HOLD above — but the goal here is to get this right, not just to publish an opinion. What would you add to this analysis, or which risk or catalyst do you think I’m under- or over-weighting? Tell me in the comments.
Sources
- SEC 10-K Annual Report — filed 2026-02-11
- SEC 8-K Filing (2026-05-20)
- SEC 8-K Filing (2026-05-08)
- SEC 8-K Filing (2026-04-30)
- SEC 8-K Filing (2026-03-23)
- SEC 8-K Filing (2026-03-12)
- SEC 8-K Filing (2026-03-11)
- SEC Form 4 Insider Transaction (2026-06-02)
- SEC Form 4 Insider Transaction (2026-05-29)
- SEC Form 4 Insider Transaction (2026-05-28)
- SEC 10-K Annual Report — FY2026
- SEC 10-K Annual Report — FY2025
- SEC 10-K Annual Report — FY2024
- SEC 10-K Annual Report — FY2023
- SEC 10-K Annual Report — FY2022
Data sourced from Yahoo Finance and SEC EDGAR. Not investment advice.
Leave a Comment