Expected price range
Each range is set from the stock’s recent price history and our Sell rating, using its own 1-year realised volatility (95% annualised) as the width of a ~68% statistical band, and checked against that rating so the range leans the same way as our view. Starting price $6.57 (close 2026-11-10). The stock traded between $5.68 and $18.81 over the last 6 months and between $5.68 and $18.81 over the last year. This is an illustration of where our view and normal volatility point, not a forecast, price target or investment advice; the stock can move outside it.
| Company | Nov 25 | Dec 25 | Jan 26 | Feb 26 | Mar 26 | Apr 26 | May 26 | Jun 26 | Jul 26 | Aug 26 | Sep 26 | Oct 26 | 12-Mo |
|---|---|---|---|---|---|---|---|---|---|---|---|---|---|
| CLSK | -15% | -33% | +17% | -16% | -14% | +47% | +46% | -20% | -5% | -16% | +11% | -40% | -57% |
| MARA | -35% | -24% | +6% | -6% | -9% | +47% | +20% | -3% | -19% | -5% | +5% | -40% | -63% |
| RIOT | -18% | -21% | +22% | +5% | -24% | +39% | +57% | +1% | -26% | -6% | +6% | -36% | -35% |
| HUT | -11% | +2% | +22% | -5% | -12% | +62% | +65% | -8% | -7% | -27% | +9% | -31% | +17% |
| IREN | -21% | -21% | +42% | -24% | -16% | +33% | +40% | -28% | -20% | +1% | +10% | -41% | -61% |
| BTDR | -40% | -16% | +16% | -41% | +12% | +31% | +55% | -9% | -34% | +3% | -3% | -36% | -70% |
Source: Yahoo Finance monthly adjusted close.
<a id="lf0-thesis"></a>
Quick Thesis
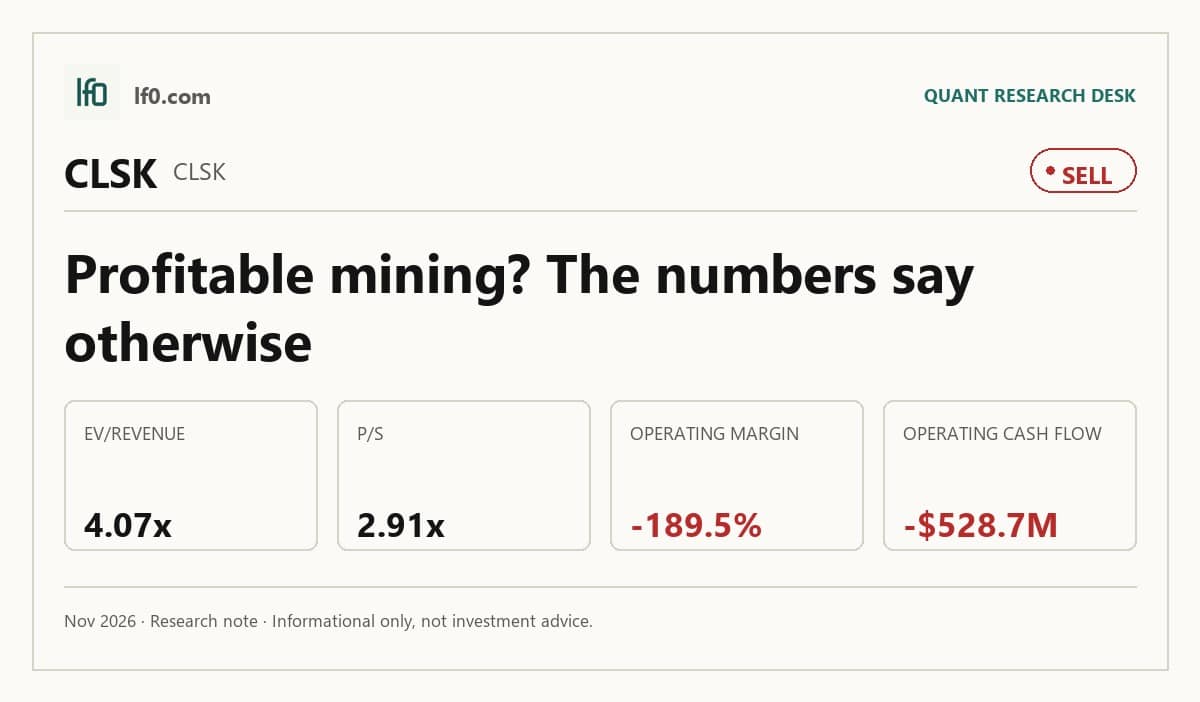
- Rated Sell — the stock still prices in a recovery the numbers do not yet support.
- Strongest point: liquidity, with a <span class="lf0-key" data-src="Yahoo Finance — Key Statistics (Balance Sheet): Current Ratio (mrq)">5.9x</span> current ratio and <span class="lf0-key" data-src="Yahoo Finance — Key Statistics (Cash Flow Statement): Total Cash (mrq, USD Mil)">$202.6M</span> of cash.
- Biggest risk: <span class="lf0-key" data-src="Yahoo Finance — Key Statistics (Balance Sheet): Total Debt (mrq)">$1.8B</span> of debt against <span class="lf0-key" data-src="Yahoo Finance — Key Statistics (Cash Flow Statement): Operating Cash Flow (TTM)">-$528.7M</span> of TTM operating cash flow.
- Valuation is rich versus peers at <span class="lf0-key" data-src="Yahoo Finance — Key Statistics: EV/Revenue">4.1x</span> EV/revenue and <span class="lf0-key" data-src="Yahoo Finance — Key Statistics: Price/Sales (TTM)">2.9x</span> price/sales.
- I would move higher only if quarterly revenue stays above <span class="lf0-key" data-src="Yahoo Finance — Quarterly Income Statement: Total Revenue (2025-12-31)">$180M</span> and margins improve.
<a id="lf0-summary"></a>
Executive Summary
We’ll begin tracking this call’s performance since publication once sufficient adjusted-close data is available.
I would put my rating as a Sell because CleanSpark has scale, but it still has not converted that scale into durable earnings or cash generation. Revenue was $138M in Q2 2026, yet TTM operating margin was -189.5% and operating cash flow was <span class="lf0-key" data-src="Yahoo Finance — Key Statistics (Cash Flow Statement): Operating Cash Flow (TTM)">-$528.7M</span>, so the business is still burning cash even after the latest buildout.
I would move from Sell toward Hold only if revenue can hold above <span class="lf0-key" data-src="Yahoo Finance — Quarterly Income Statement: Total Revenue (2025-12-31)">$180M</span> for two consecutive quarters, because that would show the fleet is supporting a higher run rate rather than a brief rebound. Until then, I think the market is paying for a recovery that has not yet shown up in the cash flow.
<a id="lf0-business"></a>
Company Profile
CleanSpark, Inc. was incorporated in 1987, changed its name from Stratean Inc. in November 2016, and has operated in bitcoin mining since December 2020. The company owns and operates data centers in Georgia, Tennessee, Mississippi, and Wyoming, with 676 MW of developed capacity as of October 31, 2024 and 211.5 MW under development, which it expects to support about 50 EH/s. As of September 30, 2024, it operated about 188,500 miners and had 27.6 EH/s of capacity. It also had 50 MW of hosted machines in New York, but that Coinmint, LLC hosting agreement is scheduled to expire on January 1, 2025, after which CleanSpark plans to move all capacity to wholly owned sites. The company is incorporated in Nevada, headquartered in Henderson, and listed on Nasdaq under CLSK.
Economic Moat
Business Model
The clearest structural edge here is ownership and control of a large U.S. mining footprint. In my view, that is hard for a well-funded competitor to copy quickly because it depends on site control, power access, and operating know-how rather than a single purchasable asset. CleanSpark’s 676 MW of developed capacity, plus 211.5 MW under development, supports roughly 31.5 EH/s today and about 50 EH/s when the buildout is complete. That scale matters because bitcoin mining is a hashrate race, so more owned capacity should translate into a larger share of network rewards if execution holds.
I also see a secondary advantage in fleet efficiency and uptime management. CleanSpark operated about 188,500 machines at 21.94 J/TH as of September 30, 2024, and moving away from hosted capacity after the Coinmint agreement expires should leave more of the fleet on wholly owned sites. That improves operating control, which is important in a business where power cost and uptime directly affect output.
Business & Operating Risks
The biggest disclosed risk is bitcoin price exposure, and it already shows up in the numbers. CleanSpark’s ability to achieve profitability depends on bitcoin, and the filing says the market price ranged from about $26,500 to $73,800 during fiscal 2024. That wide band means revenue and margin can swing sharply even if operating execution is unchanged, so the equity remains a direct bet on bitcoin rather than a stable mining cash flow stream.
A second risk is funding and dilution. CleanSpark says it may require additional financing to sustain and expand operations, and it has previously raised capital through public offerings and at-the-market sales. That is a direct drag on per-share value if bitcoin prices weaken or expansion costs rise faster than expected. The company also relies on named miner suppliers, so any disruption in equipment delivery could slow expansion just as power constraints or curtailments can hit output.
The disclosed risks do threaten the moat, but they do not break it. They mainly pressure the economics of the owned-site advantage by making expansion capital intensive and earnings volatile.
Management Discussion & Analysis
Management is responding to those risks by pushing scale and tightening control of the fleet, not by retreating. CleanSpark ended fiscal 2024 with 27.6 EH/s of operating hashrate and 31.5 EH/s as of October 31, 2024, while it was still finalizing 54 MW in Wyoming and 16.5 MW in Mississippi and had just closed the GRIID acquisition on October 30, 2024. That tells me management is still buying and building capacity to raise hashrate, which supports revenue growth, but it also means capital is still being directed into expansion while the company is absorbing a large operating loss.
The fleet refresh is real, not cosmetic. CleanSpark reduced miner useful lives from 5 years to 3 years effective May 1, 2024 and recorded $197M of fixed asset impairment in fiscal 2024, which signals management is willing to take a near-term accounting hit to improve efficiency and keep the fleet competitive. The financing mix is equally telling: the company raised $1.2B through at-the-market equity in fiscal 2024 and added $50M under its Coinbase credit facility, so dilution and external financing remain part of the model rather than a self-funding operating profile.
Recent Events
The most important recent event is the $650M 0.00% Convertible Senior Notes due 2030 that closed on December 17, 2024. CleanSpark used about $145M to repurchase stock and about $90.4M to fund capped calls, while the rest supports the $50M Coinbase line, capex, and potential acquisitions. That strengthens liquidity, but it also adds a large convertible overhang, so the thesis now depends more on execution than on balance-sheet conservatism.
The December 12, 2024 announcement of the offering, followed by the December 13 pricing update, shows management was willing to move quickly to lock in long-dated capital on favorable terms. The capped call overlay matters because it softens dilution if the stock is converted, which helps equity holders if the share price stays above the $14.80 conversion price. The trade-off is that the company has added another layer of capital structure complexity.
The November 15, 2024 8-K on the GRIID warrant error and Nasdaq trading halt is a separate negative signal. It was corrected, and the common stock halt was lifted on November 11, 2024, but the episode exposed disclosure and listing-process slippage around the October 30 acquisition. Recent events are mixed, yet I think the financing and acquisition disclosures leave the moat thesis intact while making execution scrutiny more important.
Financial Analysis
LF0 has published standalone analyses of these peers: MARA Holdings (MARA) (rated Sell); Hut 8 (HUT) (HUT) (rated Sell).
<a id="lf0-growth"></a>
Growth
CLSK — Financial Growth (Quarterly, USD Mil)
| Metric | 2025-03-31 | 2025-06-30 | 2025-09-30 | 2025-12-31 | 2026-03-31 | 2026-06-30 |
|---|---|---|---|---|---|---|
| REVENUE (USD Mil) | — | 198.6 | 223.7 | 181.2 | 136.4 | 138 |
| EBIT (USD Mil) | — | 279 | 19 | -406.4 | -386.2 | -240.8 |
| EBITDA (USD Mil) | — | 373.8 | 127.3 | -300.1 | -270.3 | -129.7 |
| NET INCOME (USD Mil) | — | 257.4 | -0.9 | -378.7 | -378.3 | -239.8 |
| DILUTED EPS | -0.5 | 0.8 | — | -1.4 | -1.5 | -0.9 |
Source: Yahoo Finance — Quarterly Financial Statements
Revenue rose from $136.4M in Q1 2026 to $138M in Q2 2026, a 1.2% sequential increase, but that follows a much larger drop from $223.7M in Q3 2025 to $181.2M in Q4 2025 and then to $136.4M in Q1 2026. EBITDA improved to -$129.7M in Q2 2026 from -$270M in Q1 2026, while net income improved to -$239.8M from -$378M, so the latest quarter shows cost absorption improving faster than sales. I read that as a sign that operating leverage can work here, but only if bitcoin economics stay supportive long enough for the fleet to run through the fixed-cost base.
Growth versus peers
| Company | Revenue TTM (USD Mil) | Revenue Growth YoY % | Diluted EPS TTM |
|---|---|---|---|
| <span class="lf0-primary">CLSK</span> | 679.2 | -30.5% | -3.8 |
| MARA | 716 | -34.9% | -8.1 |
| RIOT | 675.7 | 0.7% | -4.1 |
| HUT | 305.5 | -14.9% | -4.7 |
| IREN | 695 | -5.0% | -4.1 |
| BTDR | 963.3 | 89.0% | -2.6 |
Source: Yahoo Finance
CLSK’s revenue fell 30.5% in TTM, which is better than MARA’s 34.9% decline and worse than IREN’s 5.0% decline and BTDR’s 89.0% growth. That puts CLSK in the middle of the pack on top-line pressure, but not in the group that is clearly compounding. The earnings base is still weak too, with diluted EPS of -3.8, so the market is paying for a recovery that is not yet visible in the numbers.
<a id="lf0-profitability"></a>
Profitability
TTM operating margin was -189.5%, net margin was -146.9%, ROA was -27.7%, and ROE was -68.6%. Those figures show a business still far from durable profitability, with losses large enough that each dollar of revenue is not yet covering operating structure, financing, and asset base costs. The gap between operating and net margin is narrower than the absolute losses suggest, which means the problem is not just below-the-line items; the core operating model is still deeply unprofitable.
The margin profile also explains why the owned-site moat has not yet translated into equity returns. A larger fleet only helps if it can absorb fixed costs, and the current margin structure says that has not happened yet. I would watch for operating margin moving materially closer to zero first, because that would be the clearest sign the business is moving toward profitability.
Profitability versus peers
| Company | Operating Margin (TTM) | Net Margin (TTM) | Return on Assets (TTM) | Return on Equity (TTM) |
|---|---|---|---|---|
| <span class="lf0-primary">CLSK</span> | -189.5% | -146.9% | -27.7% | -68.6% |
| MARA | -335.5% | 0.0% | -20.2% | -77.4% |
| RIOT | -193.9% | -210.8% | -21.8% | -50.5% |
| HUT | -229.9% | -169.8% | -6.7% | -30.3% |
| IREN | -72.9% | -194.3% | -2.5% | -33.8% |
| BTDR | 12.4% | -33.6% | 2.4% | -40.1% |
Source: Yahoo Finance
CLSK’s operating margin of -189.5% and net margin of -146.9% are worse than BTDR’s 12.4% operating margin and -33.6% net margin, and they are far from the more efficient end of the peer set. ROA at -27.7% and ROE at -68.6% also trail the better names, which tells me the asset base is not yet earning its keep. The profitability gap is broad enough that I do not see a quality premium here.
<a id="lf0-valuation"></a>
Valuation
CLSK trades at <span class="lf0-key" data-src="Yahoo Finance — Key Statistics: EV/Revenue">4.1x</span> EV/revenue and <span class="lf0-key" data-src="Yahoo Finance — Key Statistics: Price/Sales (TTM)">2.9x</span> price/sales on a current share price of $6.57, which is the right lens because trailing earnings are not usable here. That multiple implies the market is paying for a large step-up in mining economics and data-center utilization, not for current profitability, since forward EPS is -$1.75 and the trailing P/E is not meaningful. The stock also sits at 2.33x price/book, so investors are paying more than twice stated book value for a business whose book value per share is $2.965 and whose cash per share is $0.789.
On the analysis here, I would put fair value in a range of about $3.4-$8.2 per share using the peer EV/revenue band already discussed in this article. That range sits below the $20.9 analyst mean target and even below the $9.5 low target, which tells me consensus is assuming a much stronger operating recovery than I am. With 15 analyst opinions, there is a real consensus to compare against, and my range sits below it because I weight the current cash burn and negative margins more heavily than the market appears to.
I also think the EPS setup is weak relative to peers. CLSK’s forward EPS of -$1.75 is still worse than RIOT’s -$1 and far below BTDR’s -$0.4, so the company is not yet showing the earnings inflection that would justify a premium multiple on a like-for-like basis. That is why the valuation still looks stretched even after adjusting for the scale of the mining buildout.
Valuation versus peers
| Company | Current Share Price (USD) | Forward P/E | EV/Revenue | EV/EBITDA | Price/Sales (TTM) | Price/Book (mrq) | Market Cap (USD Mil) | Enterprise Value (USD Mil) | Beta (5Y Monthly) | Forward EPS | Analyst Target Price – Low | Analyst Target Price – Mean | Analyst Target Price – High | # Analyst Opinions |
|---|---|---|---|---|---|---|---|---|---|---|---|---|---|---|
| <span class="lf0-primary">CLSK</span> | 6.6 | 30.5 | 4.1 | — | 2.9 | 2.3 | 1,687 | 2,680 | 3.65 | -1.8 | 9.5 | 20.9 | 27 | 15 |
| MARA | 7.3 | — | 5.7 | — | 3.1 | 1.5 | 2,844 | 4,977 | 5.25 | -0.3 | 10 | 16.9 | 27 | 13 |
| RIOT | 18.1 | — | 9.8 | — | 9.2 | 3.1 | 6,787 | 6,808 | 3.98 | -1 | 19 | 31.6 | 50 | 22 |
| HUT | 56.8 | 138.9 | 46.9 | — | 21.4 | 4.4 | 6,815 | 14,319 | 6.08 | -5.6 | 75 | 128.5 | 245 | 23 |
| IREN | 19.7 | — | 22.7 | — | 10.7 | 1.8 | 8,368 | 15,061 | 4.33 | 0.3 | 23 | 56.7 | 139 | 19 |
| BTDR | 6.4 | 5.5 | 3.8 | 15.2 | 1.8 | 1.7 | 1,742 | 3,650 | 2.72 | -0.4 | 8 | 21.2 | 35 | 14 |
Source: Yahoo Finance
CLSK trades at <span class="lf0-key" data-src="Yahoo Finance — Key Statistics: EV/Revenue">4.1x</span> EV/revenue and <span class="lf0-key" data-src="Yahoo Finance — Key Statistics: Price/Sales (TTM)">2.9x</span> price/sales, below MARA’s 5.7x EV/revenue and 3.1x price/sales, but above BTDR’s 3.8x EV/revenue and 1.8x price/sales. On an illustrative peer-multiple basis, applying the 3.8x to 5.7x EV/revenue range to CLSK’s $679.2M TTM revenue gives an enterprise value of about $2.6B to $3.9B, or roughly $3.4-$8.2 per share after netting debt and cash and dividing by 256.8M shares. That range brackets the current share price, so the stock is not obviously cheap on peers alone.
I also think the valuation premium is harder to justify when paired with the leverage profile. CLSK’s debt/equity is 234.7%, while RIOT’s is 32.3%, so investors are not just paying for growth; they are also accepting a much heavier balance-sheet load than some peers. That makes the multiple look less attractive on a growth-adjusted basis than the headline number suggests.
<a id="lf0-leverage"></a>
Leverage
Total debt was <span class="lf0-key" data-src="Yahoo Finance — Key Statistics (Balance Sheet): Total Debt (mrq)">$1.8B</span>, and total debt to equity was 234.7%, which tells me leverage is high for a business with volatile earnings. The current ratio was <span class="lf0-key" data-src="Yahoo Finance — Key Statistics (Balance Sheet): Current Ratio (mrq)">5.9x</span>, so near-term liquidity is comfortable even after the debt load. Operating cash flow was <span class="lf0-key" data-src="Yahoo Finance — Key Statistics (Cash Flow Statement): Operating Cash Flow (TTM)">-$528.7M</span> TTM, while levered free cash flow was $48.9M, which means EBITDA is not translating cleanly into cash because working capital, capex, or financing costs are absorbing it.
That mix matters because the balance sheet is not yet self-funding. The current ratio gives the company room today, but negative operating cash flow means that cushion can erode quickly if bitcoin economics weaken or if a refinancing window opens before cash generation stabilizes. In my view, this is a bear signal because liquidity exists, but it is still being financed rather than organically produced.
Leverage versus peers
| Company | Total Debt/Equity % (mrq) | Current Ratio (mrq) | Total Debt (mrq, USD Mil) | Operating Cash Flow TTM (USD Mil) | Free Cash Flow TTM (USD Mil) |
|---|---|---|---|---|---|
| <span class="lf0-primary">CLSK</span> | 234.7 | 5.9 | 1,786.9 | -528.7 | 48.9 |
| MARA | 125.7 | 2.3 | 3,079.8 | -867.5 | -1,039.6 |
| RIOT | 32.3 | 3.5 | 689.7 | -592.6 | -754.8 |
| HUT | 396.9 | 9.5 | 7,661 | -62.4 | -8,094.4 |
| IREN | 199.7 | 1.6 | 10,215 | 2,487.4 | -8,780.9 |
| BTDR | 198.9 | 0.8 | 2,075.6 | -1,095.7 | -591 |
Source: Yahoo Finance
CLSK’s debt/equity of 234.7% is higher than RIOT’s 32.3% and MARA’s 125.7%, while operating cash flow is <span class="lf0-key" data-src="Yahoo Finance — Key Statistics (Cash Flow Statement): Operating Cash Flow (TTM)">-$528.7M</span> TTM and free cash flow is $48.9M TTM. That is less fragile than HUT’s 396.9% debt/equity and -$8.1B free cash flow, but it still leaves CLSK more exposed than RIOT or MARA if capital markets tighten. The current ratio of <span class="lf0-key" data-src="Yahoo Finance — Key Statistics (Balance Sheet): Current Ratio (mrq)">5.9x</span> helps, yet it does not change the fact that the company is still leaning on liquidity rather than self-funding operations.
<a id="lf0-insiders"></a>
Insider Activity
The insider transaction record I see here is one-sided selling only, with 6 open-market sales and 0 open-market purchases over the 2025-02-13 to 2026-05-14 window. The pattern is concentrated in the CEO and several senior executives, so it is broader than a single isolated sale, but the sample is still limited. I read that as a mild negative, not a thesis breaker, because it adds to the list of signals that management is not leaning in with open-market buying.
<a id="lf0-conclusion"></a>
Conclusion
I would put my rating as a Sell because CleanSpark’s owned-site strategy is real, but the numbers still show a business that has not yet turned scale into durable cash generation. The tension is simple: revenue is stabilizing at a higher level, yet TTM operating margin is still -189.5% and operating cash flow is <span class="lf0-key" data-src="Yahoo Finance — Key Statistics (Cash Flow Statement): Operating Cash Flow (TTM)">-$528.7M</span>, so the recovery is not showing up in the parts of the model that matter most.
I would move from Sell toward Hold if quarterly revenue can stay above <span class="lf0-key" data-src="Yahoo Finance — Quarterly Income Statement: Total Revenue (2025-12-31)">$180M</span> for two consecutive quarters and operating margin moves materially closer to zero. That would tell me the fleet is doing more than just tracking bitcoin prices; it would show the buildout is starting to convert into a more durable earnings base. If that happens, the current leverage profile becomes more manageable because the company would be funding more of its growth internally.
The bear case is stronger if revenue slips back below $130M in a quarter, because that would suggest the latest rebound was mostly price-driven rather than a lasting operating gain. In that scenario, the company would still be carrying <span class="lf0-key" data-src="Yahoo Finance — Key Statistics (Balance Sheet): Total Debt (mrq)">$1.8B</span> of debt and a 234.7% debt-to-equity ratio, so any renewed cash burn would keep dilution and refinancing risk in the foreground.
Weighing both sides, I think the bear case is more likely to show up first. The owned infrastructure is a real advantage, but until the company proves that higher hashrate can overcome the negative cash conversion already visible in the numbers, I do not think the current valuation fully compensates for bitcoin volatility and financing risk.
What to Watch Next
- Quarterly revenue above <span class="lf0-key" data-src="Yahoo Finance — Quarterly Income Statement: Total Revenue (2025-12-31)">$180M</span> — would support a move from Sell toward Hold.
- Operating margin moving materially closer to zero — would show the fleet is converting into earnings.
- Quarterly revenue below $130M — would strengthen the bear case.
- Debt/equity staying above 200% — would keep refinancing risk elevated.
- Operating cash flow turning positive — would confirm the buildout is becoming self-funding.
What’s your take? I rated CleanSpark (CLSK) SELL above — but the goal here is to get this right, not just to publish an opinion. What would you add to this analysis, or which risk or catalyst do you think I’m under- or over-weighting? Tell me in the comments.
Our track record: every directional call is tracked publicly on The Scorecard, and Stocks Covered lists every company we have rated and when.
Sources
- SEC 10-K Annual Report — filed 2024-12-03
- SEC 8-K Filing (2024-12-17)
- SEC 8-K Filing (2024-12-13)
- SEC 8-K Filing (2024-12-12)
- SEC 8-K Filing (2024-12-02)
- SEC 8-K Filing (2024-11-15)
- SEC 8-K Filing (2024-10-31)
- SEC Form 4 Insider Transaction (2026-05-14)
- SEC Form 4 Insider Transaction (2026-05-14)
- SEC Form 4 Insider Transaction (2026-05-14)
- SEC 10-K Annual Report — FY2024
- SEC 10-K Annual Report — FY2023
- SEC 10-K Annual Report — FY2022
- SEC 10-K Annual Report — FY2021
- SEC 10-K Annual Report — FY2020
Data sourced from Yahoo Finance and SEC EDGAR. Not investment advice.
Leave a Comment