
Expected price range
Each range is set from the stock’s recent price history and our Hold rating, using its own 1-year realised volatility (24% annualised) as the width of a ~68% statistical band, and checked against that rating so the range leans the same way as our view. Starting price $123 (close 2026-11-05). The stock traded between $100 and $127 over the last 6 months and between $92.00 and $127 over the last year. This is an illustration of where our view and normal volatility point, not a forecast, price target or investment advice; the stock can move outside it.
| Company | Nov 25 | Dec 25 | Jan 26 | Feb 26 | Mar 26 | Apr 26 | May 26 | Jun 26 | Jul 26 | Aug 26 | Sep 26 | Oct 26 | 12-Mo |
|---|---|---|---|---|---|---|---|---|---|---|---|---|---|
| PRU | +5% | +4% | -2% | -10% | -1% | +0% | +4% | +7% | +13% | -3% | -3% | +3% | +18% |
| PUK | +5% | +7% | +6% | -7% | -6% | +6% | -5% | -7% | +13% | -10% | -9% | -0% | -10% |
| PFG | +1% | +5% | +7% | +1% | -5% | +12% | +3% | +5% | +5% | -3% | +2% | -0% | +37% |
| CRBG | -8% | +1% | +2% | -16% | -7% | +15% | -2% | +7% | +9% | +4% | +3% | +5% | +11% |
| MET | -3% | +3% | -0% | -8% | -2% | +13% | +4% | +2% | +14% | -0% | -1% | +6% | +29% |
Source: Yahoo Finance monthly adjusted close.
Quick Thesis
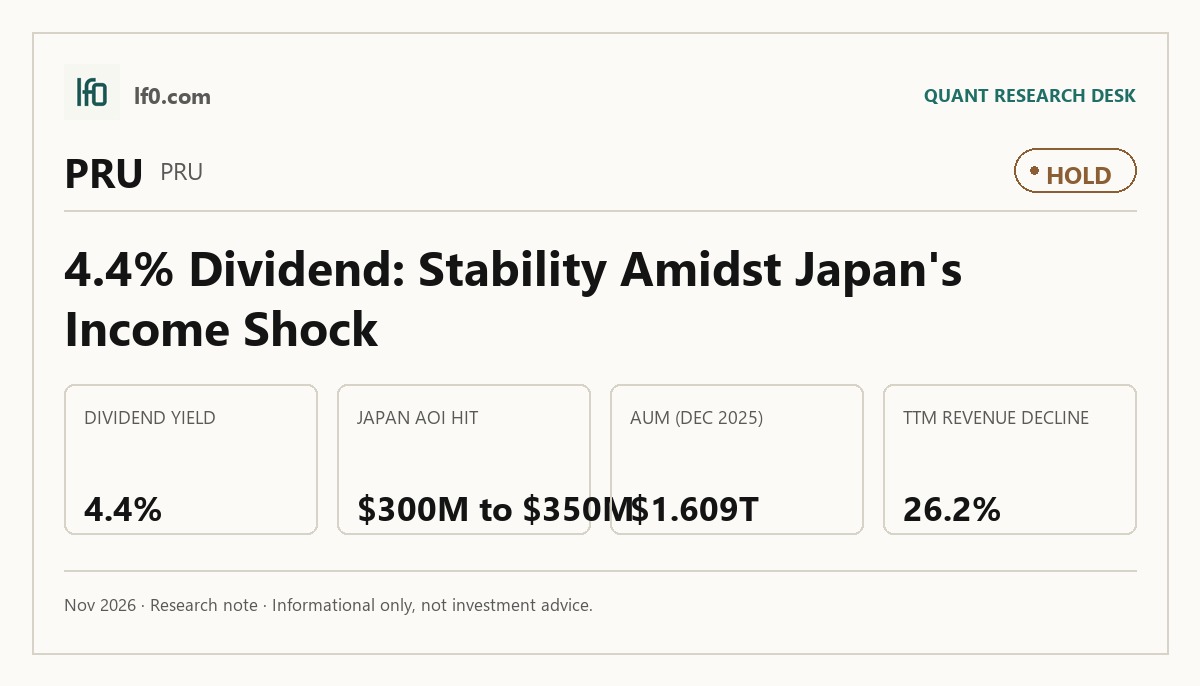
- Rated hold — PGIM scale is strong, but Japan’s earnings hit keeps the setup balanced.
- PGIM manages $1.609T of assets, anchoring the franchise.
- Japan’s expected $300M to $350M pre-tax AOI hit is the key risk.
- PRU trades at 11.4x trailing P/E and 10.3x EV/EBITDA, which looks fair.
- I would turn more constructive if Japan sales normalize and operating margin stays above 14.0%.
Executive Summary
Rating: HOLD | PRU
Measured from adjusted close on 2026-11-05 to 2026-11-09. Sell ratings are correct when the stock falls; Hold is tracked as a +/-10% range. Daily-close data, not intraday. Calls are tracked for 182 days from publication, then frozen as a final record.
I would put my rating as a Hold because Prudential has a defensible fee-and-insurance franchise, but the Japan suspension is large enough to cap near-term upside. PGIM’s $1.609T of assets under management gives the company real scale, and the 4.4% trailing dividend yield plus 50.6% payout ratio show shareholders are still being paid while they wait. The main issue is the expected $300M to $350M reduction in Prudential of Japan’s 2026 pre-tax adjusted operating income after the 90-day new-sales suspension, which is big enough to offset the capital-return story. I would raise my rating more towards a Buy if Prudential of Japan resumes normal sales and the next few quarters keep operating margin above 14.0%, because that would show the core earnings base is absorbing the shock rather than slipping into a longer reset.
Company Profile
Prudential Financial is a global financial services company and active investment manager with $1.609T of assets under management as of December 31, 2025. It earns revenue from life insurance, annuities, retirement products and services, mutual funds, and investment management fees. PGIM generates asset-based fees, performance fees, and transaction income, while the insurance businesses earn premiums, policy charges, and investment income. Founded through the 2001 demutualization of The Prudential Insurance Company of America, it became a stock company on December 18, 2001 and created the Closed Block, a segregated pool for pre-demutualization participating policies. Prudential operates in the U.S., Asia, Europe, and Latin America, has 36,824 employees worldwide, and is headquartered in Newark, New Jersey. Its common stock is listed on the New York Stock Exchange under PRU. The company also owns about 20% of Prismic Life Holding Company LP, a Bermuda reinsurance platform launched in September 2023 to expand life and annuity reinsurance capacity.
Economic Moat
Business Model
PGIM’s scale and product breadth are the most defensible part of Prudential Financial’s model. According to its 2026 10-K, PGIM had approximately $1.609T of assets under management as of December 31, 2025, and it spans public fixed income, private credit and other alternatives, public equity, real estate, and multi-asset solutions. I feel that this is hard for a well-funded competitor to replicate within 3 years because the business is not just an asset pool; it combines specialized investment teams, a centralized product and distribution platform, and long-standing institutional and retail client relationships across the U.S., Europe, Asia, and Latin America. That breadth matters because it gives Prudential multiple fee streams and a way to cross-sell into its own insurance and retirement balance sheet, which makes the franchise more resilient than a single-line manager.
The secondary support comes from the retirement and insurance platform, especially pension risk transfer, longevity reinsurance, and indexed annuity products. Prudential highlights its leadership in pension risk management solutions and its FlexGuard suite of indexed-variable annuities, which combine downside protection with optional income benefits. I view those capabilities as more durable than ordinary retail insurance distribution because they depend on pricing, asset-liability management, and reinsurance execution, not just sales force size. The company also has a meaningful reinsurance lever through Prismic Life Reinsurance, Ltd., a Bermuda-based life and annuity reinsurer launched in September 2023, which expands capacity for risk transfer and capital management.
The business has clearly shifted over the last five years. In 2022’s 10-K, Prudential reported approximately $1.742T of assets under management and still described Retirement, Individual Annuities, Individual Life, and Assurance IQ as separate U.S. businesses. By 2026, the structure is cleaner: Retirement Strategies now combines institutional and individual retirement, Assurance IQ has been exited, Prudential Advisors sits in Corporate and Other, and PGIMW, Prudential of Argentina, and the Full Service Retirement business have all been moved into divested or run-off status. That means the company has spent five years simplifying the portfolio and leaning harder into fee-based asset management, retirement, and capital-light insurance. The 2026 business model is structurally similar to 2022 in its core insurance and asset-management mix, but it is more focused and less cluttered, which is a modest bull signal because the earnings base should be easier to manage and less exposed to non-core drag.
Business & Operating Risks
The most material disclosed risk is the mismatch between Prudential Financial’s long-dated liabilities and the market value of the assets backing them. According to the risk factors in their SEC 10-K, some product liabilities generate cash flows that can run 30 years or more, while rising rates can leave the company unable to replace assets fast enough to fund higher crediting rates and falling rates can compress the spread between what it pays and what it earns. That is not abstract boilerplate: the company already reports exposure to higher-than-expected surrender activity and liquidity stress, and the financial data in this article shows why investors should care, because a life insurer with spread products can see earnings and capital move quickly when reinvestment yields lag liability guarantees. The same filing also flags variable annuity guarantees, where downturns in equity markets, higher volatility, and wider credit spreads can lift reserves and reduce net income; that risk is material because it hits the reserve line directly, not just sentiment.
A second company-specific risk is policyholder behavior, especially lapse and withdrawal pressure on products with cash surrender value. The 10-K says surrenders may rise after a downgrade of financial strength ratings or adverse publicity, and certain products can force asset sales to meet surrender demands. For Prudential, that mechanism matters because forced sales in a stressed market can turn an accounting loss into a liquidity problem, which is exactly the kind of second-order damage that can hit a large insurer faster than the headline risk factor suggests. The filing’s discussion of reinsurance and derivative counterparties adds a third layer: bespoke transactions can be difficult to hedge, and a counterparty failure could require Prudential to recapture liabilities and reestablish or strengthen reserves and capital, which would be a direct drag on capital flexibility. The financial data in this article does not show a current liquidity event, but it does show a business whose earnings are highly sensitive to market conditions, so these risks are already embedded in the operating model.
The risk picture has broadened since 2022 and 2023. Prior filings emphasized the same core investment, insurance, market, liquidity, and operational risks, but the 2026 10-K is more explicit about artificial intelligence, cyberattacks, and geopolitical retaliation, including deep-fakes, agentic AI, and state-sponsored attacks; that language was much less prominent in earlier filings. By contrast, the pandemic-specific framing that was more visible in earlier years has faded from the current filing, which is a normal evolution rather than a new problem. The current filing also makes the Japan and foreign-exchange exposure more concrete by tying it to significant business operations outside the U.S. and the risk that a stronger U.S. dollar would reduce reported revenue, which is a more explicit articulation than prior filings. In short, the risk set is not fundamentally new, but the operational and technology layer is more detailed and more current than it was three years ago.
Prudential’s own risk controls partly offset those exposures: it uses diversified maturities and targets a key rate duration profile that is approximately equal to liabilities and surplus, which reduces but does not eliminate interest-rate mismatch risk. It also relies on underwriting, reinsurance, and diversification to manage mortality and morbidity risk across the portfolio rather than in a single concentrated block. Taken together, the disclosed risks pressure earnings and capital flexibility more than they threaten the moat itself, because the PGIM platform and retirement franchise still give Prudential multiple ways to earn through a cycle.
Management Discussion & Analysis
Management is signaling a capital-light, capital-returning posture, but the operating mix is being reshaped by one clear negative in Japan. The board authorized $1B of share repurchases for 2026 after using the full $1B authorization in 2025, and the quarterly dividend was raised to $1.40 per share on February 3, 2026, which tells me management is comfortable returning cash while keeping the balance sheet flexible. That is supported by $4.7B of highly liquid assets at December 31, 2025, even after $1B of debt redemptions in May 2025 and $750M of 5.200% senior unsecured notes issued in March 2025, so the near-term funding profile looks orderly rather than stretched. The more important signal is the 90-day suspension of new sales at Prudential of Japan starting February 9, 2026, because management now expects a $300M to $350M reduction in Prudential of Japan’s 2026 pre-tax adjusted operating income; investors should read that as a real earnings headwind, not a temporary disclosure issue. The Prismic Life Reinsurance, Ltd. transaction also matters because the roughly $7B reserve transfer and the estimated $400M value release show management is still using reinsurance to free capital, which supports flexibility but does not eliminate the Japan execution risk.
Prior filings were broadly constructive on the same themes, but the results were mixed. In 2025’s 10-K, management said the business would benefit from higher interest rates and from a strategic pivot toward more capital-efficient annuities, and 2025 did deliver higher adjusted operating income in Retirement Strategies and Individual Life, with Individual Life turning to $260M from a $205M loss in 2024; that supports the strategy, although the gains were helped by the Wilton Re reinsurance transaction rather than pure organic improvement. By contrast, the 2025 outlook for Japan did not anticipate the 2026 misconduct issue, so the current suspension and the expected $300M to $350M hit show a material miss in operational control, not just a cyclical swing. Management tenure appears stable at the top because the current filing does not indicate a CEO or CFO change versus prior filings, and the segment reorganization of International Businesses in 2025 was disclosed cleanly and retrospectively, which is a positive sign for reporting discipline. Tone has generally been confident across the last three filings, but the current Japan suspension and the recurring reliance on reinsurance and reserve-financing structures tell me the narrative has been more optimistic than the risk profile warranted. Management Credibility Rating: BBB — the team has delivered on capital actions and several business initiatives, but the Japan control failure and the repeated use of reinsurance and reserve actions to support earnings show some gap between upbeat messaging and operating reality. Management’s overall signals are a neutral to slightly bear input for the investment thesis because capital returns and liquidity are solid, but the Japan disruption is large enough to offset that support in the near term.
Recent Events
The most significant development I see is the April 14, 2026 resegmentation, which split out U.S. Legacy Products as a runoff block and combined the remaining retirement businesses into a new Retirement segment. That strengthens the thesis by making Prudential’s capital allocation more transparent: management is separating shrinking legacy liabilities from the businesses with ongoing growth potential, which should help investors judge where the franchise is actually compounding.
The April 21, 2026 update on Prudential of Japan’s suspension of new sales weakens the near-term growth picture in Asia, because it confirms that the company is still managing a product-line disruption rather than expanding that franchise. I view that as a test of execution, not a balance-sheet issue, but it does show that the Japan operation remains a drag on strategic optionality.
The May 5, 2026 preliminary first-quarter disclosure also matters because it flagged a shortfall in General Account alternative investment income versus near-term expectations, while PGIM assets under management were still reported at $1.43T. In my view, that is a mixed signal: the asset-management platform remains large, but the investment-income miss suggests earnings quality is still sensitive to market conditions. The recent 8-Ks leave the investment case slightly weaker overall.
Financial Analysis
Growth
PRU — Financial Growth (Quarterly, USD Mil)
| Metric | 2025-06-30 | 2025-09-30 | 2025-12-31 | 2026-03-31 | 2026-06-30 | 2026-09-30 |
|---|---|---|---|---|---|---|
| REVENUE (USD Mil) | 13,804 | 17,950 | 15,676 | 15,546 | 15,692 | — |
| EBIT (USD Mil) | — | — | — | — | — | — |
| EBITDA (USD Mil) | — | — | — | — | — | — |
| NET INCOME (USD Mil) | 533 | 1,431 | 905 | 597 | 985 | — |
| DILUTED EPS | — | 4 | 2.5 | 1.7 | 2.8 | 4 |
Source: Yahoo Finance — Quarterly Financial Statements
| Period | Revenue USD Mil | Net Income USD Mil | Diluted EPS |
|---|---|---|---|
| 2025-06-30 | 13,804 | 533 | N/A |
| 2025-09-30 | 17,950 | 1,431 | 4.0 |
| 2025-12-31 | 15,676 | 905 | 2.5 |
| 2026-03-31 | 15,546 | 597 | 1.7 |
| 2026-06-30 | 15,692 | 985 | 2.8 |
| 2026-09-30 | N/A | N/A | 4.0 |
PRU’s revenue rose from $13.8B in Q2 2025 to $17.9B in Q3 2025, then eased to $15.7B in Q4 2025 and $15.5B in Q1 2026 before ticking up to $15.7B in Q2 2026. That is a 13.0% YoY increase in Q2 2026 versus Q2 2025, but the sequence shows a sharp Q3 spike followed by normalization, so I would not extrapolate the Q3 run rate. Net income moved more unevenly than revenue, from $533M in Q2 2025 to $1.4B in Q3 2025, then $905M in Q4 2025 and $597M in Q1 2026, which tells me earnings are more volatile than sales. The growth profile is stable rather than accelerating, and that matters because a steady insurer can support a fair multiple, but it does not justify paying for a rerating until the Japan drag is behind it.
Profitability
PRU — Profitability (TTM)
| Metric | TTM |
|---|---|
| Operating Margin (TTM) | 14.4% |
| Net Margin (TTM) | 6.4% |
| Return on Assets (TTM) | 0.4% |
| Return on Equity (TTM) | 12.0% |
| Gross Margin (TTM) | 29.2% |
| EBITDA Margin (TTM) | 8.0% |
Source: Yahoo Finance — Trailing Twelve Months (TTM)
TTM operating margin of 14.4%, gross margin of 29.2%, and EBITDA margin of 8.0% show Prudential is profitable at the core, but the 14.8-point gap between gross and operating margin means expenses below the revenue line still absorb a large share of revenue. TTM net margin of 6.4% is lower than operating margin, so financing, taxes, and other below-the-line items are still taking a meaningful cut of earnings. TTM return on assets of 0.4% versus TTM return on equity of 12.0% shows returns are being amplified by leverage rather than by especially high asset productivity, so the equity return is less durable if funding costs rise. The positive margins and returns indicate a mature insurer, not a company still building toward breakeven, but the spread between gross, operating, and net profit tells investors to watch whether operating margin can hold above 14.0% and net margin can stay near 6.0%, because that would confirm the earnings base is stable rather than dependent on financial engineering. The margin profile also fits the moat discussion above: PGIM scale and retirement products are producing acceptable returns, but not enough to make the stock look obviously cheap on earnings power alone.
Valuation
PRU — Valuation Multiples
| Metric | Value |
|---|---|
| Current Share Price (USD) | 123.3 |
| Market Cap (USD Mil) | 42,523 |
| Enterprise Value (USD Mil) | 50,313 |
| Trailing P/E | 11.2 |
| Forward P/E | 9 |
| Price/Sales (TTM) | 0.7 |
| Price/Book (mrq) | 1.4 |
| EV/Revenue | 0.8 |
| EV/EBITDA | 10.3 |
| Beta (5Y Monthly) | 0.83 |
| FCF Yield % (TTM) | — |
| Forward EPS (USD) | 13.7 |
| Analyst Target Price – Low (USD) | 92 |
| Analyst Target Price – Mean (USD) | 110 |
| Analyst Target Price – High (USD) | 136 |
| # Analyst Opinions | 15 |
Source: Yahoo Finance
PRU trades at 0.83x EV/Revenue and 0.71x Price/Sales on a current share price of $124.87, which tells me the market is paying less than one dollar for each dollar of annual revenue and is pricing in either low growth or a structurally lower return on that revenue base. The 10.3x EV/EBITDA multiple is the main earnings anchor here, and it implies investors are underwriting a steady insurance and asset-management earnings stream rather than a high-growth rerating. Trailing P/E is 11.4x and forward P/E is 9.1x, so the stock is not expensive on earnings, especially with forward EPS of 13.7. Price/Book is 1.5x, which is modest for a large financial and suggests the market is not assigning a large premium to the balance sheet. Beta is 0.83, so the shares have moved less than the market over the last five years, which fits a defensive valuation profile. PEG ratio is 0.88x, which points to a valuation that is not demanding relative to expected long-term earnings growth. Trailing annual dividend yield is 4.4%, and the 50-day and 200-day moving averages of $117.0 and $108.7 sit below the current price, so the stock is also being valued with some momentum support. The overall valuation picture is neutral to slightly bullish, but the multiple is only attractive if the earnings base proves durable through the Japan reset.
On the analysis here, I would put fair value in a range of roughly $110-$130, which is close to the current price and below the top end of analyst targets. That range sits inside the $92-$136 analyst band and slightly above the $110 mean, so I do not see a strong disagreement with consensus; instead, I think the market is already giving some credit for stability, while still discounting the Japan hit. I would frame the earnings power as roughly $13-$14 per share on a normalized basis, which is close to the company’s own forward EPS of 13.7 and broadly in line with peers on a like-for-like basis, but not rich enough to justify a premium multiple until growth and margin durability improve. Put differently, the stock looks fairly priced for a business with solid returns and a good balance sheet, but not cheap enough to ignore the operating risk.
Leverage
PRU — Leverage & Coverage (Quarterly)
| Metric | Value |
|---|---|
| Total Debt/Equity % (mrq) | 138.3 |
| Current Ratio (mrq) | 1.8 |
| Total Debt (mrq, USD Mil) | 44,908 |
| Operating Cash Flow (TTM, USD Mil) | — |
| Levered Free Cash Flow (TTM, USD Mil) | — |
| Net Debt/EBITDA (TTM) | 0.8 |
| FCF Margin % (TTM) | — |
Source: Yahoo Finance — Quarterly Financial Statements
Prudential’s leverage is manageable, not stretched: Total Debt/Equity was 138.3% mrq, the Current Ratio was 1.85x mrq, and Total Debt was $44.9B mrq. Net Debt/EBITDA was 0.79x TTM, which is a modest net leverage load for a financial company and suggests refinancing risk is contained rather than acute. I would not infer more than the liquidity ratios allow because Operating Cash Flow and Levered Free Cash Flow are absent in the data block, so the cash conversion read has to come from the balance-sheet profile instead of a free-cash-flow spread. In my view, the balance sheet is a support, not the main thesis driver: it gives Prudential room to absorb the Japan hit, but it does not by itself create upside.
Insider Activity
| Date | Insider | Role | Type | Shares | Price |
|---|---|---|---|---|---|
| 2026-05-14 | KAPPLER ANN M | EVP and General Counsel | S | 13,580 | $103.25 |
| 2026-04-29 | PRUDENTIAL INSURANCE CO OF AMERICA | 10%+ Owner | P | 270,092.2 | $30.36 |
The insider transaction record I see here is net buying, with 14 open-market purchases totaling $129.7M versus 3 open-market sales totaling $2.4M over 2024-06-13 to 2026-05-14. The pattern is broad rather than concentrated because multiple insiders bought, and the largest open-market trade was a 10%+ owner purchase, which suggests alignment between insiders and shareholders is constructive. That said, the ownership base is still low, so I treat insider buying as a positive signal rather than a core pillar of the thesis.
Comparable Analysis
Growth
| Company | Revenue TTM (USD Mil) | Revenue Growth YoY % | EBITDA TTM (USD Mil) | Diluted EPS TTM |
|---|---|---|---|---|
| PRU | 60,815 | -26.2% | 4,878 | 11 |
| PUK | 14,309 | -1.8% | 5,923 | 2.8 |
| PFG | 16,628 | 25.4% | 2,747.9 | 9 |
| CRBG | 20,477 | 18.6% | 4,971 | 4.5 |
| MET | 79,398 | 10.5% | 6,040 | 5.2 |
Source: Yahoo Finance
PRU’s revenue growth profile is weaker than the peer set on the table here: revenue growth was -26.2% for PRU versus -1.8% for PUK, +25.4% for PFG, +18.6% for CRBG, and +10.5% for MET. That gap matters because PRU’s valuation cannot lean on growth to justify a premium; it has to lean on stability, capital returns, and the moat in PGIM and retirement.
Valuation
| Company | Current Share Price (USD) | Trailing P/E | Forward P/E | EV/Revenue | EV/EBITDA | Price/Sales (TTM) | Price/Book (mrq) | Market Cap (USD Mil) | Enterprise Value (USD Mil) | Beta (5Y Monthly) | FCF Yield % (TTM) | Forward EPS | Analyst Target Price – Low | Analyst Target Price – Mean | Analyst Target Price – High | # Analyst Opinions |
|---|---|---|---|---|---|---|---|---|---|---|---|---|---|---|---|---|
| PRU | 123.3 | 11.2 | 9 | 0.8 | 10.3 | 0.7 | 1.4 | 42,523 | 50,313 | 0.83 | — | 13.7 | 92 | 110 | 136 | 15 |
| PUK | 25.2 | 8.9 | 15.8 | 2.2 | 5.2 | 2.2 | 6.4 | 30,876 | 30,906 | 0.86 | 13.4% | 1.6 | 34 | 37.8 | 41.4 | 4 |
| PFG | 115.1 | 12.8 | 11.4 | 1.5 | 9 | 1.5 | 2.1 | 24,449 | 24,603 | 0.89 | 7.1% | 10.1 | 86 | 109.4 | 125 | 12 |
| CRBG | 34.5 | 7.7 | 6 | 1.3 | 5.5 | 0.7 | 2.4 | 15,111 | 27,116 | 0.98 | 24.6% | 5.7 | 36 | 40.5 | 46 | 12 |
| MET | 103.2 | 19.8 | 9.2 | 1.1 | 14.7 | 0.8 | 2.4 | 65,549 | 88,898 | 0.77 | -32.0% | 11.2 | 84 | 107.6 | 119 | 16 |
Source: Yahoo Finance
PRU trades at 0.83x EV/Revenue, 11.4x trailing P/E, and 0.71x Price/Sales, versus PUK at 2.2x, 8.9x, and 2.2x, PFG at 1.5x, 12.8x, and 1.5x, CRBG at 1.3x, 7.7x, and 0.7x, and MET at 1.1x, 19.8x, and 0.8x. The cleaner read is FCF Yield: PUK leads at 13.4%, PFG is 7.1%, CRBG is 24.6%, while PRU has no disclosed FCF yield, so the market is not offering a cash-flow discount that clearly compensates for its weaker growth. A $1 investment a year ago would be worth $1.27 in PRU, versus $0.96 in PUK, $1.48 in PFG, $1.20 in CRBG, and $1.33 in MET, so PRU has outperformed PUK but lagged PFG and MET; that is consistent with a stock that has rerated on stability, not on superior growth. Using peer EV/Revenue of 1.1x to 2.2x on PRU’s $60.8B revenue implies an enterprise value range of about $68.2B to $132.6B, which is wide because the peer set mixes lower-growth, higher-yield insurers with richer multiple names. On a growth-adjusted basis, PRU looks closer to the middle of the group than to the cheapest end, and the market is not paying a growth premium for it.
Profitability
| Company | Operating Margin (TTM) | Net Margin (TTM) | Return on Assets (TTM) | Return on Equity (TTM) | Gross Margin (TTM) | EBITDA Margin (TTM) |
|---|---|---|---|---|---|---|
| PRU | 14.4% | 6.4% | 0.4% | 12.0% | 29.2% | 8.0% |
| PUK | 28.0% | 25.5% | 1.6% | 18.7% | 37.8% | 41.4% |
| PFG | 18.3% | 11.9% | 0.5% | 16.1% | 48.4% | 16.5% |
| CRBG | 39.5% | 10.8% | 0.7% | 20.1% | 30.9% | 24.3% |
| MET | 5.5% | 4.6% | 0.5% | 13.1% | 23.9% | 7.6% |
Source: Yahoo Finance
PRU’s operating margin of 14.4%, net margin of 6.4%, gross margin of 29.2%, and EBITDA margin of 8.0% all trail PUK’s 28.0%, 25.5%, 37.8%, and 41.4%, and also lag PFG’s 18.3%, 11.9%, 48.4%, and 16.5%. The gap looks more like a scale and mix difference than a pure cost problem, because PRU’s gross margin is closer to PFG and CRBG than its operating margin is, which suggests the bigger drag is below gross profit rather than at the product level. PRU’s ROE of 12.0% and ROA of 0.4% are respectable, but they sit below PUK’s 18.7% and 1.6%, PFG’s 16.1% and 0.5%, and CRBG’s 20.1% and 0.7%, so the company is generating acceptable equity returns without matching the most efficient peers.
Leverage
| Company | Total Debt/Equity % (mrq) | Current Ratio (mrq) | Total Debt (mrq, USD Mil) | Operating Cash Flow TTM (USD Mil) | Free Cash Flow TTM (USD Mil) | Net Debt/EBITDA (TTM) | FCF Margin % (TTM) |
|---|---|---|---|---|---|---|---|
| PRU | 138.3 | 1.8 | 44,908 | — | — | 0.8 | — |
| PUK | 28.7 | 1.5 | 5,919 | 1,709 | 4,138.9 | 0 | 28.9% |
| PFG | 39.5 | 1.5 | 4,847.2 | 5,534.9 | 1,737.5 | -0.3 | 10.4% |
| CRBG | 201.7 | 1.2 | 14,979 | 2,433 | 3,710.6 | 2 | 18.1% |
| MET | 179.9 | 2 | 50,311 | 15,558 | -20,954 | 3.8 | -26.4% |
Source: Yahoo Finance
PRU’s debt/equity of 138.3% is higher than PUK’s 28.7% and PFG’s 39.5%, but its net debt/EBITDA is only 0.79x versus CRBG’s 2.0x and MET’s 3.8x, which means cash and investment assets materially soften the balance-sheet risk. That combination, plus a 1.85x current ratio, says PRU is financed more aggressively than PUK and PFG on paper, but the net leverage profile is still manageable and not a thesis breaker. The lower net leverage also helps explain why PRU can trade at a reasonable multiple despite weaker growth: investors are paying for balance-sheet flexibility as much as for earnings quality.
Conclusion
I would put my rating as a Hold because Prudential’s valuation is reasonable at 11.4x trailing P/E and 10.3x EV/EBITDA, but the earnings base is not yet strong enough to justify a more aggressive stance while Japan is still absorbing a $300M to $350M pre-tax hit. The balance sheet is not the problem, with net debt at 0.8x EBITDA and a 1.85x current ratio, so the real question is whether the current profit stream can hold while management works through the operating reset.
I would raise my rating more towards a Buy if Prudential can keep operating margin above 14.0% for two to three quarters while the Japan disruption fades enough to avoid the expected $300M to $350M pre-tax hit, because that would show the core franchise is absorbing the shock without a lasting earnings break. On the growth side, if quarterly revenue can stay near the Q2 2026 level of $15.7B instead of slipping back toward the Q1 2026 trough of $15.5B, that would tell me the business has stabilized after the resegmentation and that the market is underestimating the value of the fee-based platform.
I would move from Hold to Sell if the Japan issue proves larger than management’s current estimate and the pre-tax operating income drag moves beyond $350M, because that would mean the current earnings base is too exposed to one operating problem. I would also become more cautious if net debt/EBITDA rises materially above 1.0x, since that would signal the balance sheet is no longer providing the cushion that currently limits downside.
Weighing both paths, I think the stabilization case is more likely to show up first, but not by enough to justify paying up today. The stock looks fairly priced for a business that is still proving how much of its earnings power survives the Japan setback, so I am comfortable staying at Hold until the next few quarters show whether the current margin profile is durable or just a pause in a more uneven earnings trend.
What to Watch Next
- Operating margin above 14.0% for two to three quarters — would support a move toward Buy.
- Prudential of Japan pre-tax AOI drag staying below $300M — would suggest the shock is contained.
- Quarterly revenue holding near $15.7B — would support the stabilization case.
- Net debt/EBITDA rising above 1.0x — would weaken the balance-sheet cushion.
- Japan sales resuming normally — would reduce the main earnings overhang.
What’s your take? I rated Prudential Financial (PRU) HOLD above — but the goal here is to get this right, not just to publish an opinion. What would you add to this analysis, or which risk or catalyst do you think I’m under- or over-weighting? Tell me in the comments.
Our track record: every directional call is tracked publicly on The Scorecard, and Stocks Covered lists every company we have rated and when.
Sources
- SEC 10-K Annual Report — filed 2026-02-12
- SEC 8-K Filing (2026-06-04)
- SEC 8-K Filing (2026-05-12)
- SEC 8-K Filing (2026-05-05)
- SEC 8-K Filing (2026-04-21)
- SEC 8-K Filing (2026-04-14)
- SEC 8-K Filing (2026-04-13)
- SEC Form 4 Insider Transaction (2026-05-18)
- SEC Form 4 Insider Transaction (2026-05-14)
- SEC Form 4 Insider Transaction (2026-05-14)
- SEC 10-K Annual Report — FY2026
- SEC 10-K Annual Report — FY2025
- SEC 10-K Annual Report — FY2024
- SEC 10-K Annual Report — FY2023
- SEC 10-K Annual Report — FY2022
Data sourced from Yahoo Finance and SEC EDGAR. Not investment advice.
Leave a Comment