
Expected price range
Each range is set from the stock’s recent price history and our Hold rating, using its own 1-year realised volatility (104% annualised) as the width of a ~68% statistical band, and checked against that rating so the range leans the same way as our view. Starting price $8.36 (close 2026-10-26). The stock traded between $4.18 and $20.43 over the last 6 months and between $3.31 and $20.43 over the last year. This is an illustration of where our view and normal volatility point, not a forecast, price target or investment advice; the stock can move outside it.
| Company | Oct 25 | Nov 25 | Dec 25 | Jan 26 | Feb 26 | Mar 26 | Apr 26 | May 26 | Jun 26 | Jul 26 | Aug 26 | Sep 26 | 12-Mo |
|---|---|---|---|---|---|---|---|---|---|---|---|---|---|
| BLZE | +11% | -54% | -2% | -2% | -17% | -8% | +24% | +93% | +92% | -13% | +3% | -1% | +51% |
| RBRK | -8% | -8% | +10% | -27% | -7% | -6% | +9% | +48% | +2% | -10% | +29% | +23% | +39% |
| P | +18% | -10% | -25% | +4% | -8% | -8% | +21% | +11% | -1% | -2% | +20% | +41% | +56% |
| DBX | -4% | +3% | -7% | -8% | -2% | -9% | +7% | +11% | +2% | +19% | +8% | -4% | +12% |
| NTAP | -0% | -5% | -4% | -10% | +3% | +3% | +9% | +57% | -11% | +16% | +4% | +13% | +80% |
| DOCN | +19% | +9% | +8% | +15% | +1% | +53% | +12% | +62% | +1% | -25% | -6% | +21% | +290% |
Source: Yahoo Finance monthly adjusted close.
Quick Thesis
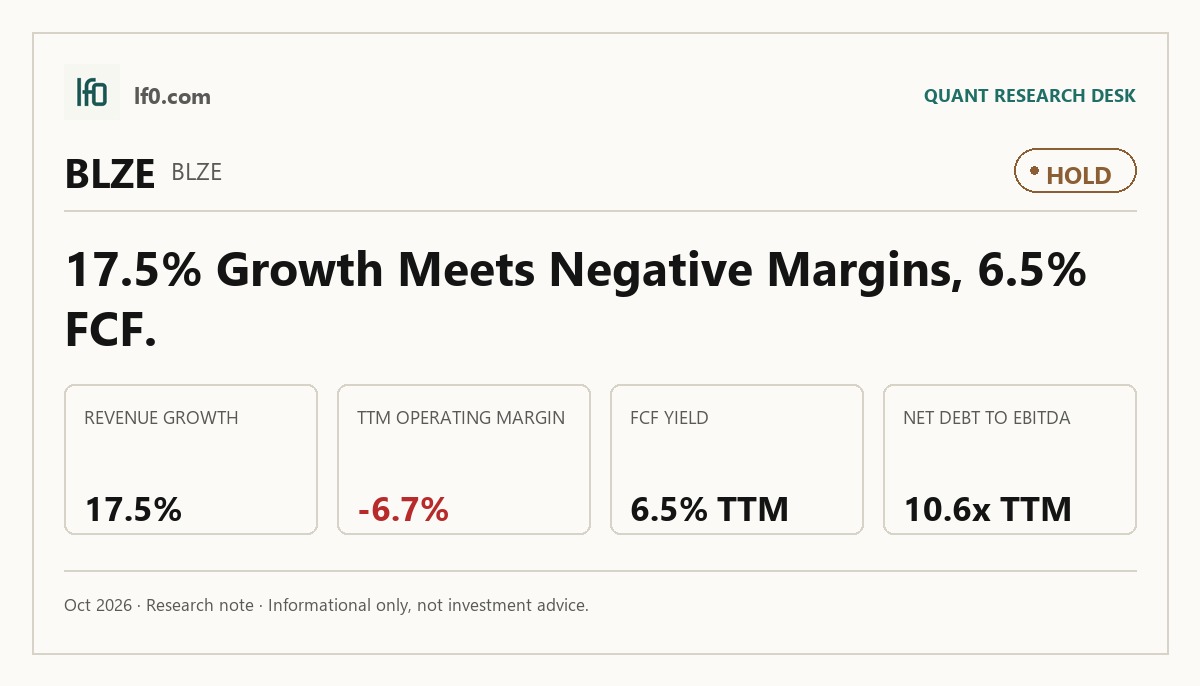
- Rated Hold — revenue is growing, but margins are still negative.
- Revenue reached $42.7M in Q2 2026, up 17.5% year over year.
- Net debt/EBITDA is 10.6x, so leverage remains a real constraint.
- The stock trades at 3.5x EV/revenue, below richer software peers.
- I would raise my rating if operating margin turns positive and stays there.
Executive Summary
Rating: HOLD | BLZE
We’ll begin tracking this call’s performance since publication once sufficient adjusted-close data is available.
I would put my rating as a Hold because Backblaze has a credible storage platform and a cash-based valuation floor, but the earnings base is still too thin to justify a more aggressive call. Revenue reached $42.7M in Q2 2026 and $145.8M in FY2025, yet TTM operating margin was still -6.7% and net margin was -13.1%, so the business is growing without proving it can convert that growth into durable profit. I would raise my rating more towards a Buy if operating margin turns positive and stays there for two to three quarters, because that would show the company is finally absorbing overhead on a larger revenue base.
Company Profile
Backblaze, Inc. builds cloud storage software for data-heavy workloads and earns recurring revenue from two products: B2 Cloud Storage, an infrastructure-as-a-service object storage platform, and Computer Backup, a subscription software-as-a-service backup service. It was incorporated in Delaware in 2007, completed its initial public offering in November 2021, and is listed on Nasdaq under BLZE. The company serves more than 500,000 customers in over 175 countries and manages about 5 billion gigabytes of data across more than 1 trillion files. Its footprint spans data center leases in California, Arizona, Virginia, Toronto, and Amsterdam, which supports multi-region storage in the United States, Canada, and Europe. Backblaze is financed with recurring customer revenue and lease-based infrastructure scaling, and it has approximately 320 full-time employees.
Economic Moat
Business Model
The clearest advantage here is the proprietary software architecture that manages hundreds of thousands of hard drives across multiple data centers, and in my view a well-funded competitor would struggle to replicate that operating system within 3 years because it has to be built, tested, and tuned at scale rather than bought. Backblaze also layers on an open cloud ecosystem and a self-serve acquisition model, which has helped it attract over 500,000 customers as of December 31, 2025 and support larger accounts through direct sales and the Powered by Backblaze program, a white-label offering that lets partners embed its storage under their own brand. Because B2 Cloud Storage and Computer Backup sit on the same platform, customer expansion can come from higher usage rather than a full product switch, which makes the revenue model stickier than a simple point solution.
Backblaze has also moved from proving that it can attract users to proving that it can scale data volume and workload complexity without losing efficiency. In 2022, it managed about 2 exabytes, which is roughly the same order of magnitude as the 5 billion gigabytes it now reports, but the more important change is the mix: the 2025 launch of B2 Overdrive, a premium high-throughput offering with up to 1Tbps, and the 2025 upgrade to AI-ready 400G-capable links show a clear pivot toward larger, more demanding workloads. The 2026 10-K also highlights a move up-market through direct sales to neocloud platforms, so the business is broader and more enterprise-oriented than it was 3 years ago.
Business & Operating Risks
Any loss of customer data, service outage, or cybersecurity incident is the most direct threat here because Backblaze’s platform is the product, and the filing is explicit that a disruption could destroy user content or prevent continuous backup and change tracking. The October 2025 cooling problem at one data center was resolved without significantly impacting access to customer data, but the latest financial data still shows net losses of $25.6M in FY2025 and an accumulated deficit of $221.6M at December 31, 2025, so a service failure would hit a company that is already unprofitable and would likely amplify churn and brand damage rather than just create a one-off repair bill.
Dependence on third-party data centers and hard drive suppliers is the second risk that matters. Backblaze relies on a limited number of third-party data centers and on key components such as hard drives and semiconductors from limited sources of supply, which means shortages or pricing changes could raise costs and pressure margins before they show up in revenue. That risk is already visible in the October 2025 cooling failure, and it is more serious because the company is still funding infrastructure refreshes while carrying only a small liquidity cushion.
Customer concentration and the fixed-price Computer Backup model are the third risk pair worth watching. Many customers can terminate with little-to-no advance notice, and the consumer backup market is facing downward pressure as it matures, so retention and data growth matter more than headline customer counts. The risk is not abstract: Backblaze still expects to remain unprofitable for the foreseeable future, which means any slowdown in data growth or a higher churn rate would hit a business that does not have a broad product mix to absorb the shock.
The disclosed risks do not undermine the moat itself so much as test whether the platform can keep scaling without a service or cost shock. I think the bigger issue is execution risk around uptime, supply, and retention, not a structural flaw in the storage architecture.
Management Discussion & Analysis
Management is clearly trying to address the operating risks through product and sales execution rather than through a balance-sheet reset. The launch of B2 Overdrive in April 2025 and the Enterprise Web Console in May 2025 are aimed at larger, more demanding customers, while the 2025 Restructuring and Transformation Plan signals a push to tighten sales and marketing execution without adding broad overhead. That is the right response to the risks above, but it does not yet remove them.
The operating data shows why management is leaning into that strategy. B2 Cloud Storage revenue rose 26% in FY2025, total revenue rose 14% to $145.8M, and overall net revenue retention was 105%, so the up-market push is showing up in the numbers rather than just in the narrative. At the same time, total customers fell to 503,866 in FY2025 from 507,647 in FY2024 while annual average revenue per user rose to $307 from $268, which tells me monetization improved even as customer count softened. That is a better mix than simple customer growth, but it also shows the company is still trading breadth for depth.
Recent Events
The most important recent event was the May 26, 2026 annual meeting, where stockholders elected Jocelyn Carter-Miller to the board and ratified Deloitte & Touche LLP as auditor for FY2026. The board vote was not unanimous, with 8.8 million shares voting against her and 15.2 million broker non-votes, so I read this as a governance check rather than a strategic reset.
The February 23, 2026 and May 4, 2026 earnings releases for Q4 2025 and Q1 2026 were routine, but they confirm that management is still using the quarterly cadence to keep the market updated on execution. I do not see any acquisition, financing, or leadership event that would alter the competitive position described earlier.
Financial Analysis
Growth
BLZE — Financial Growth (Quarterly, USD Mil)
| Metric | 2025-06-30 | 2025-09-30 | 2025-12-31 | 2026-03-31 | 2026-06-30 |
|---|---|---|---|---|---|
| REVENUE (USD Mil) | 36.3 | 37.2 | 37.8 | 38.7 | 42.7 |
| EBIT (USD Mil) | -6.2 | -2.8 | -4.2 | -4.9 | -3.8 |
| EBITDA (USD Mil) | -0.7 | 3.2 | 2.1 | 1.8 | 3.2 |
| NET INCOME (USD Mil) | -7.1 | -3.8 | -5.4 | -6.1 | -5.1 |
| DILUTED EPS | -0.1 | -0.1 | -0.1 | -0.1 | -0.1 |
Source: Yahoo Finance — Quarterly Financial Statements
Backblaze’s revenue is still rising, but only in the low double digits: $36.3M in Q2 2025, $37.2M in Q3 2025, $37.8M in Q4 2025, $38.7M in Q1 2026, and $42.7M in Q2 2026. That is 17.5% year over year in Q2 2026, with the step-up from Q1 2026 to Q2 2026 suggesting some acceleration rather than a flat run rate. EBITDA is less consistent, moving from $-0.743M in Q2 2025 to $3.2M in Q3 2025, $2.1M in Q4 2025, $1.83M in Q1 2026, and $3.23M in Q2 2026, so earnings are growing slower and more unevenly than revenue.
The growth signal is neutral to slightly bullish, but the choppy EBITDA path says the business has not yet proven durable operating leverage. Revenue growth alone would normally support a better multiple, yet the leverage profile means the company still has to fund execution before equity holders see much of the upside.
Profitability
BLZE — Profitability (TTM)
| Metric | TTM |
|---|---|
| Operating Margin (TTM) | -6.7% |
| Net Margin (TTM) | -13.1% |
| Return on Assets (TTM) | -3.5% |
| Return on Equity (TTM) | -24.3% |
| Gross Margin (TTM) | 62.3% |
| EBITDA Margin (TTM) | 2.0% |
Source: Yahoo Finance — Trailing Twelve Months (TTM)
TTM gross margin of 62.3% shows the storage platform still has healthy unit economics before overhead, but the TTM EBITDA margin of 2.0% and TTM operating margin of -6.7% show that sales, product, and administrative costs are still absorbing most of that gross profit. The gap between gross margin and operating margin is wide, which points to a scale problem rather than a cost-of-revenue problem; the core service is not broken, but the company has not yet spread fixed costs enough to turn the model into durable operating profit.
TTM net margin of -13.1% is worse than operating margin because interest and other below-the-line items are still taking a further bite out of earnings. TTM ROA of -3.5% and TTM ROE of -24.3% confirm that capital is still earning negative returns, and the large ROE versus ROA gap suggests leverage is amplifying weak underlying profitability rather than creating real efficiency. Investors should watch for operating margin turning positive first, because that would show the business is finally scaling through overhead.
Valuation
BLZE — Valuation Multiples
| Metric | Value |
|---|---|
| Current Share Price (USD) | 8.3 |
| Market Cap (USD Mil) | 516 |
| Enterprise Value (USD Mil) | 549 |
| Trailing P/E | — |
| Forward P/E | 30.9 |
| Price/Sales (TTM) | 3.3 |
| Price/Book (mrq) | 5.8 |
| EV/Revenue | 3.5 |
| EV/EBITDA | 178.8 |
| Beta (5Y Monthly) | 1.57 |
| FCF Yield % (TTM) | 6.5% |
| Forward EPS (USD) | 0.3 |
| Analyst Target Price – Low (USD) | 21 |
| Analyst Target Price – Mean (USD) | 22.8 |
| Analyst Target Price – High (USD) | 25 |
| # Analyst Opinions | 6 |
Source: Yahoo Finance
Backblaze trades at 3.5x EV/revenue and 3.3x price/sales, with a current share price of $8.34 and a market cap of $516M. The clearest support in the valuation data is the 6.5% FCF yield, which tells me the stock is not priced as a pure cash burner even though the earnings line is still weak. EV/EBITDA of 178.8x is too distorted to be a useful cheap-or-expensive signal on its own, because EBITDA is still very small relative to enterprise value.
I would put fair value in a range of roughly $8-$14 per share based on the current revenue base, the 3.5x EV/revenue multiple, and the fact that leverage still limits how much of the growth can flow through to equity. That range sits well below the $21-$25 analyst target band, and I think the gap reflects a more optimistic view of margin expansion than the current operating data supports. Forward EPS of $0.27 is still thin, so the market is paying for a future earnings step-up that has not yet shown up in the reported margins.
Leverage
BLZE — Leverage & Coverage (Quarterly)
| Metric | Value |
|---|---|
| Total Debt/Equity % (mrq) | 93.1 |
| Current Ratio (mrq) | 1 |
| Total Debt (mrq, USD Mil) | 82.4 |
| Operating Cash Flow (TTM, USD Mil) | 28.8 |
| Levered Free Cash Flow (TTM, USD Mil) | 33.5 |
| Net Debt/EBITDA (TTM) | 10.6 |
| FCF Margin % (TTM) | 21.4% |
Source: Yahoo Finance — Quarterly Financial Statements
Backblaze’s leverage is stretched, not broken: Total Debt/Equity % (mrq) was 93.1%, Current Ratio (mrq) was 1.0, and Total Debt (mrq, USD Mil) was $82.4M. Cash generation is positive but not strong enough to create much cushion, with Operating Cash Flow (TTM, USD Mil) of $28.8M and Levered Free Cash Flow (TTM, USD Mil) of $33.5M.
Net Debt/EBITDA (TTM) was 10.6x, which tells me debt is heavy relative to earnings power, while FCF Margin % (TTM) was 21.4%, showing the business does convert revenue into cash, but not at a level that makes the balance sheet comfortable. The company can absorb a modest downturn, but the current ratio of 1.0x leaves little room if EBITDA slips or refinancing conditions tighten.
Insider Activity
The insider transaction record I see here is limited to two open-market sales in the available window, with no open-market purchases recorded. The selling is concentrated in two insiders, both on 2026-05-20, so this is not broad-based activity across the leadership team, but it still leaves the record net seller-only. I read that as a mild negative because there is no offsetting insider buying to balance it.
Comparable Analysis
LF0 has published standalone analyses of these peers: DigitalOcean (DOCN) (rated Sell).
Growth
| Company | Revenue TTM (USD Mil) | Revenue Growth YoY % | EBITDA TTM (USD Mil) | Diluted EPS TTM |
|---|---|---|---|---|
| BLZE | 156.3 | 17.7% | 3.1 | -0.4 |
| RBRK | 1,542.2 | 37.9% | -263.2 | -1.3 |
| P | 4,262.1 | 37.7% | 384.1 | 0.7 |
| DBX | 2,531.6 | 0.9% | 830.1 | 1.8 |
| NTAP | 7,391 | 29.9% | 2,095 | 7.1 |
| DOCN | 1,011.1 | 28.6% | 308.6 | 2.2 |
Source: Yahoo Finance
BLZE’s revenue growth of 17.7% TTM is below RBRK’s 37.9%, P’s 37.7%, NTAP’s 29.9%, and DOCN’s 28.6%, but above DBX’s 0.9% TTM, so the market is paying for a mid-pack grower rather than a category leader. That discount looks justified because BLZE’s diluted EPS is still -0.4 TTM while RBRK and DOCN are also unprofitable but growing faster, which means BLZE has not yet earned a growth premium on either scale or earnings leverage.
Valuation
| Company | Current Share Price (USD) | Trailing P/E | Forward P/E | EV/Revenue | EV/EBITDA | Price/Sales (TTM) | Price/Book (mrq) | Market Cap (USD Mil) | Enterprise Value (USD Mil) | Beta (5Y Monthly) | FCF Yield % (TTM) | Forward EPS | Analyst Target Price – Low | Analyst Target Price – Mean | Analyst Target Price – High | # Analyst Opinions |
|---|---|---|---|---|---|---|---|---|---|---|---|---|---|---|---|---|
| BLZE | 8.3 | — | 30.9 | 3.5 | 178.8 | 3.3 | 5.8 | 516 | 549 | 1.57 | 6.5% | 0.3 | 21 | 22.8 | 25 | 6 |
| RBRK | 134.2 | — | 174.7 | 16.9 | -99.1 | 17.9 | -55.7 | 27,620 | 26,090 | 1.12 | 1.7% | 0.8 | 110 | 120.1 | 139 | 27 |
| P | 133.4 | 182.8 | 32 | 9.5 | 105 | 10.4 | 28.9 | 44,459 | 40,314 | 1.40 | -0.3% | 4.2 | 80 | 151.1 | 215 | 19 |
| DBX | 37.6 | 20.7 | 11.4 | 4.4 | 13.4 | 3.2 | -3.8 | 8,166 | 11,087 | 0.63 | 9.6% | 3.3 | 23 | 32.4 | 42 | 5 |
| NTAP | 223.2 | 31.5 | 20 | 5.6 | 19.7 | 5.9 | 29.3 | 43,834 | 41,282 | 1.45 | 2.7% | 11.2 | 170 | 211.7 | 300 | 16 |
| DOCN | 100.6 | 46.4 | 55 | 12 | 39.4 | 11.6 | 11.3 | 11,761 | 12,172 | 1.70 | -0.2% | 1.8 | 125 | 175.1 | 220 | 15 |
Source: Yahoo Finance
BLZE’s 6.5% FCF yield TTM is far better than RBRK’s 1.7%, NTAP’s 2.7%, DOCN’s -0.2%, and P’s -0.3%, which is the cleanest cheapness signal in this set because it shows cash generation despite a weak earnings line. On EV/revenue, BLZE at 3.5x sits below DBX at 4.4x, NTAP at 5.6x, P at 9.5x, DOCN at 12.0x, and RBRK at 16.9x, so the multiple is not demanding for a company with 17.7% revenue growth and $33.5M of free cash flow TTM.
Using the peer EV/revenue range of 3.5x to 16.9x on BLZE’s $156.3M revenue implies an enterprise value of about $548.8M to $2.6B; after subtracting $82.4M of debt and adding $49.9M of cash, that translates to roughly $8.0 to $40.8 per share, versus the actual $8.3 share price. Forward EPS of $0.27 for BLZE is far below DBX’s $3.3, P’s $4.2, NTAP’s $11.2, and DOCN’s $1.8, so the stock is not pricing in peer-level earnings power yet. In other words, the market is giving BLZE a valuation closer to a cash-generating mid-tier grower than to the higher-margin names, which is consistent with the leverage and margin gap discussed above.
Profitability
| Company | Operating Margin (TTM) | Net Margin (TTM) | Return on Assets (TTM) | Return on Equity (TTM) | Gross Margin (TTM) | EBITDA Margin (TTM) |
|---|---|---|---|---|---|---|
| BLZE | -6.7% | -13.1% | -3.5% | -24.3% | 62.3% | 2.0% |
| RBRK | -16.8% | -16.5% | -6.7% | — | 80.2% | -17.1% |
| P | 5.3% | 5.9% | 3.0% | 17.7% | 69.7% | 9.0% |
| DBX | 26.1% | 17.5% | 15.0% | — | 79.7% | 32.8% |
| NTAP | 26.7% | 19.2% | 11.7% | 114.8% | 70.6% | 28.3% |
| DOCN | 10.4% | 23.3% | 3.9% | 62.3% | 57.2% | 30.5% |
Source: Yahoo Finance
BLZE’s gross margin of 62.3% is below RBRK’s 80.2%, DBX’s 79.7%, P’s 69.7%, and NTAP’s 70.6%, while its operating margin of -6.7% and EBITDA margin of 2.0% lag every profitable peer and even trail DOCN’s 10.4% operating margin and 30.5% EBITDA margin. The gap looks more like a scale and opex problem than a cost-of-revenue problem, because BLZE’s gross margin is respectable but the business is still not converting that into operating profit.
Leverage
| Company | Total Debt/Equity % (mrq) | Current Ratio (mrq) | Total Debt (mrq, USD Mil) | Operating Cash Flow TTM (USD Mil) | Free Cash Flow TTM (USD Mil) | Net Debt/EBITDA (TTM) | FCF Margin % (TTM) |
|---|---|---|---|---|---|---|---|
| BLZE | 93.1 | 1 | 82.4 | 28.8 | 33.5 | 10.6 | 21.4% |
| RBRK | — | 1.6 | 1,149.6 | 337.1 | 479.8 | 2.3 | 31.1% |
| P | 14.6 | 1.5 | 225.3 | 427.8 | -114.3 | -2 | -2.7% |
| DBX | — | 1.1 | 3,975.4 | 980.5 | 783.1 | 3.4 | 30.9% |
| NTAP | 169.5 | 1.2 | 2,534 | 1,897 | 1,171.4 | -0.5 | 15.8% |
| DOCN | 212.5 | 1.3 | 1,977.9 | 310 | -23.8 | 3.9 | -2.4% |
Source: Yahoo Finance
BLZE’s total debt/equity of 93.1% and net debt/EBITDA of 10.6x are much heavier than DBX’s 3.4x, DOCN’s 3.9x, and RBRK’s 2.3x, while its FCF margin of 21.4% is solid but not enough to offset the balance-sheet risk. That combination says BLZE is financing growth with more leverage than the peer set, and the current ratio of 1.0x leaves little cushion if cash conversion slips, so the balance sheet is a real constraint rather than a competitive advantage.
Conclusion
I would put my rating as a Hold because Backblaze is growing revenue 17.5% year over year in Q2 2026, but it is still not converting that scale into durable profit. The most compelling strength is cash generation: free cash flow yield is 6.5% TTM, which gives the stock some support even though earnings are weak. The main risk is leverage, with net debt to EBITDA at 10.6x TTM and a current ratio of 1.0 mrq, so any slip in execution would quickly matter for refinancing and equity value.
I would raise my rating more towards a Buy if operating margin turns positive and stays there for two to three quarters, because that would show the company is finally absorbing overhead on a larger revenue base. A useful threshold is revenue above about $170M on a run-rate basis, which would be roughly 15% above FY2025 and, if paired with the current 62.3% gross margin, could add about $10M to $15M of annual gross profit before fixed costs. That would materially improve the path to sustained EBITDA and make the current 3.5x EV/revenue multiple easier to defend.
I would move from Hold to Sell if revenue growth slips back toward the low teens while EBITDA stays near breakeven, because then the stock would be leaning on a valuation rerating rather than operating proof. The other bear trigger is a service or data-center incident that hits retention, since the platform is the product here and the company still carries $82.4M of debt against only $28.8M of TTM operating cash flow. If that combination showed up, the current 6.5% FCF yield would look less like support and more like a warning that cash generation is being used to mask weak earnings quality.
Weighing both sides, I lean to the cautious case because the bull scenario needs a clean margin inflection that has not arrived yet, while the bear case only needs one operational slip or another quarter of margin stagnation. The stock can work if the company keeps scaling revenue and finally pushes operating profit through the line, but I do not see enough evidence that this has happened yet.
What to Watch Next
- Operating margin turning positive and holding for 2-3 quarters — would support a move toward Buy.
- Revenue run-rate above $170M — would improve the gross-profit base for fixed-cost absorption.
- Net debt/EBITDA staying near 10.6x or rising — would keep refinancing risk elevated.
- A service or data-center incident that hurts retention — would weaken the moat and the rating case.
- Q2/Q3 execution on B2 Overdrive and enterprise sales — would show whether up-market demand is translating into profit.
What’s your take? I rated Backblaze (BLZE) HOLD above — but the goal here is to get this right, not just to publish an opinion. What would you add to this analysis, or which risk or catalyst do you think I’m under- or over-weighting? Tell me in the comments.
Our track record: every directional call is tracked publicly on The Scorecard, and Stocks Covered lists every company we have rated and when.
Sources
- SEC 10-K Annual Report — filed 2026-03-10
- SEC 8-K Filing (2026-05-27)
- SEC 8-K Filing (2026-05-04)
- SEC 8-K Filing (2026-02-23)
- SEC Form 4 Insider Transaction (2026-06-01)
- SEC Form 4 Insider Transaction (2026-06-01)
- SEC Form 4 Insider Transaction (2026-06-01)
- SEC 10-K Annual Report — FY2026
- SEC 10-K Annual Report — FY2025
- SEC 10-K Annual Report — FY2024
- SEC 10-K Annual Report — FY2023
- SEC 10-K Annual Report — FY2022
Data sourced from Yahoo Finance and SEC EDGAR. Not investment advice.
Leave a Comment