| Company | Aug 25 | Sep 25 | Oct 25 | Nov 25 | Dec 25 | Jan 26 | Feb 26 | Mar 26 | Apr 26 | May 26 | Jun 26 | Jul 26 | 12-Mo |
|---|---|---|---|---|---|---|---|---|---|---|---|---|---|
| AES | +4% | -3% | +7% | +1% | +2% | +3% | +18% | -18% | +3% | +3% | -0% | +1% | +19% |
| DUK | +2% | +1% | +0% | +1% | -5% | +4% | +9% | +0% | -1% | -4% | +3% | -1% | +7% |
| BEP | -8% | +2% | +18% | -6% | -6% | +11% | +8% | +3% | +1% | +13% | -6% | -5% | +22% |
| NEE | +2% | +5% | +8% | +7% | -7% | +9% | +7% | -1% | +5% | -11% | +2% | -1% | +26% |
| SO | -2% | +3% | -1% | -2% | -4% | +2% | +10% | -1% | +0% | -4% | +4% | -1% | +3% |
| CEG | -11% | +7% | +15% | -3% | -3% | -21% | +18% | -15% | +12% | -8% | -14% | +6% | -24% |
Source: Yahoo Finance monthly adjusted close.
Executive Summary
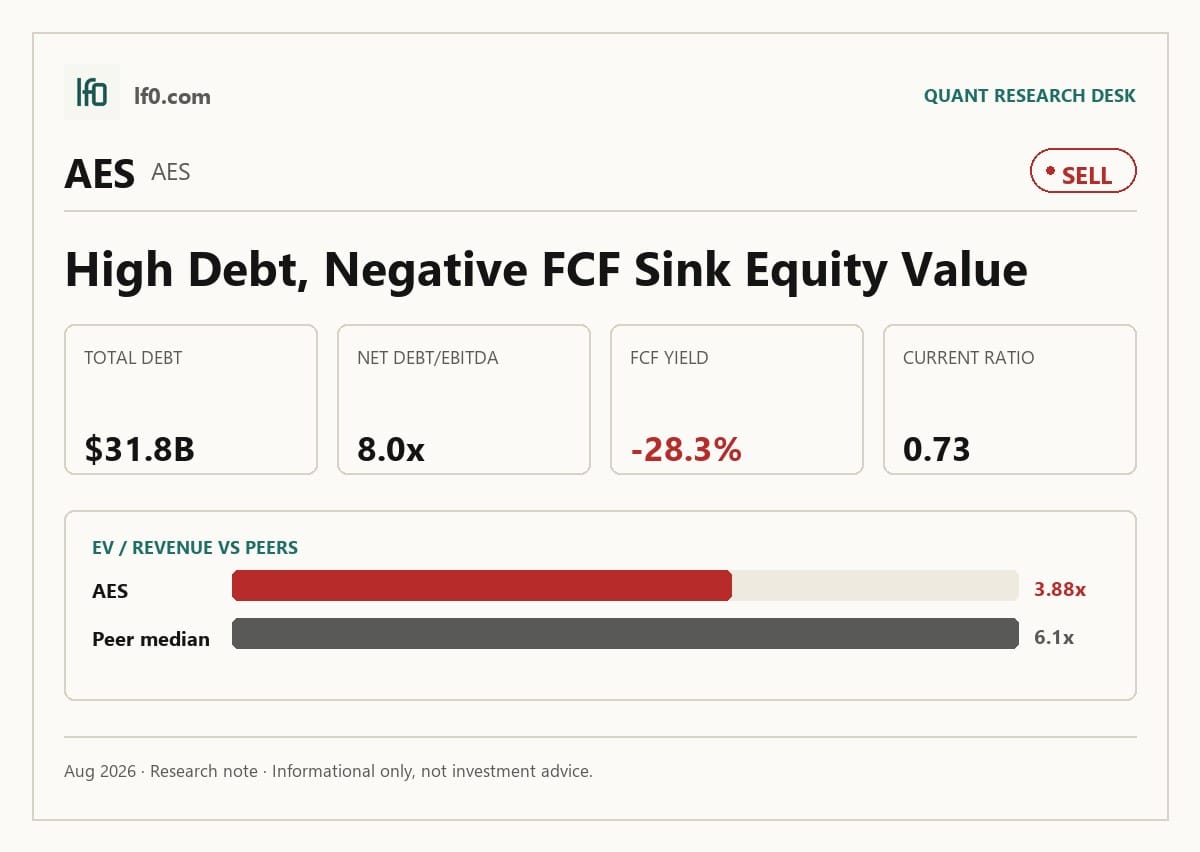
Rating: SELL | AES
Measured from adjusted close on 2026-08-03 to 2026-09-16. Sell ratings are correct when the stock falls; Hold is tracked as a +/-10% range. Daily-close data, not intraday. Calls are tracked for 182 days from publication, then frozen as a final record.
I would put my rating as a Sell because AES is still carrying a stretched balance sheet and negative free cash flow, so the equity depends on a recovery that has not yet shown up in the numbers. TTM levered free cash flow was -$3B and net debt/EBITDA was 8.0x, which tells me the market is paying for a turnaround in cash conversion rather than for current cash generation. The one thing that could change my view is a sustained move to positive levered free cash flow and net debt/EBITDA below 7.0x, meaning the buildout starts funding itself instead of leaning on debt.
Company Profile
AES is a global power company incorporated in 1981 and listed on the New York Stock Exchange under AES. It owns or operates 34,740 MW of generation and serves 27 million utility customers across six utility businesses, with revenue coming from long-term power purchase agreements, short-term wholesale sales, regulated utility tariffs, and energy-related services. Its 2025 backlog was 120 GW, including 5.7 GW under construction, and AES Clean Energy had a 46 GW development pipeline. The company operates in the United States, Chile, Argentina, Colombia, Panama, the Dominican Republic, Mexico, Bulgaria, Jordan, Vietnam, Puerto Rico, El Salvador, and the Netherlands, and it has 8,336 full-time employees.
Economic Moat
Business Model
The most defensible part of AES’s model is the long-dated contract backlog. At year-end 2025, the company had 120 GW of projects with signed contracts but not yet in operation, including 5.7 GW under construction, and it signed 4.0 GW of new renewables contracts in 2025. In my view, that is hard to replicate quickly because AES is not just selling power; it is repeatedly winning customized, on-time supply agreements for data centers and large mining customers, then funding those projects with long-term project-level financing and, where useful, Develop Transfer Agreements, or DTAs, which are contracts to develop an asset and transfer it before operation.
The regulated utility base is the second support. AES Indiana and AES Ohio operate under rate-setting frameworks that allow recovery of approved costs and returns, and AES Indiana’s 2025 Integrated Resource Plan and AES Ohio’s 3 Year Rate Plan both point to continued capital deployment with regulatory recovery. That combination of contracted growth and regulated cash flow is what gives the moat some durability, even if it is not a classic monopoly.
Business & Operating Risks
The biggest disclosed risk is leverage. The company says a substantial portion of operating cash flow must be used to service debt, and subsidiary distributions can be constrained by restricted payment covenants, foreign repatriation limits, or project-level defaults. AES also faces policy risk in U.S. renewables, where tax credits and other incentives have been curtailed by the passage of H.R. 1, the 2025 Act, while tariffs on solar cells, modules, batteries, and related equipment could reduce project returns or delay projects.
Operational risk is broad as well. The filing points to plant outages, fuel supply disruptions, hydrologic and wind variability, cyberattacks, and severe weather, and it specifically notes that hydro conditions hurt results in Panama in 2019 and Colombia in 2024. The battery storage warning is more specific: lithium-ion batteries can rapidly release energy by venting smoke and flames, which can damage nearby assets and interrupt operations. Taken together, these risks do not break the backlog-driven moat, but they do threaten the cash conversion and project execution that the moat depends on.
Management Discussion & Analysis
Management is still pushing capital into growth rather than into balance-sheet repair, and that is the right read on the filing. AES completed construction of 3.2 GW of renewables and energy storage in 2025 and signed long-term PPAs for another 4.0 GW of new renewable energy, so the buildout is real. At the same time, the company carried $31.8B of total debt at December 31, 2025, and parent company liquidity fell to $1.4B from $2B a year earlier, which tells me the growth program is not yet self-funding at the holding-company level.
The financing mix reinforces that point. AES raised $5.9B of non-recourse debt in 2025, issued $992M of preferred shares in subsidiaries, and sold $108M of business interests net of cash and restricted cash sold. Operating cash flow improved to $4.3B in 2025 from $2.8B in 2024, so management is not starved for cash at the operating line, but the gap between stronger operating cash flow and persistent debt-funded expansion keeps the capital allocation signal mixed. The risks above are therefore being managed, but not yet neutralized.
Recent Events
The most important development is the March 1, 2026 merger agreement with Horizon Parent, L.P., which would take AES private for $15 per share in cash and implies about $10.7B of equity value. That creates a clear cash exit for holders, but it also caps upside and shifts the stock from a fundamentals-driven utility and renewables platform to a deal-close process.
I also view the January 16, 2026 Maritza impairment as a real test of asset quality. AES flagged a $250M to $325M pre-tax charge tied to the Bulgaria plant’s PPA expiring in May 2026 and the decision not to convert the asset to another fuel source, which weakens confidence in the long-dated value of that generation asset even though current cash flows through May 2026 are not expected to change. The March 13 and March 16, 2026 credit amendments, followed by the April 14, 2026 management reshuffle and the April 29, 2026 annual meeting, all point in the same direction: AES is preparing the balance sheet and governance structure for a change of control.
Financial Analysis
Growth
AES — Financial Growth (Quarterly, USD Mil)
| Metric | 2024-12-31 | 2025-03-31 | 2025-06-30 | 2025-09-30 | 2025-12-31 | 2026-03-31 |
|---|---|---|---|---|---|---|
| REVENUE (USD Mil) | — | 2,926 | 2,855 | 3,351 | 3,101 | 3,180 |
| EBIT (USD Mil) | — | 320 | 391 | 675 | 96 | 595 |
| EBITDA (USD Mil) | — | 657 | 745 | 1,040 | 497 | 1,028 |
| NET INCOME (USD Mil) | — | 46 | -95 | 639 | 320 | 487 |
| DILUTED EPS | 0.8 | 0.1 | -0.1 | 0.9 | — | 0.7 |
Source: Yahoo Finance — Quarterly Financial Statements
AES’s revenue has been choppy rather than steadily rising. Revenue was $2.9B in Q1 2025, $2.9B in Q2 2025, $3.4B in Q3 2025, $3.1B in Q4 2025, and $3.2B in Q1 2026, so the latest quarter was up 8.7% year over year. EBITDA grew faster than revenue in Q1 2026, with $1B of EBITDA versus $657M in Q1 2025, while net income rose to $487M from $46M. I read that as a real improvement in operating momentum, but the quarter-to-quarter swings show that execution still matters more than headline growth.
Profitability
AES — Profitability (TTM)
| Metric | TTM |
|---|---|
| Operating Margin (TTM) | 18.7% |
| Net Margin (TTM) | 10.8% |
| Return on Assets (TTM) | 2.7% |
| Return on Equity (TTM) | 5.3% |
| Gross Margin (TTM) | 19.3% |
| EBITDA Margin (TTM) | 30.1% |
Source: Yahoo Finance — Trailing Twelve Months (TTM)
AES’s profitability profile is mixed, but the key signal is that it is still a capital-intensive utility and renewables platform rather than a mature cash machine. TTM operating margin was 18.7%, gross margin was 19.3%, and EBITDA margin was 30.1%, so the gap between gross and EBITDA margin shows heavy overhead, development, and financing drag even before below-the-line items. TTM net margin was 10.8%, which means a meaningful share of EBITDA is still being absorbed by depreciation, amortisation, and other non-operating charges. TTM return on assets was 2.7% and TTM return on equity was 5.3%, so returns are positive but modest; the ROE-to-ROA gap suggests leverage is amplifying equity returns rather than the business generating exceptional asset productivity on its own.
Valuation
AES — Valuation Multiples
| Metric | Value |
|---|---|
| Market Cap (USD Mil) | 10,469 |
| Enterprise Value (USD Mil) | 48,453 |
| Trailing P/E | 7.6 |
| Forward P/E | 6.2 |
| Price/Sales (TTM) | 0.8 |
| Price/Book (mrq) | 2.4 |
| EV/Revenue | 3.9 |
| EV/EBITDA | 12.9 |
| Beta (5Y Monthly) | 0.94 |
| FCF Yield % (TTM) | -28.3% |
| Forward EPS (USD) | 2.4 |
| Analyst Target Price – Low (USD) | 15 |
| Analyst Target Price – Mean (USD) | 15 |
| Analyst Target Price – High (USD) | 15 |
| # Analyst Opinions | 8 |
Source: Yahoo Finance
AES screens as a value and income name rather than a growth multiple story, but the negative cash flow profile makes that label less comfortable than it first sounds. FCF yield was -28.3% TTM because levered free cash flow was -$3B against a $10.5B market cap, so the equity is not being supported by cash generation today. Trailing P/E is 7.6x and forward P/E is 6.2x, with forward EPS of $2.4; price/sales is 0.8x, price/book is 2.4x, EV/revenue is 3.9x, and EV/EBITDA is 12.9x. The PEG ratio of 0.8x says the market is paying less than 1.0x for expected long-term earnings growth, but that only works if the company can turn its $31.8B debt load and 8.0x net debt/EBITDA into steadier earnings and cash flow.
On my read, fair value sits around $15 per share, which is also where the analyst target range sits, with 8 analyst opinions and a low/mean/high of $15. That consensus is unusually tight, so I do not see a meaningful disagreement between my view and the Street’s. The more important point is that the current valuation already assumes the company can convert the backlog into cleaner cash flow; if that conversion stalls, the multiple is not cheap enough to protect the equity.
Leverage
AES — Leverage & Coverage (Quarterly)
| Metric | Value |
|---|---|
| Total Debt/Equity % (mrq) | 259.6 |
| Current Ratio (mrq) | 0.7 |
| Total Debt (mrq, USD Mil) | 31,804 |
| Levered Free Cash Flow (TTM, USD Mil) | -2,965 |
| Net Debt/EBITDA (TTM) | 8 |
| FCF Margin % (TTM) | -23.7% |
Source: Yahoo Finance — Quarterly Financial Statements
AES carries $31.8B of total debt against a total debt/equity ratio of 259.6%, so leverage is still heavy even after the company’s 2025 earnings improvement. Current ratio is 0.7, which means near-term liquidity is tight and refinancing or working-capital needs cannot be ignored. Cash generation is mixed: operating cash flow was $5B TTM, but levered free cash flow was -$3B TTM and FCF margin was -23.7%, so EBITDA is not converting cleanly into residual cash because capex and other cash demands are absorbing it. Net debt/EBITDA of 8.0x reinforces that this is a highly levered balance sheet, not a flexible one.
Insider Activity
The insider transaction record I see here is one-sided: there were 0 open-market purchases and 1 open-market sale in the 2025-02-21 to 2026-05-15 window, so insiders are net sellers. The activity is also highly concentrated, with a single large sale rather than broad participation across multiple insiders, which weakens the alignment signal between management and outside shareholders.
Comparable Analysis
Growth
| Company | Revenue TTM (USD Mil) | Revenue Growth YoY % | Diluted EPS TTM |
|---|---|---|---|
| AES | 12,487 | 8.7% | 1.9 |
| DUK | 32,719 | 11.3% | 6.5 |
| BEP | 6,341 | -4.2% | -0.4 |
| NEE | 28,700 | 12.4% | 4.5 |
| SO | 30,179 | 0.1% | 4.2 |
| CEG | 29,867 | 63.8% | 11.5 |
Source: Yahoo Finance
AES’s revenue growth of 8.7% TTM sits below NEE’s 12.4% and DUK’s 11.3%, but above SO’s 0.1% and BEP’s -4.2%, so the company is growing faster than the slower regulated peers without matching the best-in-class utility expansion. CEG is the outlier at 63.8%, which makes AES look like a steadier utility compounder rather than a high-growth power name.
Valuation
| Company | Trailing P/E | Forward P/E | EV/Revenue | EV/EBITDA | Price/Sales (TTM) | Price/Book (mrq) | Market Cap (USD Mil) | Enterprise Value (USD Mil) | Beta (5Y Monthly) | FCF Yield % (TTM) | Forward EPS | Analyst Target Price – Low | Analyst Target Price – Mean | Analyst Target Price – High | # Analyst Opinions |
|---|---|---|---|---|---|---|---|---|---|---|---|---|---|---|---|
| AES | 7.6 | 6.2 | 3.9 | 12.9 | 0.8 | 2.4 | 10,469 | 48,453 | 0.94 | -28.3% | 2.4 | 15 | 15 | 15 | 8 |
| DUK | 19.3 | 17.5 | 5.8 | 11.5 | 3 | 1.8 | 97,785 | 189,848 | 0.37 | -2.3% | 7.2 | 131 | 138.8 | 146 | 19 |
| BEP | — | -18.4 | 13.1 | 26.9 | 2.5 | 2.5 | 16,019 | 83,034 | 1 | -66.5% | -1.8 | 20 | 36.3 | 42 | 12 |
| NEE | 19.5 | 19.7 | 10.4 | 20.5 | 6.3 | 3.3 | 181,281 | 299,662 | 0.67 | -9.8% | 4.4 | 55 | 99 | 116 | 19 |
| SO | 22.8 | 19.2 | 6.1 | 12.8 | 3.6 | 2.9 | 108,755 | 182,858 | — | -3.5% | 4.9 | 79 | 100.8 | 114 | 20 |
| CEG | 22.8 | 19.6 | 3.9 | 14.7 | 3.1 | 2.8 | 93,829 | 116,842 | 1.12 | -4.8% | 13.4 | 296 | 352.9 | 441 | 21 |
Source: Yahoo Finance
AES trades at 3.9x EV/revenue, 7.6x trailing P/E, 6.2x forward P/E, and a negative 28.3% FCF yield, versus DUK at 5.8x EV/revenue and 19.3x trailing P/E, NEE at 10.4x and 19.5x, SO at 6.1x and 22.8x, BEP at 13.1x and no meaningful trailing P/E, and CEG at 3.9x and 22.8x. On a pure sales multiple, AES is cheaper than every regulated peer except CEG, but the negative FCF yield and 8.0x net debt/EBITDA show the equity is still funding a heavy capital program, so the discount is justified rather than a clear bargain. That is why the market is not giving AES a growth premium even though the backlog is large: the balance sheet is still the constraint.
Profitability
| Company | Operating Margin (TTM) | Net Margin (TTM) | Return on Assets (TTM) | Return on Equity (TTM) | Gross Margin (TTM) | EBITDA Margin (TTM) |
|---|---|---|---|---|---|---|
| AES | 18.7% | 10.8% | 2.7% | 5.3% | 19.3% | 30.1% |
| DUK | 25.5% | 15.7% | 2.8% | 9.7% | 51.0% | 50.4% |
| BEP | 7.5% | 0.3% | 0.4% | 1.5% | 52.6% | 48.7% |
| NEE | 31.5% | 32.4% | 2.4% | 11.7% | 61.0% | 50.8% |
| SO | 25.5% | 15.4% | 3.2% | 11.5% | 48.3% | 47.3% |
| CEG | 21.9% | 12.7% | 4.2% | 16.1% | 23.3% | 26.6% |
Source: Yahoo Finance
AES’s 18.7% operating margin, 10.8% net margin, 19.3% gross margin, and 30.1% EBITDA margin all trail DUK’s 25.5%, 15.7%, 51.0%, and 50.4%, NEE’s 31.5%, 32.4%, 61.0%, and 50.8%, and SO’s 25.5%, 15.4%, 48.3%, and 47.3%. The gap is mostly structural and sits in gross margin, not just overhead, because AES’s 19.3% gross margin is far below the 48.3% to 61.0% range of the peers. That makes AES look like a lower-quality utility operator than DUK or NEE, even before leverage is considered.
Leverage
| Company | Total Debt/Equity % (mrq) | Current Ratio (mrq) | Total Debt (mrq, USD Mil) | Net Debt/EBITDA (TTM) | FCF Margin % (TTM) |
|---|---|---|---|---|---|
| AES | 259.6 | 0.7 | 31,804 | 8 | -23.7% |
| DUK | 161.5 | 0.7 | 91,209 | 5.4 | -6.9% |
| BEP | 106.1 | 0.7 | 37,394 | 11.2 | -167.9% |
| NEE | 161.7 | 0.5 | 110,197 | 7.4 | -61.9% |
| SO | 182.1 | 0.8 | 77,087 | 5.2 | -12.7% |
| CEG | 66.4 | 1.4 | 22,466 | 2.7 | -15.0% |
Source: Yahoo Finance
AES’s 259.6% debt/equity and 8.0x net debt/EBITDA are heavier than DUK’s 161.5% and 5.4x, SO’s 182.1% and 5.2x, and NEE’s 161.7% and 7.4x, while CEG is much cleaner at 66.4% and 2.7x. The 0.7 current ratio and -23.7% FCF margin show AES is still absorbing capex and working capital, so the balance sheet is a financing choice rather than a competitive advantage; it supports the buildout, but it also limits equity upside until cash conversion improves.
Conclusion
I would put my rating as a Sell because the backlog and the takeout process are not yet enough to offset the fact that AES is still funding growth with borrowed money. The key tension is that the business has real contracted visibility, but TTM levered free cash flow is still -$3B and net debt/EBITDA is 8.0x, so the numbers do not yet show the kind of self-funding profile that would justify a more constructive call.
I would raise my rating more towards a Buy if AES can turn levered free cash flow positive for two consecutive quarters and keep net debt/EBITDA below 7.0x, meaning the buildout starts paying for itself rather than just expanding the balance sheet. On the current revenue base of about $12.5B, lifting EBITDA margin from 30.1% to 33.1% would add roughly $375M of annual EBITDA, which would materially improve the deleveraging path and make the current valuation easier to justify. I would also want to see the $15 per share takeout price remain the floor, because if the deal closes that becomes the relevant equity value.
I would move from Sell to Hold if free cash flow stays negative but the merger process remains on track and the stock continues to trade close to the offer price, because then the downside is more about timing than about business deterioration. I would move from Sell to Hold if the company shows that the backlog is converting into cash faster than capex is consuming it, even before leverage is fully repaired.
Weighing both sides, I think the cash-flow repair case needs to show up first, and I do not yet see enough evidence that it will do so quickly. The takeout angle and backlog help the downside, but until the company proves that the buildout can translate into positive residual cash, I would stay at Sell rather than chase the upside.
What’s your take? I rated AES (AES) SELL above — but the goal here is to get this right, not just to publish an opinion. What would you add to this analysis, or which risk or catalyst do you think I’m under- or over-weighting? Tell me in the comments.
Sources
- SEC 10-K Annual Report — filed 2026-03-02
- SEC 8-K Filing (2026-04-30)
- SEC 8-K Filing (2026-04-16)
- SEC 8-K Filing (2026-03-19)
- SEC 8-K Filing (2026-03-02)
- SEC 8-K Filing (2026-01-16)
- SEC Form 4 Insider Transaction (2026-05-19)
- SEC Form 4 Insider Transaction (2026-05-01)
- SEC Form 4 Insider Transaction (2026-05-01)
- SEC 10-K Annual Report — FY2026
- SEC 10-K Annual Report — FY2025
- SEC 10-K Annual Report — FY2024
- SEC 10-K Annual Report — FY2023
- SEC 10-K Annual Report — FY2022
Data sourced from Yahoo Finance and SEC EDGAR. Not investment advice.
Leave a Comment