
| Company | Oct 25 | Nov 25 | Dec 25 | Jan 26 | Feb 26 | Mar 26 | Apr 26 | May 26 | Jun 26 | Jul 26 | Aug 26 | Sep 26 | 12-Mo |
|---|---|---|---|---|---|---|---|---|---|---|---|---|---|
| LYFT | -7% | +3% | -8% | -13% | -18% | -4% | +6% | -0% | +4% | +9% | +7% | -11% | -32% |
| HTZ | -25% | +2% | -2% | -5% | -7% | +2% | +38% | -15% | -58% | -30% | +43% | -26% | -75% |
| UHAL | -7% | -1% | -4% | +12% | -10% | -6% | +7% | +13% | +13% | +8% | -5% | -11% | +5% |
| CAR | -15% | -0% | -6% | -10% | -15% | +50% | +24% | -3% | -16% | -7% | +7% | -28% | -34% |
| UBER | -2% | -9% | -7% | -2% | -6% | -5% | +4% | -6% | +3% | -2% | +8% | -9% | -30% |
| R | -10% | +3% | +10% | -0% | +16% | -8% | +24% | -1% | +5% | -3% | -4% | -7% | +23% |
Source: Yahoo Finance monthly adjusted close.
Quick Thesis
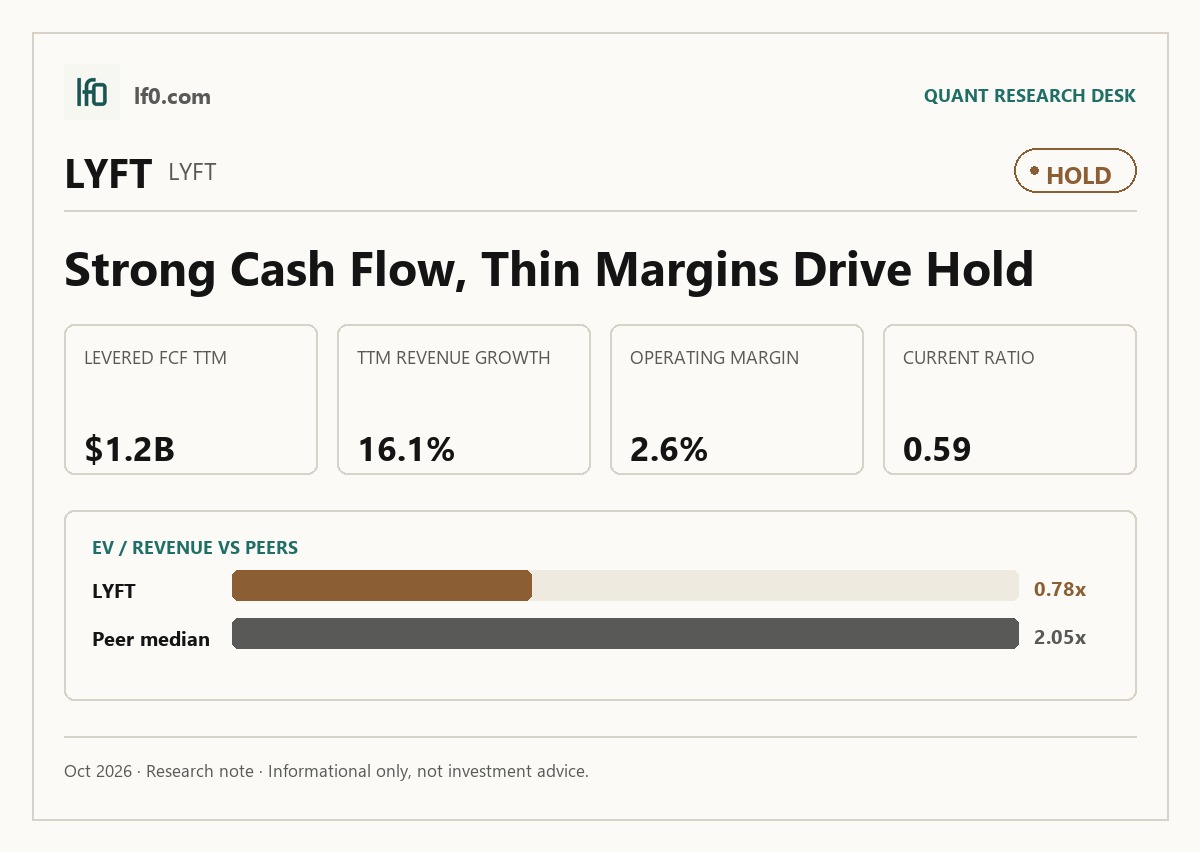
- Rated Hold — cash generation is solid, but operating margin is still only 2.6%.
- Strongest point: $1.2B of levered free cash flow TTM.
- Biggest risk: 42.7% debt/equity and a 0.6 current ratio leave little liquidity cushion.
- Valuation is fair to slightly cheap at 0.8x EV/revenue and 20.0% FCF yield.
- I would turn more constructive if operating margin stays in the low single digits for two quarters.
Executive Summary
Rating: HOLD | LYFT
We’ll begin tracking this call’s performance since publication once sufficient adjusted-close data is available.
I would put my rating as a Hold because Lyft is scaling revenue and cash flow, but it has not yet converted that scale into durable operating strength. The company’s 16.1% TTM revenue growth and 17.0% TTM FCF margin support the current valuation, yet the 2.6% TTM operating margin and 0.6 current ratio show that the business still has limited room for error.
The key tension is whether Lyft can turn the recent revenue reacceleration into a steadier margin profile. I would raise my rating more toward a Buy if EBITDA margin moves into the 3.0% to 4.0% range, meaning incremental bookings are finally dropping through to operating profit, and if that improvement holds for two quarters.
Company Profile
Lyft operates a mobility platform that earns most of its revenue from service fees and commissions on rides booked through the Lyft App. It also monetizes taxis, private hire vehicles, executive chauffeuring, car sharing, bikes and scooters, Express Drive rentals, Lyft Business, advertising, and licensing and data access agreements.
The company was incorporated in 2007 as Bounder Web, Inc., became Zimride, Inc. in 2008, and later became Lyft, Inc. after selling the Zimride assets. It expanded beyond its core North American ride-hailing base in 2025 through the Freenow and TBR Global Chauffeuring acquisitions, which broadened the platform into Europe and premium chauffeuring.
Economic Moat
Business Model
Lyft’s network density is the hardest part of the model for a well-funded competitor to copy quickly. In my view, the advantage comes from matching riders and drivers at scale, because the platform’s historical ride data and machine learning improve dispatch quality, arrival times, and supply-demand balance as usage deepens.
That network effect is reinforced by the app, the dispatch system, and the safety stack, including 24/7 live support, emergency help with ADT, and smart trip check-in. The patent portfolio helps at the margin, but I think the real moat is operational: a new entrant would need both rider density and driver density before it could match service quality.
Business & Operating Risks
The most material disclosed risk is driver classification litigation, which could force Lyft to alter its operating model, raise costs, or suspend service in affected jurisdictions. That risk is not abstract, because the filing points to class actions, representative actions, and thousands of individual claims.
Pricing pressure is the second major threat. Lyft says demand is highly sensitive to ride prices, driver incentives, and fees, and that makes the business vulnerable when competition or regulation forces higher driver payouts. Insurance exposure adds another layer, since claim severity and reserve pressure can move earnings quickly.
The Freenow and TBR acquisitions also introduce integration and regulatory complexity across more markets. I do not think these risks directly break the moat, but they do test it: the network advantage still matters, yet litigation and pricing pressure can keep that advantage from flowing cleanly into profit.
Management Discussion & Analysis
Management appears to be responding to those pressures with buybacks, international expansion, and a push for better operating leverage. The company repurchased $500M of Class A stock in 2025 and authorized another $1B in February 2026, which tells me management sees enough cash generation to return capital while still funding growth.
At the same time, the acquisition program shows that Lyft is still willing to spend for scale rather than simply harvest the existing platform. That is constructive for gross bookings, but it also means execution discipline matters more now that the business is more complex.
The operating numbers suggest some progress: 2025 revenue rose 9.0%, gross bookings rose 15.0%, and adjusted EBITDA rose 38.0%, while free cash flow reached $1.1B. I read that as management making real progress on monetization, even though insurance costs and acquisition integration still keep the margin story from looking fully settled.
Recent Events
The board refresh in January 2026 added Deborah Hersman, whose background in transportation safety and regulation strengthens oversight of a business that depends on trust. That matters because Lyft’s moat is not just network density; it also depends on rider confidence and regulatory credibility.
The February 2026 authorization of an additional $1B share repurchase program signals confidence in cash generation, but it also tells me management is prioritizing capital returns over a more aggressive balance-sheet reset. The June 2026 charter amendments were mostly housekeeping, yet they simplified governance and removed obsolete references, which is directionally positive.
Financial Analysis
Growth
LYFT — Financial Growth (Quarterly, USD Mil)
| Metric | 2025-03-31 | 2025-06-30 | 2025-09-30 | 2025-12-31 | 2026-03-31 | 2026-06-30 |
|---|---|---|---|---|---|---|
| REVENUE (USD Mil) | — | 1,588.2 | 1,685.2 | 1,592.7 | 1,650.5 | 1,843.5 |
| EBIT (USD Mil) | — | 49.4 | 48.9 | -142.8 | 25 | 83.9 |
| EBITDA (USD Mil) | — | 80 | 82.6 | -105.6 | 61.6 | 122.6 |
| NET INCOME (USD Mil) | — | 40.3 | 46.1 | 2,755.1 | 14.2 | 50.3 |
| DILUTED EPS | 0 | 0.1 | 0.1 | — | 0 | 0.1 |
Source: Yahoo Finance — Quarterly Financial Statements
Lyft’s revenue rose from $1.6B in Q1 2026 to $1.8B in Q2 2026, after $1.7B in Q3 2025 and $1.6B in Q4 2025, so the top line is improving but not in a straight line. Q2 2026 revenue was up 16.0% year over year, and EBITDA climbed to $122.6M from $80M a year earlier, which tells me the business is finally getting some operating leverage.
The Q4 2025 net income spike to $2.8B was tax-driven, not a clean operating step-up, so I would not treat it as evidence of a new earnings run rate. What matters more is that the recent quarters show better revenue momentum and better EBITDA conversion at the same time, which is the combination that can support a higher multiple if it persists.
Profitability
LYFT — Profitability (TTM)
| Metric | TTM |
|---|---|
| Operating Margin (TTM) | 2.6% |
| Net Margin (TTM) | 42.3% |
| Return on Assets (TTM) | -0.9% |
| Return on Equity (TTM) | 152.6% |
| Gross Margin (TTM) | 38.0% |
| EBITDA Margin (TTM) | 0.7% |
Source: Yahoo Finance — Trailing Twelve Months (TTM)
TTM gross margin of 38.0% shows the core marketplace still keeps a healthy spread before overhead. The problem is that EBITDA margin is only 0.7% and operating margin is 2.6%, so most of that gross profit is still being consumed by sales, product, and administrative costs.
Net margin of 42.3% is not a clean operating signal because it is inflated by the FY2025 deferred tax asset release. I place much more weight on the 2.6% operating margin and the -0.9% ROA, because those figures better reflect the underlying business than the accounting-driven net income line.
Valuation
LYFT — Valuation Multiples
| Metric | Value |
|---|---|
| Current Share Price (USD) | 15.2 |
| Market Cap (USD Mil) | 5,758 |
| Enterprise Value (USD Mil) | 5,255 |
| Trailing P/E | 2.2 |
| Forward P/E | 7.1 |
| Price/Sales (TTM) | 0.9 |
| Price/Book (mrq) | 1.9 |
| EV/Revenue | 0.8 |
| EV/EBITDA | 112.8 |
| Beta (5Y Monthly) | 1.84 |
| FCF Yield % (TTM) | 20.0% |
| Forward EPS (USD) | 2.2 |
| Analyst Target Price – Mean (USD) | 19.4 |
Source: Yahoo Finance
Lyft trades at 0.8x EV/revenue and 0.9x price/sales, which is low for a platform that is still growing revenue at a double-digit rate. The 20.0% FCF yield is the strongest valuation support in the set, while the 112.8x EV/EBITDA multiple is too distorted by a still-small EBITDA base to be a useful cheapness signal.
On the analysis here, I would put fair value in a range of roughly $15 to $22 per share. That sits around the current price and slightly below the $19.4 analyst mean target, which makes sense to me because the consensus appears to give more credit to margin expansion than I do at this stage. The company’s own forward EPS of $2.2 also implies a reasonable earnings base, but I think the market is still paying for cash generation before it fully pays for durable margin quality.
The valuation case is therefore balanced rather than aggressive. I do not see enough evidence to argue for a large premium, but I also do not see a reason to call the stock expensive when it is still producing real free cash flow and trading below the analyst mean.
Leverage
LYFT — Leverage & Coverage (Quarterly)
| Metric | Value |
|---|---|
| Total Debt/Equity % (mrq) | 42.7 |
| Current Ratio (mrq) | 0.6 |
| Total Debt (mrq, USD Mil) | 1,292.2 |
| Net Debt/EBITDA (TTM) | -10.8 |
| FCF Margin % (TTM) | 17.0% |
Source: Yahoo Finance — Quarterly Financial Statements
Lyft’s balance sheet is tighter than the cash flow profile suggests. Total debt was $1.3B, current ratio was 0.6, and debt/equity was 42.7%, so near-term liquidity is not generous even though the company is not highly levered in the classic sense.
The offset is that operating cash flow was $1.2B TTM and levered free cash flow was $1.2B TTM, which means the business is generating enough cash to fund operations and buybacks. Net debt/EBITDA was -10.8x, so cash exceeds debt and refinancing risk is low today, but the low current ratio still leaves less working-capital cushion than I would like.
Insider Activity
Insider activity has leaned toward selling. The recent open-market sales are concentrated, and the buying side is too small to offset them, so I read that as weaker alignment than I would prefer at this point in the cycle.
That said, the signal is not decisive on its own because insider ownership is already low. I treat it as a mild negative, not a thesis breaker.
Comparable Analysis
LF0 has published standalone analyses of these peers: Avis Budget (CAR) (rated Buy); Uber Technologies (UBER) (rated Hold); Ryder (R) (rated Hold).
Growth
| Company | Revenue TTM (USD Mil) | Revenue Growth YoY % | Diluted EPS TTM |
|---|---|---|---|
| LYFT | 6,771.9 | 16.1% | 7 |
| HTZ | 8,906 | 9.7% | -0.9 |
| UHAL | 6,089.4 | 3.2% | 0.1 |
| CAR | 11,711 | -1.3% | -18 |
| UBER | 55,227 | 12.2% | 4.5 |
| R | 12,819 | 5.0% | 12.3 |
Source: Yahoo Finance
Lyft’s 16.1% revenue growth outpaces Uber’s 12.2%, Hertz’s 9.7%, and Avis’s -1.3%, while also beating U-Haul’s 3.2% and Ryder’s 5.0%. That is a real growth advantage, but it is not so large that it alone justifies a premium multiple.
Valuation
| Company | Current Share Price (USD) | Trailing P/E | Forward P/E | EV/Revenue | EV/EBITDA | Price/Sales (TTM) | Price/Book (mrq) | Market Cap (USD Mil) | Enterprise Value (USD Mil) | Beta (5Y Monthly) | FCF Yield % (TTM) | Forward EPS | Analyst Target Price – Low | Analyst Target Price – Mean | Analyst Target Price – High | # Analyst Opinions |
|---|---|---|---|---|---|---|---|---|---|---|---|---|---|---|---|---|
| LYFT | 15.2 | 2.2 | 7.1 | 0.8 | 112.8 | 0.9 | 1.9 | 5,758 | 5,255 | 1.84 | 20.0% | 2.2 | 14 | 19.4 | 30 | 37 |
| HTZ | 1.7 | — | -19.4 | 2.4 | 56.8 | 0.1 | -1 | 617 | 21,069 | 2.31 | 239.3% | -0.1 | 1 | 2.2 | 3 | 6 |
| UHAL | 61 | 435.6 | 29.3 | 3.1 | 24.7 | 1.9 | 1.5 | 11,856 | 18,752 | 1.08 | -13.5% | 2.1 | 74 | 87.7 | 99 | 3 |
| CAR | 106.1 | — | 17.6 | 2.8 | 21.1 | 0.3 | -1.1 | 3,749 | 32,477 | 1.90 | 29.2% | 6 | 94 | 128.6 | 160 | 7 |
| UBER | 67.9 | 15 | 15.3 | 2.7 | 19.9 | 2.5 | 5.1 | 138,649 | 149,072 | 1.16 | 5.2% | 4.4 | 70 | 100.8 | 150 | 47 |
| R | 230.9 | 18.8 | 13.1 | 1.3 | 6.1 | 0.7 | 3.1 | 8,855 | 17,089 | 1 | 10.7% | 17.7 | 245 | 294.6 | 320 | 9 |
Source: Yahoo Finance
Lyft trades at 0.8x EV/revenue and 0.9x price/sales, below Uber at 2.7x and 2.5x, Ryder at 1.3x and 0.7x, and Avis at 2.8x and 0.3x. On FCF yield, Lyft’s 20.0% sits ahead of Uber’s 5.2% and Ryder’s 10.7%, though below Avis at 29.2%, which tells me the market is already rewarding Lyft for cash generation but not for a fully proven margin profile.
Using peer EV/revenue multiples on Lyft’s $6.8B TTM revenue implies a materially higher enterprise value than the current one, but I would discount that range because Lyft’s operating margin is still only 2.6%. In other words, the stock looks cheap on sales and cash flow, yet the market is not wrong to demand proof that the recent growth can turn into cleaner earnings.
Profitability
| Company | Operating Margin (TTM) | Net Margin (TTM) | Return on Assets (TTM) | Return on Equity (TTM) | Gross Margin (TTM) | EBITDA Margin (TTM) |
|---|---|---|---|---|---|---|
| LYFT | 2.6% | 42.3% | -0.9% | 152.6% | 38.0% | 0.7% |
| HTZ | 7.1% | -3.1% | 0.7% | — | 16.3% | 4.2% |
| UHAL | 15.1% | 1.0% | 1.3% | 0.8% | 28.5% | 12.5% |
| CAR | 14.9% | -5.4% | 2.7% | — | 27.4% | 13.1% |
| UBER | 13.3% | 17.3% | 6.9% | 37.2% | 40.8% | 13.5% |
| R | 8.5% | 3.9% | 3.9% | 16.7% | 19.8% | 21.7% |
Source: Yahoo Finance
Lyft’s 38.0% gross margin is respectable, but its 0.7% EBITDA margin and 2.6% operating margin trail Uber’s 13.5% and 13.3% by a wide margin. Ryder’s EBITDA margin is higher than Lyft’s as well, which shows that Lyft is still behind peers on operating efficiency even if the top line is growing faster.
The ROE figure of 152.6% is not a quality advantage in my view because it is distorted by a thin equity base. I care more about the operating margin gap, and that gap is still wide enough to justify caution.
Leverage
| Company | Total Debt/Equity % (mrq) | Current Ratio (mrq) | Total Debt (mrq, USD Mil) | Net Debt/EBITDA (TTM) | FCF Margin % (TTM) |
|---|---|---|---|---|---|
| LYFT | 42.7 | 0.6 | 1,292.2 | -10.8 | 17.0% |
| HTZ | — | 0.6 | 21,087 | 55.1 | 16.6% |
| UHAL | 106.3 | 1 | 8,145 | 9.3 | -26.4% |
| CAR | — | 0.8 | 29,125 | 18.6 | 9.3% |
| UBER | 51.9 | 0.8 | 14,731 | 1.2 | 13.1% |
| R | 293.6 | 0.6 | 8,453 | 3 | 7.4% |
Source: Yahoo Finance
Lyft’s net debt/EBITDA of -10.8x is much stronger than Uber’s 1.2x, Ryder’s 3.0x, Avis’s 18.6x, and Hertz’s 55.1x. That cash-rich position explains part of the valuation support, because investors are paying for balance-sheet safety as much as for the business itself.
The current ratio of 0.6 is the counterweight. It tells me the company has cash, but not a lot of near-term liquidity cushion, so the balance sheet is better than the headline ratio suggests but not as flexible as the free cash flow profile might imply.
Conclusion
I would put my rating as a Hold because Lyft is finally showing the combination I wanted to see — double-digit revenue growth and real free cash flow — but the margin profile is still too thin to call the stock a Buy. The recent quarters show better momentum, yet the 2.6% operating margin and 0.6 current ratio tell me the business is still one execution step away from looking fully self-sustaining.
What would change my view is a sustained margin step-up. I would raise the rating toward a Buy if EBITDA margin moves into the 3.0% to 4.0% range and stays there for two quarters, because that would show the recent revenue acceleration is translating into durable operating leverage rather than a temporary lift. I would also become more constructive if revenue growth stays above 15.0% for the next two quarters, since that would confirm the Q2 2026 pace is not a one-off.
The downside case is equally clear. If revenue growth falls back below 10.0% for a full quarter, or if operating margin slips back toward 1.0%, I would move the rating toward Sell because that would mean the cost base is again absorbing most of the gross profit. A drop in FCF margin below 12.0% would be another warning sign, since it would suggest the current 20.0% FCF yield is not durable.
For now, I think the bull case needs one more clean quarter than the bear case does. That is why I stay at Hold: the stock is not expensive enough to short, but the operating proof still has to catch up with the cash flow.
What to Watch Next
- EBITDA margin above 3.0% to 4.0% — would support a move toward Buy.
- Revenue growth above 15.0% for two more quarters — would confirm the recent acceleration.
- Operating margin near 1.0% or lower — would push the rating toward Sell.
- FCF margin below 12.0% — would signal the current cash yield is fading.
- Current ratio staying below 1.0 — would keep liquidity risk in focus.
What’s your take? I rated Lyft (LYFT) HOLD above — but the goal here is to get this right, not just to publish an opinion. What would you add to this analysis, or which risk or catalyst do you think I’m under- or over-weighting? Tell me in the comments.
Sources
- SEC 10-K Annual Report — filed 2026-02-11
- SEC 8-K Filing (2026-06-04)
- SEC 8-K Filing (2026-05-07)
- SEC 8-K Filing (2026-02-10)
- SEC 8-K Filing (2026-01-27)
- SEC Form 4 Insider Transaction (2026-06-05)
- SEC Form 4 Insider Transaction (2026-06-05)
- SEC Form 4 Insider Transaction (2026-06-05)
- SEC 10-K Annual Report — FY2026
- SEC 10-K Annual Report — FY2025
- SEC 10-K Annual Report — FY2024
- SEC 10-K Annual Report — FY2023
- SEC 10-K Annual Report — FY2022
Data sourced from Yahoo Finance and SEC EDGAR. Not investment advice.
Leave a Comment