
| Company | Sep 25 | Oct 25 | Nov 25 | Dec 25 | Jan 26 | Feb 26 | Mar 26 | Apr 26 | May 26 | Jun 26 | Jul 26 | Aug 26 | 12-Mo |
|---|---|---|---|---|---|---|---|---|---|---|---|---|---|
| UBER | +5% | -2% | -9% | -7% | -2% | -6% | -5% | +4% | -6% | +3% | -2% | +8% | -19% |
| LYFT | +36% | -7% | +3% | -8% | -13% | -18% | -4% | +6% | -0% | +4% | +9% | +7% | +4% |
| R | +1% | -10% | +3% | +10% | -0% | +16% | -8% | +24% | -1% | +5% | -3% | -4% | +33% |
| HTZ | +19% | -25% | +2% | -2% | -5% | -7% | +2% | +38% | -15% | -58% | -30% | +43% | -60% |
| UHAL | -1% | -7% | -1% | -4% | +12% | -10% | -6% | +7% | +13% | +13% | +8% | -5% | +17% |
Source: Yahoo Finance monthly adjusted close.
Quick Thesis
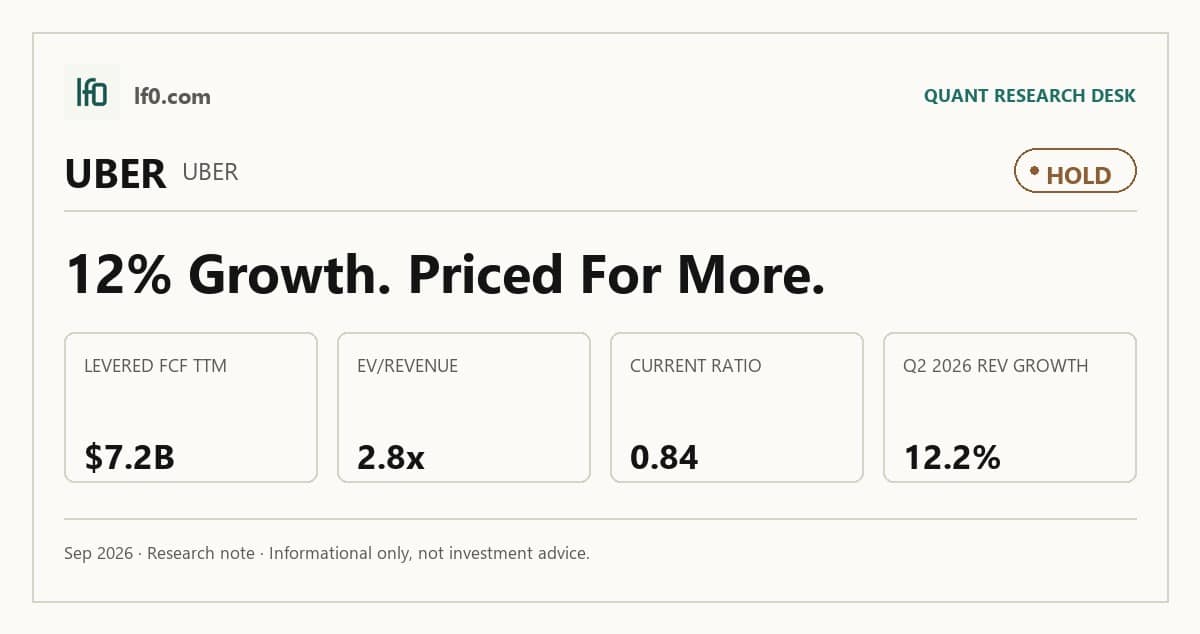
- Rated Hold because Uber is profitable, but the stock already prices in that progress.
- Strongest support is $7.2B of levered free cash flow TTM.
- Main risk is $14.7B of debt against a 0.8 current ratio.
- Valuation is fair to slightly expensive at 2.8x EV/Revenue and 20.7x EV/EBITDA.
- I would turn more constructive if operating margin stays above 13.0% and free cash flow stays above $7B.
Executive Summary
Rating: HOLD | UBER
Measured from adjusted close on n/a to 2026-09-18. Sell ratings are correct when the stock falls; Hold is tracked as a +/-10% range. Daily-close data, not intraday. Calls are tracked for 182 days from publication, then frozen as a final record.
I would put my rating as a Hold because Uber has already proven it can generate scale, margin, and cash, but the current valuation leaves too little room for execution mistakes. The company’s TTM operating margin is 13.3%, EBITDA margin is 13.5%, and levered free cash flow is $7.2B, which tells me the platform is working; the issue is that the market is already paying for that outcome at 2.8x EV/Revenue and 20.7x EV/EBITDA. I would turn more constructive if operating margin stays above 13.0% and free cash flow remains above $7B over the last year, because that would confirm the business is still converting scale into cash fast enough to support buybacks and absorb legal noise.
Company Profile
Uber Technologies, Inc. operates a multi-sided platform that connects riders with mobility drivers, consumers with couriers and merchants for delivery, and shippers with carriers for freight. It also offers Uber One, its cross-platform membership program, and marketplace advertising. As of December 31, 2025, it operated in over 70 countries and more than 15,000 cities, with principal exposure in the U.S. and Canada, LatAm, Europe, the Middle East, Africa, and APAC excluding China and Southeast Asia. The company has three reportable segments: Mobility, Delivery, and Freight. Uber had approximately 34,000 employees and supports payment activity through licensed subsidiaries in the EEA, the U.K., and Mexico.
Economic Moat
Business Model
Uber’s moat is the density of its marketplace, not any single product line. In my view, the proprietary routing, matching, and payments stack is hard for a well-funded rival to replicate quickly because every trip improves the network, and that effect compounds across more than 15,000 cities. Uber One adds stickiness by tying together 46 million members as of December 31, 2025, while advertising monetizes the same traffic without requiring a new customer to be acquired. That combination matters because the platform now earns from rides, delivery, freight, and ads, so one user can generate several revenue streams instead of one.
The business is also more integrated than it was a few years ago. Delivery is now a customer-acquisition engine, with approximately 58% of first-time Delivery consumers in the three months ended December 31, 2025 new to the platform, and that supports the idea that the network is broadening rather than fragmenting. I think that is a real structural advantage because it makes the platform less dependent on any single use case.
Business & Operating Risks
The most serious disclosed risk is driver reclassification. According to the risk factors in Uber’s SEC 10-K, more than 150,000 drivers in the United States have filed or said they will file arbitration demands, and several jurisdictions have already moved against the independent-contractor model, including California, France, Mexico, New Zealand, and Massachusetts. If drivers were treated as employees, Uber would absorb wage-and-hour costs, benefits, social security contributions, taxes, and penalties, which would directly pressure the marketplace economics that support the moat described above.
Competition is the second major threat. The filing names Bolt, Didi, Lyft, Ola, DoorDash, Instacart, Gopuff, Rappi, Delivery Hero, Just Eat Takeaway, Amazon, C.H. Robinson, Total Quality Logistics, RXO, XPO, Echo Global Logistics, and DHL, and the risk is straightforward: Uber may have to lower fares, reduce service fees, and raise driver incentives to defend share. Platform liquidity is another pressure point because Uber says it must attract and retain a critical mass of drivers, consumers, merchants, shippers, and carriers or the network becomes less appealing. I do not think these risks break the moat today, but they do threaten the managed-density advantage that makes the platform valuable in the first place.
Management Discussion & Analysis
Management is responding to those risks with cash generation, buybacks, and selective capital return rather than balance-sheet expansion. In 2025 Uber redeemed $700M of 2027 Senior Notes, $500M of 2028 Senior Notes, and $1.15B of 2025 Convertible Notes, while also authorizing an additional $20B for repurchases in July 2025. That tells me management is using the cash engine to lower refinancing risk and return capital, but it is not shrinking the liability base enough to call this a true deleveraging story.
The operating mix still favors Mobility and Delivery. 2025 gross bookings rose 19% to $193.5B and revenue rose 18% to $52B, while Freight gross bookings fell 1% on a weak freight cycle. I read that as evidence that the core platform is carrying the business, and the Freight segment is not yet a meaningful offset. The gap between revenue growth and expense growth is narrower than management would like, since sales and marketing rose $561M and research and development rose $293M in 2025, so scale is helping but not yet eliminating operating friction. The company is clearly trying to answer the risks above with cash generation and capital discipline, but the legal and labor overhangs remain unresolved.
Recent Events
The most important recent event is the CFO transition announced on February 4, 2026. Prashanth Mahendra-Rajah is stepping down on February 16, 2026, and Balaji Krishnamurthy is moving up from strategic finance to chief financial officer. I view that as continuity rather than disruption, because the handoff comes after Uber reached investment-grade status and launched its first share repurchase program.
The Türkiye deal disclosed on February 8, 2026 is more strategic. Uber agreed to buy 100% of Getir’s food delivery business for $335M in cash and to invest $100M for a 15% stake in Getir’s grocery, retail, and water delivery business, with the remaining portfolio tied to future performance conditions. I think that strengthens the delivery franchise because it adds scale in a market where Getir’s food delivery business generated more than $1B in gross bookings in 2025, although integration and regulatory execution still matter. The May 4, 2026 annual meeting and the May 11, 2026 people changes were more supportive than transformative, and they leave the moat intact rather than materially stronger.
Financial Analysis
Growth
UBER — Financial Growth (Quarterly, USD Mil)
| Metric | 2025-06-30 | 2025-09-30 | 2025-12-31 | 2026-03-31 | 2026-06-30 |
|---|---|---|---|---|---|
| REVENUE (USD Mil) | 12,651 | 13,467 | 14,366 | 13,203 | 14,191 |
| EBIT (USD Mil) | 1,612 | 2,732 | 406 | 604 | 3,404 |
| EBITDA (USD Mil) | 1,793 | 2,927 | 599 | 795 | 3,599 |
| NET INCOME (USD Mil) | 1,355 | 6,626 | 296 | 263 | 2,394 |
| DILUTED EPS | 0.6 | 3.1 | 0.1 | 0.1 | 1.2 |
Source: Yahoo Finance — Quarterly Financial Statements
Uber’s revenue rose from $12.7B in Q2 2025 to $14.4B in Q4 2025, slipped to $13.2B in Q1 2026, and then rebounded to $14.2B in Q2 2026. That pattern is still healthy, but it is not linear, so I would not read one soft quarter as a thesis break. EBITDA moved from $1.8B to $2.9B, then to $0.8B and back to $3.6B over the same span, which tells me operating leverage is improving even when revenue pauses. The Q4 2025 net income spike to $6.6B looks like a one-off swing rather than a recurring run rate, so I focus more on the underlying revenue and EBITDA trend than on that outlier.
Profitability
UBER — Profitability (TTM)
| Metric | TTM |
|---|---|
| Operating Margin (TTM) | 13.3% |
| Net Margin (TTM) | 17.3% |
| Return on Assets (TTM) | 6.9% |
| Return on Equity (TTM) | 37.2% |
| Gross Margin (TTM) | 40.8% |
| EBITDA Margin (TTM) | 13.5% |
Source: Yahoo Finance — Trailing Twelve Months (TTM)
TTM gross margin was 40.8%, EBITDA margin was 13.5%, operating margin was 13.3%, net margin was 17.3%, ROA was 6.9%, and ROE was 37.2%. The gross-to-operating gap is 27.4 percentage points, which tells me Uber has already moved beyond the phase where delivery and ride economics are being overwhelmed by cost of revenue. EBITDA and operating margin are close enough that depreciation and amortisation are not masking the picture in a material way, while the higher net margin reflects below-the-line items that I would not treat as the main proof point. ROE is far above ROA, so leverage is amplifying equity returns, but the core message is still positive: Uber is already solidly profitable on an operating basis. The key threshold I would watch is operating margin staying above 13.0% TTM, meaning the business is holding its earnings power rather than leaning on one-off items.
Valuation
UBER — Valuation Multiples
| Metric | Value |
|---|---|
| Current Share Price (USD) | 70.5 |
| Market Cap (USD Mil) | 144,000 |
| Enterprise Value (USD Mil) | 154,423 |
| Trailing P/E | 15.5 |
| Forward P/E | 16 |
| Price/Sales (TTM) | 2.6 |
| Price/Book (mrq) | 5.3 |
| EV/Revenue | 2.8 |
| EV/EBITDA | 20.7 |
| Beta (5Y Monthly) | 1.16 |
| FCF Yield % (TTM) | 5.0% |
| Forward EPS (USD) | 4.4 |
| Analyst Target Price – Low (USD) | 70 |
| Analyst Target Price – Mean (USD) | 101.2 |
| Analyst Target Price – High (USD) | 150 |
| # Analyst Opinions | 46 |
Source: Yahoo Finance
Uber trades at 2.8x EV/Revenue, 2.6x Price/Sales, 20.7x EV/EBITDA, and 15.5x trailing P/E, with a 5.0% FCF yield and a 16.0x forward P/E. At a current share price of $70.5, the market is paying for durable scale and continued monetization, not for a low-risk cash machine. I would put fair value in a range of roughly $70-$85 per share on the analysis here, which is close to the current price and below the $101 analyst mean target; that gap tells me the Street is somewhat more optimistic than I am about how quickly cash generation can compound from here. The company’s forward EPS is $4.41, and that sits well above Lyft’s $2.2 and Hertz’s negative $0.1 in the peer set, so Uber’s earnings base is stronger than the raw multiple alone suggests. Even so, the stock is not cheap enough for me to call it a Buy, because the valuation already assumes the margin and cash flow profile stays intact.
Leverage
UBER — Leverage & Coverage (Quarterly)
| Metric | Value |
|---|---|
| Total Debt/Equity % (mrq) | 51.9 |
| Current Ratio (mrq) | 0.8 |
| Total Debt (mrq, USD Mil) | 14,731 |
| Operating Cash Flow (TTM, USD Mil) | 10,424 |
| Levered Free Cash Flow (TTM, USD Mil) | 7,244.8 |
| Net Debt/EBITDA (TTM) | 1.2 |
| FCF Margin % (TTM) | 13.1% |
Source: Yahoo Finance — Quarterly Financial Statements
Uber’s leverage is moderate, but the liquidity cushion is thin. Total debt to equity was 51.9% in mrq, current ratio was 0.8, and total debt was $14.7B. Cash generation is strong: operating cash flow was $10.4B TTM and levered free cash flow was $7.2B TTM, with FCF margin at 13.1%. Net debt to EBITDA was 1.2x, which means debt is manageable relative to earnings power, but the sub-1.0 current ratio leaves less room for a short-term shock than I would want. In my view, that is manageable refinancing risk rather than distress risk, because Uber is converting earnings into cash at a healthy rate, yet the balance sheet would become more sensitive if growth slowed or legal costs rose.
Insider Activity
The insider transaction record I see here is heavily net selling: 10 open-market sales for $492.4M versus 2 purchases for $1.6M over 2025-01-16 to 2026-06-02. The activity is also concentrated, with one very large 10%+ owner sale dominating the tape rather than broad insider buying, which weakens alignment between insiders and outside shareholders. I would not overread one transaction, but the pattern does not give me a bullish signal.
Comparable Analysis
Growth
| Company | Revenue TTM (USD Mil) | Revenue Growth YoY % | EBITDA TTM (USD Mil) | Diluted EPS TTM |
|---|---|---|---|---|
| UBER | 55,227 | 12.2% | 7,474 | 4.6 |
| LYFT | 6,771.9 | 16.1% | 46.6 | 6.7 |
| R | 12,819 | 5.0% | 2,783 | 12.3 |
| HTZ | 8,906 | 9.7% | 371 | -0.9 |
| UHAL | 6,089.4 | 3.2% | 760.1 | 0.1 |
Source: Yahoo Finance
Uber’s revenue growth of 12.2% TTM sits below Lyft’s 16.1% and above Hertz’s 9.7% and U-Haul’s 3.2%, so the market is paying for a faster grower than the mature rental names but not for category leadership versus Lyft. I think that discount to Lyft is justified because Uber’s $55.2B revenue base is much larger, which makes 12.2% growth harder to sustain than Lyft’s $6.8B base. The growth profile is good, but it is not so dominant that it should command a much richer multiple on its own.
Valuation
| Company | Current Share Price (USD) | Trailing P/E | Forward P/E | EV/Revenue | EV/EBITDA | Price/Sales (TTM) | Price/Book (mrq) | Market Cap (USD Mil) | Enterprise Value (USD Mil) | Beta (5Y Monthly) | FCF Yield % (TTM) | Forward EPS | Analyst Target Price – Low | Analyst Target Price – Mean | Analyst Target Price – High | # Analyst Opinions |
|---|---|---|---|---|---|---|---|---|---|---|---|---|---|---|---|---|
| UBER | 70.5 | 15.5 | 16 | 2.8 | 20.7 | 2.6 | 5.3 | 144,000 | 154,423 | 1.16 | 5.0% | 4.4 | 70 | 101.2 | 150 | 46 |
| LYFT | 15.1 | 2.3 | 7 | 0.8 | 111.9 | 0.8 | 1.9 | 5,716 | 5,214 | 1.84 | 20.2% | 2.2 | 14 | 19.6 | 30 | 37 |
| R | 238.5 | 19.4 | 13.5 | 1.4 | 6.2 | 0.7 | 3.2 | 9,147 | 17,381 | 1 | 10.4% | 17.7 | 283 | 299.6 | 320 | 9 |
| HTZ | 1.8 | — | -20.4 | 2.4 | 56.9 | 0.1 | -1 | 649 | 21,101 | 2.31 | 227.5% | -0.1 | 1 | 2.2 | 3 | 6 |
| UHAL | 64.3 | 459.1 | 30.9 | 3.2 | 25.5 | 2.1 | 1.6 | 12,564 | 19,389 | 1.08 | -12.8% | 2.1 | 74 | 87.7 | 99 | 3 |
Source: Yahoo Finance
Uber’s FCF yield of 5.0% TTM is far below Lyft’s 20.2% and above U-Haul’s negative 12.8%, which means Uber is priced as a cash generator without the distress discount that weaker free-cash-flow names carry. On EV/Revenue, Uber at 2.8x trades above Lyft at 0.8x, Hertz at 2.4x, and below U-Haul at 3.2x, while its 16.0x forward P/E is above Lyft’s 7.0x and Hertz’s negative 20.4x but below U-Haul’s 30.9x. That mix says Uber is not cheap, but the premium is partly supported by its $4.41 forward EPS versus Lyft’s $2.2 and Hertz’s negative $0.1. Using the peer EV/Revenue range of 0.8x to 3.2x on Uber’s $55.2B of TTM revenue gives an implied enterprise value of about $42.1B to $176.9B, or roughly $18.1 to $84.8 per share after netting debt and cash and using the rounded share count; that range brackets the current share price, so I see the stock as fairly to slightly expensive rather than obviously stretched. The valuation premium is easier to justify because Uber’s leverage is lower than Hertz’s and far cleaner than U-Haul’s, so the market is not paying up for growth alone.
Profitability
| Company | Operating Margin (TTM) | Net Margin (TTM) | Return on Assets (TTM) | Return on Equity (TTM) | Gross Margin (TTM) | EBITDA Margin (TTM) |
|---|---|---|---|---|---|---|
| UBER | 13.3% | 17.3% | 6.9% | 37.2% | 40.8% | 13.5% |
| LYFT | 2.6% | 42.3% | -0.9% | 152.6% | 38.0% | 0.7% |
| R | 8.5% | 3.9% | 3.9% | 16.7% | 19.8% | 21.7% |
| HTZ | 7.1% | -3.1% | 0.7% | — | 16.3% | 4.2% |
| UHAL | 15.1% | 1.0% | 1.3% | 0.8% | 28.5% | 12.5% |
Source: Yahoo Finance
Uber’s operating margin of 13.3% TTM and EBITDA margin of 13.5% TTM are well above Lyft’s 2.6% operating margin and 0.7% EBITDA margin, and they also compare favorably with Hertz’s 7.1% operating margin and 4.2% EBITDA margin. Gross margin is 40.8%, versus 38.0% for Lyft, 19.8% for Rentokil, 16.3% for Hertz, and 28.5% for U-Haul, which points to Uber’s advantage coming more from scale and opex discipline than from a structurally better cost of revenue. That profitability edge matters because it helps explain why Uber can sustain a premium valuation even with a lower FCF yield than Lyft.
Leverage
| Company | Total Debt/Equity % (mrq) | Current Ratio (mrq) | Total Debt (mrq, USD Mil) | Operating Cash Flow TTM (USD Mil) | Free Cash Flow TTM (USD Mil) | Net Debt/EBITDA (TTM) | FCF Margin % (TTM) |
|---|---|---|---|---|---|---|---|
| UBER | 51.9 | 0.8 | 14,731 | 10,424 | 7,244.8 | 1.2 | 13.1% |
| LYFT | 42.7 | 0.6 | 1,292.2 | 1,195.1 | 1,153.1 | -10.8 | 17.0% |
| R | 293.6 | 0.6 | 8,453 | 2,450 | 949.2 | 3 | 7.4% |
| HTZ | — | 0.6 | 21,087 | 1,429 | 1,476 | 55.1 | 16.6% |
| UHAL | 106.3 | 1 | 8,145 | 1,826.5 | -1,604.8 | 9.3 | -26.4% |
Source: Yahoo Finance
Uber’s total debt to equity of 51.9% is higher than Lyft’s 42.7% but far below Rentokil’s 293.6% and U-Haul’s 106.3%, while its net debt to EBITDA of 1.2x is much cleaner than Rentokil’s 3.0x and U-Haul’s 9.3x and far better than Hertz’s 55.1x. That balance sheet profile is a financing choice, not a distress signal, and Uber’s 13.1% FCF margin also trails Lyft’s 17.0% but is far ahead of U-Haul’s negative 26.4%. In other words, Uber’s valuation premium is supported by a much stronger leverage profile than the most levered peers, which is why I do not think the stock should be judged on revenue growth alone.
Conclusion
The tension in this name is simple: Uber has already built a profitable, cash-generative platform, but the stock is not priced as if execution risk still matters. TTM operating margin is 13.3%, levered free cash flow is $7.2B, and net debt to EBITDA is 1.2x, so the business is strong enough to own; at the same time, 2.8x EV/Revenue and 20.7x EV/EBITDA leave limited room for disappointment if growth slows or legal costs rise.
I would raise my rating more towards a Buy if operating margin stays above 13.0% TTM and free cash flow remains above $7B over the last year, because that would show the platform is still converting scale into cash at a rate that can support buybacks and absorb legal noise. I would also want to see Mobility and Delivery continue to offset Freight weakness, since the current mix already shows the core platform can carry the business when one segment softens.
I would move from Hold to Sell if net debt to EBITDA rises above 2.0x, meaning leverage is no longer modest, or if operating margin falls below 12.0% TTM, which would signal that pricing, incentives, or legal costs are eating into the earnings base. If that happened while the $1.8B UK VAT dispute and driver reclassification cases stayed unresolved, I would treat the current multiple as too rich for the risk profile.
For now, I lean to Hold rather than Buy because the bull case is credible, but it needs proof in the next few quarters, not just a good platform narrative. The business is strong enough to own, yet the current price already gives it credit for that strength, so I want either a better entry point or another quarter of margin durability before moving higher.
What to Watch Next
- Operating margin above 13.0% TTM — would support a move toward Buy.
- Levered free cash flow above $7B TTM — would confirm cash conversion is still strong.
- Net debt to EBITDA above 2.0x — would raise balance-sheet risk materially.
- Freight staying weak while Mobility and Delivery hold up — would confirm the core platform is carrying the business.
- UK VAT and driver reclassification outcomes — adverse rulings would pressure the multiple.
What’s your take? I rated Uber Technologies (UBER) HOLD above — but the goal here is to get this right, not just to publish an opinion. What would you add to this analysis, or which risk or catalyst do you think I’m under- or over-weighting? Tell me in the comments.
Sources
- SEC 10-K Annual Report — filed 2026-02-13
- SEC 8-K Filing (2026-05-11)
- SEC 8-K Filing (2026-05-08)
- SEC 8-K Filing (2026-05-06)
- SEC 8-K Filing (2026-02-09)
- SEC 8-K Filing (2026-02-04)
- SEC 8-K Filing (2026-01-12)
- SEC Form 4 Insider Transaction (2026-06-04)
- SEC Form 4 Insider Transaction (2026-05-19)
- SEC Form 4 Insider Transaction (2026-05-19)
- SEC 10-K Annual Report — FY2026
- SEC 10-K Annual Report — FY2025
- SEC 10-K Annual Report — FY2024
- SEC 10-K Annual Report — FY2023
- SEC 10-K Annual Report — FY2022
Data sourced from Yahoo Finance and SEC EDGAR. Not investment advice.
Leave a Comment