
| Company | Sep 25 | Oct 25 | Nov 25 | Dec 25 | Jan 26 | Feb 26 | Mar 26 | Apr 26 | May 26 | Jun 26 | Jul 26 | Aug 26 | 12-Mo |
|---|---|---|---|---|---|---|---|---|---|---|---|---|---|
| PL | +83% | +4% | -12% | +66% | +27% | -3% | +16% | +32% | +38% | -35% | -38% | -3% | +180% |
| RKLB | -1% | +31% | -33% | +66% | +15% | -14% | -7% | +28% | +74% | -29% | -36% | -2% | +32% |
| LUNR | +20% | +13% | -20% | +71% | +17% | -13% | +13% | +37% | +73% | -51% | -42% | +24% | +75% |
| AVAV | +30% | +17% | -24% | -13% | +15% | -9% | -27% | +7% | +6% | -20% | -10% | -1% | -39% |
| RDW | +1% | -12% | -30% | +38% | +55% | -23% | -6% | +8% | +167% | -50% | -30% | +24% | +20% |
| MDA | — | — | — | — | — | — | — | +21% | +46% | -8% | -27% | -4% | +14% |
Source: Yahoo Finance monthly adjusted close.
Quick Thesis
- Rated hold — growth is strong, but the 15.4x EV/Revenue multiple already prices in a margin inflection.
- Revenue reached 116.1M in Q2 2026, up 58.1% year over year.
- The main risk is leverage: net debt/EBITDA is 7.6x, with dilution capacity still in the capital structure.
- Valuation is rich versus peers on revenue and price/sales, while earnings remain negative.
- I would turn more constructive if operating margin turns positive and quarterly revenue stays above 110M.
Executive Summary
Rating: SELL | PL
Measured from adjusted close on 2026-09-18 to 2026-09-18. Sell ratings are correct when the stock falls; Hold is tracked as a +/-10% range. Daily-close data, not intraday. Calls are tracked for 182 days from publication, then frozen as a final record.
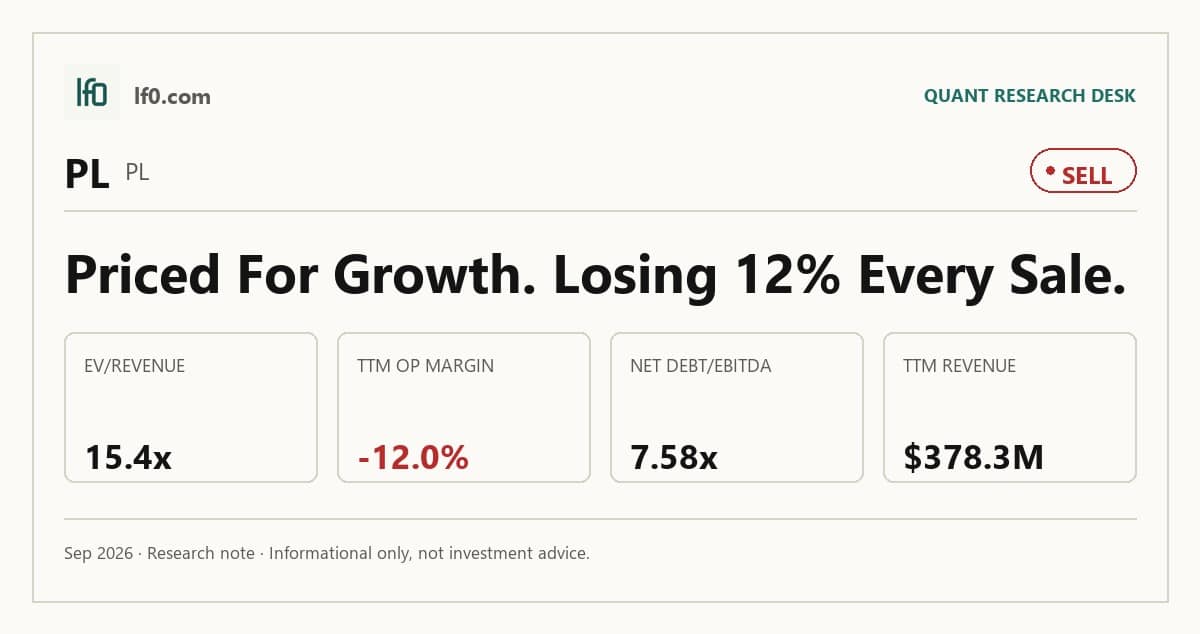
I would put my rating as a Hold because Planet Labs PBC is growing fast enough to justify attention, but not yet fast enough to justify its 15.4x EV/Revenue multiple on a business that still posted a -12.0% operating margin in TTM. The strongest point is revenue acceleration: Q2 2026 revenue reached 116.1M, up 58.1% year over year, and EBITDA turned positive at $3.6M, which tells me the model is finally showing operating leverage. The main risk is still leverage and dilution, with net debt/EBITDA at 7.6x and an at-the-market equity program that can access up to 1.5B of equity and forward-sale capacity, so per-share upside can be diluted even if the business improves. I would turn more constructive if operating margin moves into positive territory and Q3 2026 revenue stays above 110M, because that would show the recent inflection is holding.
Company Profile
Planet Labs PBC operates a commercial satellite imaging platform that collects daily Earth observation data and sells it through subscriptions, analytics, and government contracts. The company’s revenue mix is increasingly tied to defense, intelligence, and enterprise use cases, which gives it a broader addressable market than a pure imagery vendor. In my view, that mix matters because the business is trying to move from one-off image sales toward recurring data services, where customer retention and contract duration should matter more than single-quarter volume.
Economic Moat
Business Model
Planet’s structural advantage is the scale of its satellite fleet and the frequency of its revisit data, which I feel is harder to replicate quickly than a single-product software workflow. The moat is not a classic software network effect, but it does come from a data asset that improves as coverage, cadence, and customer integration deepen. That is why the company’s defense and analytics push matters: if customers build workflows around Planet’s imagery, switching costs rise even if the underlying hardware remains capital intensive.
Business & Operating Risks
The biggest disclosed risks are customer concentration, government dependence, launch and satellite failure risk, and export-control exposure. Two customers accounted for 13.0% and 12.0% of revenue in FY2026, and one customer represented 33.0% of accounts receivable, so a slip at a large account would hit both revenue and working capital. The filing also says government contracts can be terminated or modified for convenience, and launch or in-orbit failures can take months to replace. Those risks do threaten the moat, but more through execution and concentration than through any obvious collapse in the underlying data advantage.
Management Discussion & Analysis
Management is responding to those risks by leaning harder into defense, analytics, and larger multi-year contracts, while also preserving financing flexibility. The June 5, 2026 equity distribution agreement gives the company access to up to 1.5B of at-the-market equity and forward-sale capacity, which addresses liquidity risk but also keeps dilution on the table. In my view, the company is actively trying to reduce customer concentration through larger strategic accounts, yet the unresolved tension is that this strategy still requires heavy capital spending before it can prove self-funding economics.
Recent Events
The most important recent event was the Swedish Armed Forces agreement, under which Planet will build and operate a Pelican constellation owned by the customer while retaining licensing rights to imagery from those satellites. I read that as strategically important because it validates the defense product, but it also shows the company is taking on more operational responsibility to win larger contracts. The warrant redemption cleaned up the capital structure, and the recent 8-Ks were otherwise consistent with a company prioritizing financing flexibility and contract expansion over balance-sheet repair.
Financial Analysis
Growth
PL — Financial Growth (Quarterly, USD Mil)
| Metric | 2025-07-31 | 2025-10-31 | 2026-01-31 | 2026-04-30 | 2026-07-31 |
|---|---|---|---|---|---|
| REVENUE (USD Mil) | 73.4 | 81.3 | 86.8 | 94.2 | 116.1 |
| EBIT (USD Mil) | -21.8 | -57.4 | -148.4 | -136.4 | -7.2 |
| EBITDA (USD Mil) | -11.2 | -47.5 | -138.2 | -125.2 | 3.6 |
| NET INCOME (USD Mil) | -22.6 | -59.2 | -152.5 | -138.9 | -9.4 |
| DILUTED EPS | -0.1 | -0.2 | -0.5 | -0.4 | 0 |
Source: Yahoo Finance — Quarterly Financial Statements
Revenue rose from 73.4M in Q2 2025 to 116.1M in Q2 2026, and the sequence of quarterly gains shows the business is still accelerating rather than plateauing. EBITDA improved from a loss of 125.2M in Q1 2026 to a gain of $3.6M in Q2 2026, which is the key inflection I care about because it suggests the top line is finally starting to pull operating leverage through the model. That said, the company is still not at a point where one positive quarter proves durability, so I would want to see the next quarter confirm that the inflection is real.
Profitability
PL — Profitability (TTM)
| Metric | TTM |
|---|---|
| Operating Margin (TTM) | -12.0% |
| Net Margin (TTM) | -95.1% |
| Gross Margin (TTM) | 55.5% |
| EBITDA Margin (TTM) | -12.8% |
Source: Yahoo Finance — Trailing Twelve Months (TTM)
TTM gross margin was 55.5%, but operating margin was -12.0% and EBITDA margin was -12.8%, so the product layer is healthy while overhead still absorbs too much of the gross profit. Net margin was -95.1%, which tells me below-the-line items remain the real drag on equity value, not just cost of revenue. Return on assets was -5.0% and return on equity was -72.0%, so the capital base is still not earning an economic return. The important cross-check is that the gross margin strength does support the moat thesis, but the company has not yet converted that into durable earnings power.
Valuation
PL — Valuation Multiples
| Metric | Value |
|---|---|
| Current Share Price (USD) | 16.2 |
| Market Cap (USD Mil) | 5,893 |
| Enterprise Value (USD Mil) | 5,815 |
| Forward P/E | -12,956 |
| Price/Sales (TTM) | 15.6 |
| Price/Book (mrq) | 13 |
| EV/Revenue | 15.4 |
| FCF Yield % (TTM) | 0.9% |
| Forward EPS (USD) | 0 |
| Analyst Target Price – Low (USD) | 22 |
| Analyst Target Price – Mean (USD) | 34 |
| Analyst Target Price – High (USD) | 50 |
| # Analyst Opinions | 11 |
Source: Yahoo Finance
I would put fair value in a range of roughly $12-$20 per share based on the current revenue base, the company’s leverage, and the fact that the market is already assigning a premium multiple to a still-loss-making business. That range sits below the $22–$50 analyst target band, and in my view the gap reflects the market’s willingness to pay for a longer-dated margin story that has not yet shown up in the income statement. Forward EPS is effectively zero, so the -12,956.0x forward P/E is not a meaningful earnings anchor; I would rather use revenue and cash generation until earnings turn positive. On that basis, the stock looks rich rather than cheap, especially because the 15.4x EV/Revenue multiple is being applied before the company has proven sustained operating leverage.
Leverage
PL — Leverage & Coverage (Quarterly)
| Metric | Value |
|---|---|
| Total Debt/Equity % (mrq) | 88.4 |
| Current Ratio (mrq) | 2.8 |
| Total Debt (mrq, USD Mil) | 498.6 |
| Net Debt/EBITDA (TTM) | 7.6 |
| FCF Margin % (TTM) | 13.7% |
Source: Yahoo Finance — Quarterly Financial Statements
Planet Labs carries $498.6M of total debt against a 2.8x current ratio and $865.4M of cash, so liquidity is adequate even though the capital structure is still levered. Net debt/EBITDA is 7.6x, which is manageable only if EBITDA keeps improving; if the recent quarter proves temporary, that leverage will matter much more quickly than the cash balance suggests. Levered free cash flow was $51.8M TTM and FCF margin was 13.7%, which tells me the business is generating cash, but not enough yet to make the balance sheet a source of real strategic flexibility.
Insider Activity
The insider record is net selling, with 10 open-market sales versus 1 open-market purchase across the parsed Form 4 filings. The concentration in senior insiders, including the CEO and CFO, makes the signal more meaningful than scattered small trades. I would not overread it alone, but it does not help the bull case.
Comparable Analysis
Growth
| Company | Revenue TTM (USD Mil) | Revenue Growth YoY % | Diluted EPS TTM |
|---|---|---|---|
| PL | 378.3 | 58.1% | -1.1 |
| RKLB | 769.1 | 62.0% | -0.3 |
| LUNR | 490.1 | 309.8% | -0.9 |
| AVAV | 2,002.7 | 5.7% | -4.1 |
| RDW | 426.3 | 89.6% | -1.2 |
| MDA | 1,871.6 | 33.6% | 0.6 |
Source: Yahoo Finance
Planet’s 58.1% revenue growth puts it in the fast-growth tier, but not at the top of the group. RKLB grew 62.0%, RDW grew 89.6%, and LUNR grew 309.8%, while MDA grew 33.6% on a much larger base. I think Planet’s growth is good enough to support investor interest, but not so exceptional that it should automatically command the richest multiple.
Valuation
| Company | Current Share Price (USD) | Trailing P/E | Forward P/E | EV/Revenue | EV/EBITDA | Price/Sales (TTM) | Price/Book (mrq) | Market Cap (USD Mil) | Enterprise Value (USD Mil) | FCF Yield % (TTM) | Forward EPS | Analyst Target Price – Low | Analyst Target Price – Mean | Analyst Target Price – High | # Analyst Opinions |
|---|---|---|---|---|---|---|---|---|---|---|---|---|---|---|---|
| PL | 16.2 | — | -12,956 | 15.4 | -120.1 | 15.6 | 13 | 5,893 | 5,815 | 0.9% | 0 | 22 | 34 | 50 | 11 |
| RKLB | 64 | — | 1,404.3 | 49.9 | -255.2 | 53.2 | 11 | 40,910 | 38,412 | -0.6% | 0 | 64 | 109.4 | 150 | 19 |
| LUNR | 13.8 | — | -89.2 | 7.9 | -52.1 | 4.5 | -8.1 | 2,219 | 3,878 | -3.6% | -0.2 | 13 | 29.5 | 43 | 8 |
| AVAV | 160.6 | — | 35.9 | 4.3 | 39 | 4.1 | 1.8 | 8,162 | 8,543 | -0.3% | 4.5 | 148.6 | 219.3 | 315 | 19 |
| RDW | 10.7 | — | -31.5 | 5.7 | -19.9 | 6.3 | 1.6 | 2,677 | 2,409 | -1.0% | -0.3 | 8 | 14.7 | 20 | 8 |
| MDA | 29.2 | 51.3 | 18.9 | 2.6 | 22.9 | 2.5 | 3.8 | 4,735 | 4,909 | -3.0% | 1.5 | 40.8 | 46.3 | 49.7 | 3 |
Source: Yahoo Finance
Planet trades at 15.4x EV/Revenue and 15.6x price/sales, versus LUNR at 7.9x and 4.5x, RDW at 5.7x and 6.3x, and MDA at 2.6x and 2.5x. RKLB is much more expensive at 49.9x EV/Revenue and 53.2x price/sales, but it also has a larger revenue base and a different investor base. On my read, Planet’s valuation sits above the cheaper peers without the profitability to justify that premium yet, and the stock’s 66.1% 1-year return suggests the market has already moved ahead of the earnings evidence.
Profitability
| Company | Operating Margin (TTM) | Net Margin (TTM) | Return on Assets (TTM) | Return on Equity (TTM) | Gross Margin (TTM) | EBITDA Margin (TTM) |
|---|---|---|---|---|---|---|
| PL | -12.0% | -95.1% | -5.0% | -72.0% | 55.5% | -12.8% |
| RKLB | -24.6% | -21.5% | -4.6% | -7.9% | 37.3% | -19.6% |
| LUNR | -18.1% | -26.6% | -5.5% | -30.8% | 16.4% | -15.2% |
| AVAV | -2.3% | -10.1% | -0.1% | -4.6% | 26.5% | 10.9% |
| RDW | -18.9% | -57.3% | -6.1% | -18.2% | 22.7% | -28.4% |
| MDA | 6.1% | 5.7% | 2.8% | 6.7% | 28.6% | 11.4% |
Source: Yahoo Finance
Planet’s operating margin is -12.0%, net margin is -95.1%, and EBITDA margin is -12.8%, while gross margin is 55.5%. That is better than RKLB on gross margin but worse than AVAV and MDA on the margins that matter most for equity value. The comparison tells me Planet has a viable product engine, but it still lacks the operating discipline that would make the current valuation feel earned.
Leverage
| Company | Total Debt/Equity % (mrq) | Current Ratio (mrq) | Total Debt (mrq, USD Mil) | Operating Cash Flow TTM (USD Mil) | Free Cash Flow TTM (USD Mil) | Net Debt/EBITDA (TTM) | FCF Margin % (TTM) |
|---|---|---|---|---|---|---|---|
| PL | 88.4 | 2.8 | 498.6 | 117.6 | 51.8 | 7.6 | 13.7% |
| RKLB | 3.8 | 5.5 | 133.7 | -222.5 | -252 | 14.4 | -32.8% |
| LUNR | 52.8 | 1.7 | 481.4 | -126.3 | -80 | -1.5 | -16.3% |
| AVAV | 19.4 | 4.3 | 850.8 | 58.8 | -25.9 | 1.2 | -1.3% |
| RDW | 5.5 | 3.9 | 90.3 | -76.2 | -26 | 3.8 | -6.1% |
| MDA | 20 | 0.8 | 378.3 | 55.2 | -142.6 | -0.1 | -7.6% |
Source: Yahoo Finance
Planet’s debt/equity ratio of 88.4% is higher than RKLB’s 3.8%, AVAV’s 19.4%, RDW’s 5.5%, and MDA’s 20.0%, so it is not the cleanest balance sheet in the group. Its 7.6x net debt/EBITDA is better than RKLB’s 14.4x but worse than RDW’s 3.8x, and the $865.4M cash balance softens the raw debt load. In my view, the market is paying for growth and cash runway here, not for balance-sheet safety.
Conclusion
The tension in this name is straightforward: Planet is finally showing operating leverage, but the stock already trades as if that improvement will continue without interruption. I would put my rating as a Hold because the latest quarter was encouraging, yet the company still needs to prove that 116.1M of quarterly revenue and positive EBITDA are the start of a durable trend rather than a single good print.
I would raise my rating more towards a Buy if revenue stays above 110M in the next quarter and operating margin moves into positive territory, because that would show the business is converting scale into earnings rather than just buying growth. If EBITDA turns positive again and the company can hold that while keeping leverage from drifting higher, I would have more confidence that the current 15.4x EV/Revenue multiple is being supported by fundamentals rather than sentiment.
The bear case is that growth normalizes before profitability does, which would leave the company with a rich multiple and a still-levered balance sheet. If quarterly revenue slips back toward the low-90M range and net debt/EBITDA stays near 7.6x, I would become more cautious because the market would be paying for a margin inflection that has not yet held. I would also watch dilution closely, since the 1.5B equity and forward-sale capacity gives management flexibility but can cap per-share upside if it is used aggressively.
Weighing both sides, I still lean Hold. The business is improving, but the burden of proof remains on management to show that the recent acceleration can persist long enough to justify the valuation and the leverage.
What to Watch Next
- Quarterly revenue above 110M — would support a more constructive view.
- Operating margin turning positive — would show the model is converting scale into profit.
- EBITDA staying positive for a second straight quarter — would confirm the inflection.
- Net debt/EBITDA staying near 7.6x or lower — would keep leverage from becoming the main bear case.
- Heavy use of the 1.5B equity and forward-sale capacity — would increase dilution risk.
What’s your take? I rated Planet Labs (PL) SELL above — but the goal here is to get this right, not just to publish an opinion. What would you add to this analysis, or which risk or catalyst do you think I’m under- or over-weighting? Tell me in the comments.
Sources
- SEC 10-K Annual Report — filed 2026-03-23
- SEC 8-K Filing (2026-06-05)
- SEC 8-K Filing (2026-06-04)
- SEC 8-K Filing (2026-05-04)
- SEC 8-K Filing (2026-03-27)
- SEC 8-K Filing (2026-03-19)
- SEC 8-K Filing (2026-02-05)
- SEC Form 4 Insider Transaction (2026-04-24)
- SEC Form 4 Insider Transaction (2026-04-24)
- SEC Form 4 Insider Transaction (2026-04-17)
- SEC 10-K Annual Report — FY2025
- SEC 10-K Annual Report — FY2024
- SEC 10-K Annual Report — FY2023
- SEC 10-K Annual Report — FY2022
Data sourced from Yahoo Finance and SEC EDGAR. Not investment advice.
Leave a Comment