| Company | Aug 25 | Sep 25 | Oct 25 | Nov 25 | Dec 25 | Jan 26 | Feb 26 | Mar 26 | Apr 26 | May 26 | Jun 26 | Jul 26 | 12-Mo |
|---|---|---|---|---|---|---|---|---|---|---|---|---|---|
| NGL | +27% | +11% | +8% | +52% | +2% | +18% | +2% | +3% | +31% | +6% | -7% | +3% | +286% |
| PAGP | -2% | -5% | -3% | +7% | +3% | +9% | +10% | +8% | +1% | +1% | -0% | +10% | +45% |
| GLP | +3% | -10% | -6% | -1% | -5% | +13% | +1% | -10% | +15% | -0% | -2% | +6% | +1% |
| PAA | -1% | -5% | -1% | +6% | +3% | +9% | +9% | +7% | +3% | -1% | -1% | +12% | +46% |
| TRGP | +1% | -0% | -7% | +14% | +5% | +9% | +17% | +6% | +4% | -2% | +5% | +1% | +66% |
| MPLX | -1% | -2% | +2% | +9% | -2% | +5% | +8% | -3% | -1% | -1% | +3% | +4% | +20% |
Source: Yahoo Finance monthly adjusted close.
Quick Thesis
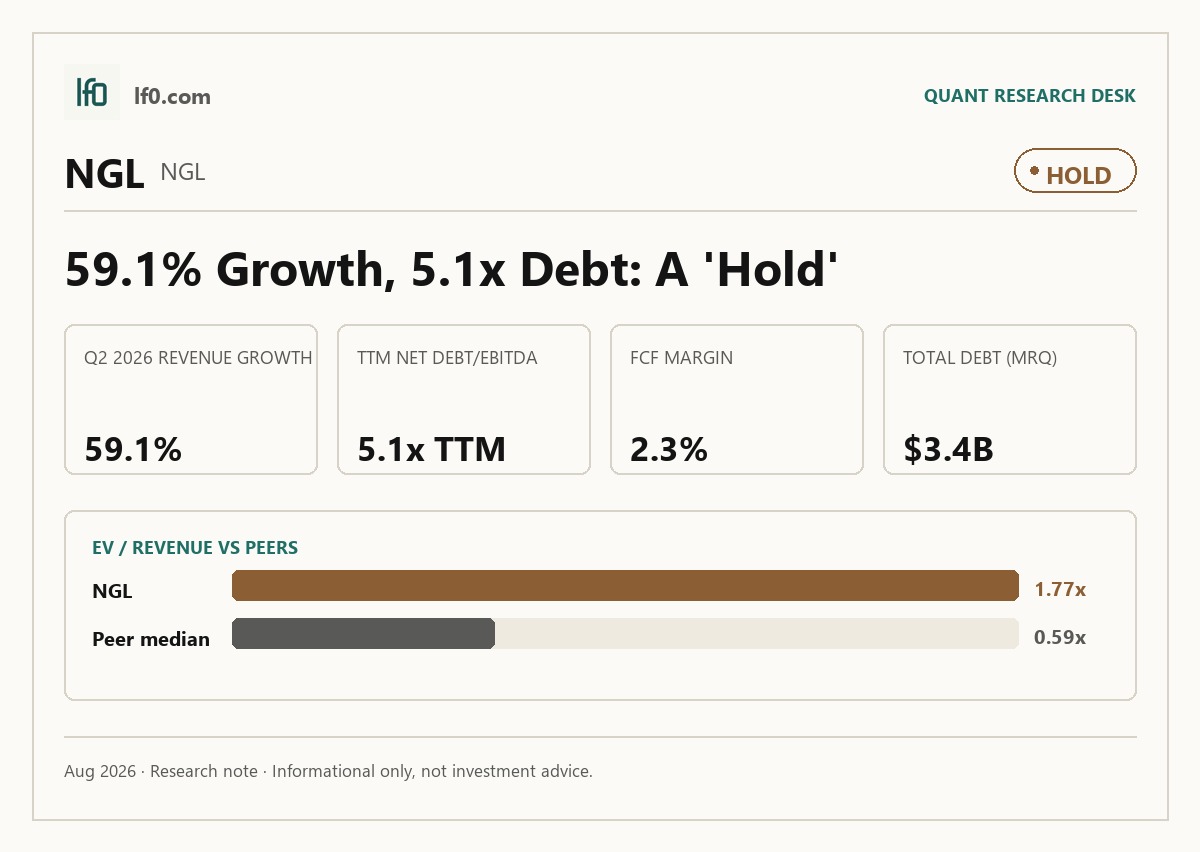
- Rated hold — the water franchise is real, but leverage still dominates the equity.
- Strongest point: Q2 2026 revenue reached $990M, up 59.1% year over year.
- Main risk: net debt/EBITDA is 5.1x, with only 2.3% TTM free cash flow margin.
- Valuation is mixed: 9.4x EV/EBITDA is not cheap for a still-levered cleanup case.
- I would turn more constructive if free cash flow margin moves above 5.0%, meaning cash conversion is finally de-risking the capital structure.
Executive Summary
Rating: HOLD | NGL
Measured from adjusted close on 2026-08-31 to 2026-10-14. Sell ratings are correct when the stock falls; Hold is tracked as a +/-10% range. Daily-close data, not intraday. Calls are tracked for 182 days from publication, then frozen as a final record.
I would put my rating as a Hold because NGL has rebuilt around a contracted water network, but the balance sheet still carries 5.1x net debt/EBITDA and only 2.3% free cash flow margin, so the equity is not yet backed by enough cash generation to justify a more aggressive call. The strongest part of the thesis is the 59.1% year-over-year revenue increase in Q2 2026, which shows the post-divestiture pivot is working and gives the stock real operating leverage if water volumes stay firm. The offset is that $3.4B of total debt leaves little room if commodity-linked volumes soften or refinancing terms tighten. I would raise my rating more towards a Buy if free cash flow margin moves above 5.0%, meaning cash conversion is strong enough to de-risk the capital structure.
Company Profile
NGL Energy Partners LP, formed in September 2010, is a Delaware master limited partnership listed on Nasdaq under NGL. It earns revenue from three segments: Water Solutions transports, treats, recycles, and disposes of produced water under long-term fixed fee contracts; Crude Oil Logistics buys, stores, and moves crude oil under fixed rate and minimum volume agreements; and Liquids Logistics supplies natural gas liquids across the United States and Canada through terminals, pipelines, railcars, and storage, with some winter volumes locked by pre-sale and back-to-back contracts. The partnership is shifting toward a water infrastructure focus after selling its refined products business and most of its wholesale propane business on April 30, 2025. As of March 31, 2026, it had 449 employees in 14 states and Canada. Its Water Solutions network handled about 1.063 billion barrels in FY2026 and includes 91 treatment and disposal facilities. On March 12, 2026, it closed a $950M 2026 Term Loan B, a seven-year senior secured term loan, and amended its asset-based revolving credit facility (ABL Facility).
Economic Moat
Business Model
The largest integrated produced-water pipeline, recycling, and disposal network in the Northern Delaware Basin is the asset base I think a competitor would struggle to replicate within three years, because it is tied to 766,000 dedicated acres, 840 miles of newly built large-diameter produced-water pipelines, 59 active saltwater disposal facilities, and 141 active disposal wells. That network is not just scale; it is a contracted system, with long-term fixed fee contracts, acreage dedications, and minimum volume commitments from investment-grade producer customers creating route density and commercial lock-in that would take years of permitting, drilling, and customer contracting to rebuild. I also see secondary support from the crude oil logistics footprint, especially the Grand Mesa Pipeline and the Cushing terminal, plus the Liquids Logistics railcar and terminal network, but those assets are more exposed to commodity and seasonal swings than the water system. The moat shows up in the numbers too: the water franchise is the part of the business that can support 14.9% operating margin and positive TTM cash generation even while the rest of the portfolio is still being cleaned up.
Business & Operating Risks
According to the risk factors in NGL’s SEC 10-K, the partnership may not have sufficient cash to fund operations, repay indebtedness, or pay distributions, and that risk is amplified by $3.3B of debt and the absence of common-unit distributions. Debt covenants in the ABL Facility, the 2026 Term Loan B, and the senior secured notes restrict additional debt, repurchases, acquisitions, liens, and asset sales, while the Class D Preferred Units can be redeemed at the holder’s option on or after July 2, 2027. Commodity exposure and customer dependence remain the operating risks most likely to hit near-term results because cash generation still depends on crude oil and natural gas liquids volumes, producer drilling activity, and the ability to pass through cost increases. Regulatory and physical-asset risks are also concrete: the January 2024 Texas Railroad Commission suspension reduced disposal capacity by 10,000 barrels per day, which matters because it shows the water network is not immune to local operating constraints even if the broader franchise remains intact. Taken together, these risks pressure the balance sheet more than the moat itself; the water network still looks durable, but the leverage structure can delay the equity’s ability to benefit from it.
Management Discussion & Analysis
Management is responding to the balance-sheet and operating risks with a refinancing-led reset, but it is doing so by buying time rather than by meaningfully deleveraging. The partnership closed a $950M 2026 Term Loan B and cut ABL commitments to $425M, which pushes maturity out to March 11, 2033 and tightens liquidity discipline, yet it does not reduce the $3.4B debt load that still sits on the equity. The board declared $18.8M of preferred-unit distributions on March 18, 2026, while common-unit distributions remain under review until leverage, liquidity, and debt maturities improve, so equity holders are still behind debt and preferred capital in the payout queue. Capital spending remains focused on the core water franchise, with $190.4M of expansion capex in FY2026 and about $200M of growth capex plus $45M of maintenance capex expected in FY2027; the May 7, 2026 LEX II Expansion, a water pipeline project that adds 165,000 barrels per day of capacity under a new long-term volume commitment contract, is the clearest sign that management is still willing to invest where contracted volumes are visible. The cleanup of weaker assets is also real, but the year ended March 31, 2026 still included -$251.8M of loss on disposal or impairment of assets and a $247.8M goodwill impairment in Crude Oil Logistics, so the earnings base is improving only gradually.
Recent Events
The March 12, 2026 refinancing is the most important recent event because it extends maturity visibility and reduces near-term funding pressure, which supports the moat thesis by giving the water business more time to compound. I read the lower ABL commitment as a modest constraint on liquidity flexibility, but lenders still supported the business on better terms, which tells me the capital structure is not broken even if it is still tight. On February 9, 2026, unitholders approved the 2025 Long-Term Incentive Plan, a 10-year award pool for up to 10.0M units, which should help retention and alignment while keeping dilution more controlled. The recent filings therefore strengthen the investment case at the margin, but they do not yet change the central issue: the equity still needs cash conversion to catch up with the operating reset.
Financial Analysis
Growth
NGL — Financial Growth (Quarterly, USD Mil)
| Metric | 2024-12-31 | 2025-06-30 | 2025-09-30 | 2025-12-31 | 2026-03-31 | 2026-06-30 |
|---|---|---|---|---|---|---|
| REVENUE (USD Mil) | — | 622.2 | 674.7 | 909.8 | 949.5 | 990 |
| EBIT (USD Mil) | — | 91.9 | 91.6 | 109.2 | -225 | 145.2 |
| EBITDA (USD Mil) | — | 158.5 | 155.6 | 181 | -158.8 | 208.7 |
| NET INCOME (USD Mil) | — | 68.9 | 29.3 | 47.2 | -287.7 | 78.7 |
| DILUTED EPS | -0.1 | 0 | 0 | 0.1 | — | 0.5 |
Source: Yahoo Finance — Quarterly Financial Statements
Revenue rose from $622.2M in Q2 2025 to $990M in Q2 2026, a 59.1% year-over-year increase, after $674.7M in Q3 2025 and $909.8M in Q4 2025. EBITDA swung from -$158.8M in Q1 2026 to $208.7M in Q2 2026, so the business is scaling, but earnings remain more volatile than sales. That pattern is consistent with a post-divestiture portfolio that is still absorbing mix changes, not with a clean, steady compounding profile yet.
Profitability
NGL — Profitability (TTM)
| Metric | TTM |
|---|---|
| Operating Margin (TTM) | 14.9% |
| Net Margin (TTM) | -3.8% |
| Return on Assets (TTM) | 6.2% |
| Return on Equity (TTM) | -37.7% |
| Gross Margin (TTM) | 29.5% |
| EBITDA Margin (TTM) | 18.9% |
Source: Yahoo Finance — Trailing Twelve Months (TTM)
TTM gross margin was 29.5%, EBITDA margin was 18.9%, operating margin was 14.9%, and net margin was -3.8%. The spread from gross to operating margin is 14.7 percentage points, which tells me the core service layer is profitable but overhead, interest, and other below-the-line costs still absorb too much of the gross profit. ROA was 6.2% TTM, while ROE was -37.7% TTM, so asset productivity is not the problem; the capital structure is. In my view, the key threshold is not just positive EBITDA, but net margin turning positive and staying there, because that would show the water franchise is finally translating into equity earnings rather than just servicing the balance sheet.
Valuation
NGL — Valuation Multiples
| Metric | Value |
|---|---|
| Market Cap (USD Mil) | — |
| Enterprise Value (USD Mil) | 6,252 |
| Trailing P/E | — |
| Forward P/E | — |
| Price/Sales (TTM) | — |
| Price/Book (mrq) | -4.1 |
| EV/Revenue | 1.8 |
| EV/EBITDA | 9.4 |
| Beta (5Y Monthly) | 0.65 |
| FCF Yield % (TTM) | — |
| Forward EPS (USD) | — |
| Analyst Target Price – Low (USD) | — |
| Analyst Target Price – Mean (USD) | — |
| Analyst Target Price – High (USD) | — |
| # Analyst Opinions | — |
Source: Yahoo Finance
NGL screens on enterprise value first because the earnings-based multiples are not usable here. EV/Revenue is 1.8x and EV/EBITDA is 9.4x, which tells me the market is paying a mid-single-digit EBITDA multiple for a business with 18.9% TTM EBITDA margin and 5.1x net debt/EBITDA. Price/book is -4.1x, and I do not treat that as a normal cheapness signal because book value per share is negative at -$4.4, so equity accounting has already broken the usual anchor. The stock also carries a PEG ratio of 8.1x, while beta is 0.7x, so the shares have been less volatile than the market even as they have rerated sharply. On my read, fair value sits in a wide range because the peer set spans very different growth and leverage profiles, but NGL’s own leverage and cash conversion argue for a discount to the cleaner names rather than a premium. There is no meaningful analyst consensus to compare against here because the reference data show no target prices or coverage count. I would frame the implied EPS range as still weak relative to peers: NGL’s TTM diluted EPS is -$3.3, while peers such as PAGP, PAA, GLP, TRGP, and MPLX are all positive, which means NGL is still priced more on recovery potential than on current earnings power. The market is already giving credit for the water pivot, but the 2.3% free cash flow margin says that credit is ahead of the cash conversion story.
Leverage
NGL — Leverage & Coverage (Quarterly)
| Metric | Value |
|---|---|
| Total Debt/Equity % (mrq) | 6,312 |
| Current Ratio (mrq) | 1.1 |
| Total Debt (mrq, USD Mil) | 3,401.8 |
| Operating Cash Flow (TTM, USD Mil) | 409.8 |
| Levered Free Cash Flow (TTM, USD Mil) | 80.3 |
| Net Debt/EBITDA (TTM) | 5.1 |
| FCF Margin % (TTM) | 2.3% |
Source: Yahoo Finance — Quarterly Financial Statements
NGL’s balance sheet is stretched but still serviceable. Total debt/equity is 6,312.0%, current ratio is 1.1x, and total debt is $3.4B, so leverage is high even before considering the capital structure complexity of a master limited partnership. Cash generation is positive: operating cash flow is $409.8M TTM, levered free cash flow is $80.3M, net debt/EBITDA is 5.1x, and FCF margin is 2.3%. I view this as medium to high refinancing risk because cash flow covers the debt load, but only with a thin cushion, and the 1.1x current ratio leaves limited room if operating cash flow weakens or debt markets tighten. EBITDA converts to cash, but not efficiently enough to create a large buffer, so the profile leaves NGL exposed if commodity-linked volumes soften.
Insider Activity
The insider transaction record I see here is one-sided buying: four open-market purchases and zero open-market sales in a two-day sample, all by KRIMBILL H MICHAEL, the chief executive office. In my view, that is supportive but concentrated, because one executive accounted for every open-market trade, which signals alignment without yet proving broad insider conviction.
Comparable Analysis
Growth
| Company | Revenue TTM (USD Mil) | Revenue Growth YoY % | EBITDA TTM (USD Mil) | Diluted EPS TTM |
|---|---|---|---|---|
| NGL | 3,524 | 59.1% | 667.5 | -3.3 |
| PAGP | 52,305 | 66.3% | 2,574 | 0.3 |
| GLP | 21,456.2 | 46.8% | 470.5 | 4.9 |
| PAA | 52,305 | 66.3% | 2,572 | 1.2 |
| TRGP | 16,741.5 | 4.2% | 5,497.7 | 10.5 |
| MPLX | 12,034 | 10.6% | 6,113 | 4.7 |
Source: Yahoo Finance
NGL’s revenue growth of 59.1% TTM is ahead of MPLX at 10.6% and TRGP at 4.2%, but it trails PAGP and PAA at 66.3% and GLP at 46.8%. The bigger point is that NGL is growing from a smaller base, so the market should care less about the headline rate and more about whether that growth converts into earnings; diluted EPS is -$3.3 TTM, while PAGP and PAA are already positive at $0.3 and $1.2.
Valuation
| Company | Trailing P/E | Forward P/E | EV/Revenue | EV/EBITDA | Price/Sales (TTM) | Price/Book (mrq) | Market Cap (USD Mil) | Enterprise Value (USD Mil) | Beta (5Y Monthly) | FCF Yield % (TTM) | Forward EPS | Analyst Target Price – Low | Analyst Target Price – Mean | Analyst Target Price – High | # Analyst Opinions |
|---|---|---|---|---|---|---|---|---|---|---|---|---|---|---|---|
| NGL | — | — | 1.8 | 9.4 | — | -4.1 | — | 6,252 | 0.65 | — | — | — | — | — | — |
| PAGP | 79.9 | 13 | 0.5 | 10.4 | 0.1 | 3.5 | 6,517 | 26,844 | 0.45 | 22.0% | 2.2 | 20 | 24.9 | 29 | 14 |
| GLP | 10.3 | 20.1 | 0.2 | 8 | 0.1 | 2.5 | 1,709 | 3,771 | 1.05 | 8.0% | 2.5 | 45 | 45 | 45 | 1 |
| PAA | 21.8 | 13.5 | 0.6 | 12 | 0.3 | 2 | 17,978 | 30,824 | 0.49 | 7.8% | 1.9 | 20 | 24.9 | 27 | 18 |
| TRGP | 27.5 | 23.8 | 4.9 | 14.8 | 3.7 | 19.7 | 61,718 | 81,302 | 0.72 | 0.1% | 12.1 | 257 | 308.1 | 351 | 21 |
| MPLX | 12.7 | 12.4 | 7.1 | 14 | 5 | 4.3 | 60,071 | 85,398 | 0.46 | 2.3% | 4.8 | 54 | 62.2 | 73 | 13 |
Source: Yahoo Finance
NGL trades at 1.8x EV/Revenue and 9.4x EV/EBITDA, versus GLP at 0.2x and 8.0x, PAGP at 0.5x and 10.4x, PAA at 0.6x and 12.0x, MPLX at 7.1x and 14.0x, and TRGP at 4.9x and 14.8x. The more telling contrast is cash generation: PAGP posts a 22.0% FCF yield and MPLX 11.3%, while NGL’s FCF yield is not provided and its FCF margin is only 2.3%, so I feel the market is already giving NGL credit for a recovery that still needs to show up in cash flow. On a simple peer-multiple read, applying the peer EV/Revenue range to NGL’s $3.5B TTM revenue implies a very wide enterprise-value band, which is another way of saying the stock is being valued more on narrative than on a settled peer anchor. That valuation gap is easier to justify for the higher-quality, lower-risk names than for NGL, where leverage still sits above the group.
Profitability
| Company | Operating Margin (TTM) | Net Margin (TTM) | Return on Assets (TTM) | Return on Equity (TTM) | Gross Margin (TTM) | EBITDA Margin (TTM) |
|---|---|---|---|---|---|---|
| NGL | 14.9% | -3.8% | 6.2% | -37.7% | 29.5% | 18.9% |
| PAGP | 2.8% | 1.1% | 3.4% | 8.3% | 5.5% | 4.9% |
| GLP | 1.6% | 0.8% | 5.2% | 27.2% | 5.8% | 2.2% |
| PAA | 2.8% | 5.3% | 3.5% | 10.2% | 5.5% | 4.9% |
| TRGP | 27.8% | 13.5% | 9.2% | 70.8% | 43.2% | 32.8% |
| MPLX | 38.2% | 39.3% | 7.3% | 33.7% | 55.7% | 50.8% |
Source: Yahoo Finance
NGL’s operating margin of 14.9% and EBITDA margin of 18.9% are far above PAGP’s 2.8% and 4.9%, but below TRGP’s 27.8% and 32.8%, while gross margin of 29.5% also sits under TRGP’s 43.2%. The net margin gap is the key tell: NGL is at -3.8% versus positive net margins at PAGP, PAA, GLP, MPLX, and TRGP, which points to a cost of capital and interest burden issue rather than just weak operating scale. ROA is 6.2%, but ROE is -37.7%, so the equity return profile is still being distorted by leverage.
Leverage
| Company | Total Debt/Equity % (mrq) | Current Ratio (mrq) | Total Debt (mrq, USD Mil) | Operating Cash Flow TTM (USD Mil) | Free Cash Flow TTM (USD Mil) | Net Debt/EBITDA (TTM) | FCF Margin % (TTM) |
|---|---|---|---|---|---|---|---|
| NGL | 6,312 | 1.1 | 3,401.8 | 409.8 | 80.3 | 5.1 | 2.3% |
| PAGP | 56.4 | 1.1 | 8,635 | 2,971 | 1,436 | 2.9 | 2.8% |
| GLP | 268.2 | 1.2 | 2,008 | 324.8 | 136.5 | 4.2 | 0.6% |
| PAA | 60.4 | 1.1 | 8,635 | 2,976 | 1,402.6 | 2.9 | 2.7% |
| TRGP | 515.8 | 0.8 | 19,578 | 4,285.5 | 65.8 | 3.5 | 0.4% |
| MPLX | 183.4 | 0.9 | 26,133 | 5,976 | 1,366.4 | 4.1 | 11.3% |
Source: Yahoo Finance
NGL’s total debt/equity is 6,312.0%, and net debt/EBITDA is 5.1x, both worse than PAGP at 56.4% and 2.9x, PAA at 60.4% and 2.9x, GLP at 268.2% and 4.2x, and MPLX at 183.4% and 4.1x. The current ratio of 1.1x is acceptable, but free cash flow margin of 2.3% is thin next to MPLX at 11.3%, so the balance sheet still looks like a financing constraint rather than a competitive advantage. That is also why NGL’s stronger revenue growth does not translate into a better valuation multiple than the cleaner peers; the market is discounting the leverage risk as much as it is rewarding the growth.
Conclusion
I would put my rating as a Hold because the water franchise is doing what it should, but the equity still has to prove that the cash it generates can outrun a 5.1x net debt/EBITDA load. The key tension is that revenue growth is strong enough to support a better multiple, yet free cash flow margin is only 2.3%, so the numbers do not yet show a business that can absorb much error.
I would raise my rating more towards a Buy if free cash flow margin moves above 5.0%, meaning cash conversion is finally strong enough to de-risk the capital structure, and if net debt/EBITDA falls below 4.0x, which would put refinancing risk in a more manageable range. That combination would tell me the contracted water network is creating equity value rather than just supporting debt service.
I would move from Hold to Sell if EBITDA rolls back toward the Q1 2026 trough or if operating cash flow weakens enough to push free cash flow margin back toward breakeven, because then the refinancing cushion would narrow fast. A weaker crude and liquids tape would make that worse, since the business still depends on commodity-linked volumes outside Water Solutions, and the current 1.1x current ratio would not leave much room to absorb another cash shock.
Weighing both paths, I think the bull case needs more time than the market is likely to give it, while the bear case only needs cash conversion to stall. That is why I stay at Hold rather than leaning into the recent share price strength, and I would want to see leverage and free cash flow both improve before I get more constructive.
What to Watch Next
- Free cash flow margin above 5.0% — would support a move toward Buy.
- Net debt/EBITDA below 4.0x — would reduce refinancing risk materially.
- EBITDA holding above the Q1 2026 trough — would confirm the rebound is durable.
- Operating cash flow staying above the current $409.8M TTM run rate — would keep liquidity pressure contained.
- Current ratio staying above 1.0x — would show near-term liquidity remains serviceable.
What’s your take? I rated NGL Energy Partners (NGL) HOLD above — but the goal here is to get this right, not just to publish an opinion. What would you add to this analysis, or which risk or catalyst do you think I’m under- or over-weighting? Tell me in the comments.
Sources
- SEC 10-K Annual Report — filed 2026-05-28
- SEC 8-K Filing (2026-03-12)
- SEC 8-K Filing (2026-02-09)
- SEC Form 4 Insider Transaction (2025-02-18)
- SEC 10-K Annual Report — FY2026
- SEC 10-K Annual Report — FY2025
- SEC 10-K Annual Report — FY2024
- SEC 10-K Annual Report — FY2023
- SEC 10-K Annual Report — FY2022
Data sourced from Yahoo Finance and SEC EDGAR. Not investment advice.
Leave a Comment