
Quick Thesis
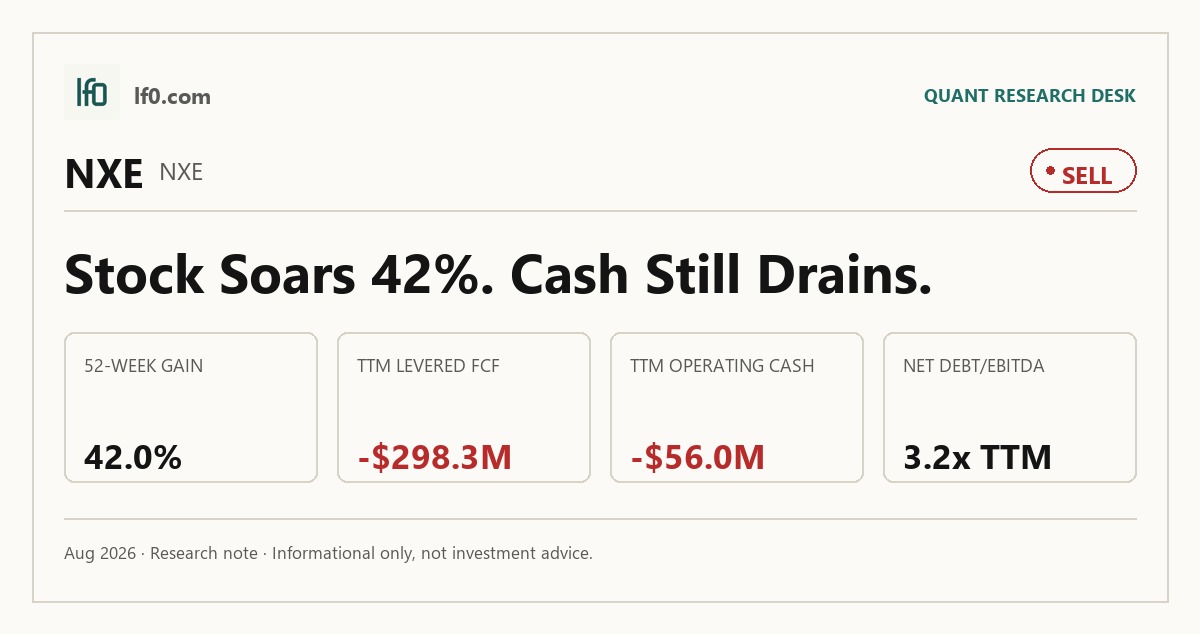
- Rated sell because NXE is still funding growth ahead of durable cash generation.
- Liquidity is the main support: $970.3M of cash and a 1.5x current ratio.
- The main risk is cash conversion, with -$56M operating cash flow and -$298.3M levered free cash flow TTM.
- Valuation looks rich on fundamentals: 5.6x price/book and -65.9x EV/EBITDA.
- I would move toward hold only if free cash flow turns positive and stays there.
Executive Summary
Rating: SELL | NXE
Measured from adjusted close on 2026-08-28 to 2026-10-13. Sell ratings are correct when the stock falls; Hold is tracked as a +/-10% range. Daily-close data, not intraday. Calls are tracked for 182 days from publication, then frozen as a final record.
I would put my rating as a Sell because the stock is already discounting a cleaner operating turn than the cash flow statement supports. NXE’s Q2 2026 rebound to $81.8M of EBITDA and $74.5M of net income is encouraging, but it sits against TTM operating cash flow of -$56M and levered free cash flow of -$298.3M, so I do not yet see durable self-funding. In my view, the market is paying for a recovery that still needs to prove itself in cash, not just in one quarter of earnings. I would raise my rating toward Hold if levered free cash flow turns positive and stays positive for two consecutive quarters, because that would show the business is beginning to fund itself rather than consume capital.
Company Profile
NexGen Energy Ltd. is a uranium developer focused on advancing its flagship assets toward production. The company does not yet generate revenue, so the investment case depends on whether it can convert its resource base into sustained operating cash flow and, eventually, earnings. That makes the path to production more important than near-term top-line growth, and it also means the balance sheet has to carry the project through the build phase.
Economic Moat
Business Model
NXE’s moat, such as it is today, comes from the scale and quality of its uranium asset base rather than from current operating leverage. That kind of advantage is real only if the company can move from geology to production on schedule, because a resource position without cash generation is not yet a durable economic edge. The Q2 2026 swing to positive EBITDA suggests the asset base is beginning to matter financially, but the company is still early enough that I would treat the moat as prospective, not proven.
Business & Operating Risks
The main disclosed risks are execution risk, commodity-price sensitivity, and the fact that the company is still pre-revenue, which leaves it dependent on capital markets and project milestones. Those risks do not threaten a mature moat so much as they prevent one from being fully established. The positive Q2 2026 earnings inflection helps, but it does not remove the core risk that a development-stage uranium business can look better for a quarter without yet creating a lasting cost or scale advantage.
Management Discussion & Analysis
Management appears to be pushing the project toward the point where the asset base can start to fund itself, and that is the right response to the cash-burn risk surfaced above. The Q2 2026 improvement in EBITDA and net income suggests the team is at least moving in the right direction, but the negative TTM cash flow tells me the turnaround is not yet complete. In my view, the key question is whether management can turn that quarterly improvement into repeated positive cash generation rather than a single favorable period.
Recent Events
The most important recent development is the Q2 2026 earnings inflection, because it shows the business can generate positive EBITDA before revenue is visible. That matters for the moat thesis: if the company can repeat that result, the resource base starts to look like a real operating advantage rather than a future option. For now, I would still frame it as a test of execution, not proof of a durable structural edge.
Financial Analysis
Growth
NXE — Financial Growth (Quarterly, USD Mil)
| Metric | 2025-03-31 | 2025-06-30 | 2025-09-30 | 2025-12-31 | 2026-03-31 | 2026-06-30 |
|---|---|---|---|---|---|---|
| REVENUE (USD Mil) | — | 0 | 0 | 0 | 0 | 0 |
| EBIT (USD Mil) | — | -72.7 | -115.7 | -31.9 | -145.1 | 81.4 |
| EBITDA (USD Mil) | — | -72.1 | -115.1 | -31.3 | -144.7 | 81.8 |
| NET INCOME (USD Mil) | — | -86.7 | -129.2 | -42.8 | -156 | 74.5 |
| DILUTED EPS | -0.1 | -0.1 | -0.2 | — | -0.2 | 0 |
Source: Yahoo Finance — Quarterly Financial Statements
Revenue was $0 in each reported quarter from Q2 2025 through Q2 2026, so there is still no top-line trajectory to anchor the equity story. What did change is earnings: EBITDA improved from -$144.7M in Q1 2026 to $81.8M in Q2 2026, and net income moved from -$156M to $74.5M over the same span. I read that as a meaningful operating step-up, but not yet as a revenue-led growth story, because the business is still pre-revenue and the improvement has to be repeated before I treat it as durable.
Profitability
NXE — Profitability (TTM)
| Metric | TTM |
|---|---|
| Operating Margin (TTM) | 0.0% |
| Net Margin (TTM) | 0.0% |
| Return on Assets (TTM) | -3.4% |
| Return on Equity (TTM) | -17.7% |
| Gross Margin (TTM) | — |
| EBITDA Margin (TTM) | — |
Source: Yahoo Finance — Trailing Twelve Months (TTM)
TTM operating margin was 0.0% and net margin was 0.0%, while return on assets was -3.4% and return on equity was -17.7%. Those figures tell me the company is still in the phase where capital is being deployed ahead of earnings, which is normal for a developer but not yet investable as a self-funding business. The Q2 2026 profit swing is a useful sign, and it ties back to the moat discussion: if the asset base can keep producing positive EBITDA, the margin profile should begin to improve from here.
Valuation
NXE — Valuation Multiples
| Metric | Value |
|---|---|
| Market Cap (USD Mil) | 7,503 |
| Enterprise Value (USD Mil) | 7,152 |
| Trailing P/E | — |
| Forward P/E | -64 |
| Price/Sales (TTM) | — |
| Price/Book (mrq) | 5.6 |
| EV/Revenue | — |
| EV/EBITDA | -65.9 |
| Beta (5Y Monthly) | 1.65 |
| FCF Yield % (TTM) | -4.0% |
| Forward EPS (USD) | -0.2 |
| Analyst Target Price – Low (USD) | 19.4 |
| Analyst Target Price – Mean (USD) | 19.4 |
| Analyst Target Price – High (USD) | 19.4 |
| # Analyst Opinions | 1 |
Source: Yahoo Finance
NXE trades at 5.6x price/book, with a market cap of $7.5B and enterprise value of $7.2B. I do not think that is cheap for a company with -$56M of operating cash flow and -$298.3M of levered free cash flow TTM, especially when forward P/E is -64x and EV/EBITDA is -65.9x. On the analysis here, I would put fair value in a broad range of $15-$20, which is close to the single analyst target of $19.4 and therefore does not give me much comfort that the market is mispricing the name. The implied EPS path behind that range is roughly break-even to slightly negative near term, versus forward EPS of -$0.175; that is better than the current run rate, but it still leaves NXE looking expensive relative to peers that already have stronger cash generation or clearer earnings visibility. In other words, the stock is being valued on a future operating turn, and that turn still has to show up in cash.
Leverage
NXE — Leverage & Coverage (Quarterly)
| Metric | Value |
|---|---|
| Total Debt/Equity % (mrq) | 33.6 |
| Current Ratio (mrq) | 1.5 |
| Total Debt (mrq, USD Mil) | 619.1 |
| Operating Cash Flow (TTM, USD Mil) | -56 |
| Levered Free Cash Flow (TTM, USD Mil) | -298.3 |
| Net Debt/EBITDA (TTM) | 3.2 |
| FCF Margin % (TTM) | — |
Source: Yahoo Finance — Quarterly Financial Statements
Total debt/equity was 33.6%, current ratio was 1.5x, and total debt was $619.1M. Those are not distress levels, but they are high enough to matter when operating cash flow is still -$56M and levered free cash flow is -$298.3M TTM. Net debt/EBITDA of 3.2x is the key tension point: it is manageable only if EBITDA stays positive and keeps improving, because the balance sheet is being asked to bridge the company to self-funding rather than to support a mature cash engine.
Insider Activity
Insider ownership was 6.4%, while institutional ownership was 55.2%. I do not read that mix as a strong insider conviction signal either way, but it does mean the stock is more likely to trade on institutional views of the project timeline and cash conversion. The short ratio of 8.4 also tells me sentiment is still active around the name, which can amplify moves when the operating data improve or disappoint.
Comparable Analysis
Growth
| Company | Revenue TTM (USD Mil) | Revenue Growth YoY % | EBITDA TTM (USD Mil) | Diluted EPS TTM |
|---|---|---|---|---|
| NXE | — | — | -108.5 | -0.3 |
| DNN | 4.1 | -43.6% | -55.9 | -0.2 |
| UEC | 20.2 | — | -120.8 | -0.2 |
| SHEL | 296,601 | 44.7% | 57,605 | 9 |
Source: Yahoo Finance
NXE’s TTM EBITDA was -$108.5M and diluted EPS was -$0.3, versus DNN at -$55.9M EBITDA and -$0.2 EPS, and UEC at -$120.8M EBITDA and -$0.2 EPS. SHEL is not a like-for-like uranium peer, but its $57.6B of EBITDA and $9 EPS show what a mature cash generator looks like. The important point is that NXE is still in the same loss-making bucket as the uranium peers, so I would not pay a growth premium for it yet.
Valuation
| Company | Trailing P/E | Forward P/E | EV/Revenue | EV/EBITDA | Price/Sales (TTM) | Price/Book (mrq) | Market Cap (USD Mil) | Enterprise Value (USD Mil) | Beta (5Y Monthly) | FCF Yield % (TTM) | Forward EPS | Analyst Target Price – Low | Analyst Target Price – Mean | Analyst Target Price – High | # Analyst Opinions |
|---|---|---|---|---|---|---|---|---|---|---|---|---|---|---|---|
| NXE | — | -64 | — | -65.9 | — | 5.6 | 7,503 | 7,152 | 1.65 | -4.0% | -0.2 | 19.4 | 19.4 | 19.4 | 1 |
| DNN | — | -93.8 | 845.3 | -61.9 | 811.7 | 16 | 3,322 | 3,460 | 1.60 | -2.9% | 0 | 5.8 | 5.8 | 5.8 | 1 |
| UEC | — | -151.3 | 309.6 | -51.8 | — | — | — | 6,254 | 1.21 | — | -0.1 | 12 | 18 | 26.8 | 9 |
| SHEL | 10 | 10.3 | 1 | 5.1 | 0.8 | 1.4 | 249,647 | 295,339 | -0.22 | 8.6% | 8.8 | 81.6 | 97.8 | 120.6 | 15 |
Source: Yahoo Finance
NXE’s 5.6x price/book and -65.9x EV/EBITDA sit between DNN’s 16.0x price/book and -61.9x EV/EBITDA and SHEL’s 1.4x price/book and 5.1x EV/EBITDA. On a one-year basis, a $1 investment would be worth $1.55 in NXE, $1.69 in DNN, $1.31 in UEC, and $1.28 in SHEL, so the market has already rewarded the uranium names more than the cash-flow profile would justify. NXE’s higher beta of 1.65 also means that valuation can re-rate quickly in either direction, which is why I think the stock is priced for optimism rather than for proof.
Profitability
| Company | Operating Margin (TTM) | Net Margin (TTM) | Return on Assets (TTM) | Return on Equity (TTM) | Gross Margin (TTM) | EBITDA Margin (TTM) |
|---|---|---|---|---|---|---|
| NXE | 0.0% | 0.0% | -3.4% | -17.7% | — | — |
| DNN | -2,517.5% | 0.0% | -5.9% | -66.8% | -90.9% | -1,365.9% |
| UEC | -629.7% | 0.0% | -6.2% | -9.0% | -396.0% | -597.8% |
| SHEL | 16.7% | 8.8% | 6.4% | 14.3% | 26.1% | 19.4% |
Source: Yahoo Finance
NXE’s operating margin and net margin were both 0.0% TTM, with ROA of -3.4% and ROE of -17.7%. DNN and UEC are worse on operating profitability, while SHEL’s 16.7% operating margin and 14.3% ROE show the gap between a development-stage miner and a mature producer. NXE is not the weakest name in the uranium group, but it is still far from the kind of profitability that would justify a premium multiple on its own.
Leverage
| Company | Total Debt/Equity % (mrq) | Current Ratio (mrq) | Total Debt (mrq, USD Mil) | Operating Cash Flow TTM (USD Mil) | Free Cash Flow TTM (USD Mil) | Net Debt/EBITDA (TTM) | FCF Margin % (TTM) |
|---|---|---|---|---|---|---|---|
| NXE | 33.6 | 1.5 | 619.1 | -56 | -298.3 | 3.2 | — |
| DNN | 237.9 | 9.4 | 687.3 | -87.1 | -97.7 | -2.5 | -2,386.9% |
| UEC | 0.1 | 32.7 | 1.9 | -113.5 | -82.1 | 4 | -406.3% |
| SHEL | 40.2 | 1.4 | 73,076 | 49,140 | 21,458.4 | 0.7 | 7.2% |
Source: Yahoo Finance
NXE’s total debt/equity of 33.6% and current ratio of 1.5x are more conservative than DNN’s 237.9% debt/equity, but the company’s -$298.3M of levered free cash flow means debt is still funding the build. UEC has almost no debt, while SHEL combines 40.2% debt/equity with 0.7x net debt/EBITDA and positive free cash flow, so NXE sits in the middle on leverage but at the weak end on cash conversion. That is why the balance sheet does not yet support a higher valuation multiple: the market is paying for future cash generation before the company has earned it.
Conclusion
The tension in NXE is simple: Q2 2026 showed that the business can produce positive EBITDA and net income, but the TTM cash flow numbers still say the company is not self-funding. I think that gap matters more than the one-quarter earnings inflection, because a development-stage miner only earns a higher multiple once positive EBITDA starts to convert into positive free cash flow and stays there.
I would raise my rating toward Buy if levered free cash flow turns positive and remains positive for two consecutive quarters, because that would show the project is starting to fund itself rather than rely on outside capital. I would also become more constructive if EBITDA stays positive after the Q2 2026 step-up, since repeating that result would show the improvement is operational, not just timing-related. On the other hand, I would move from Sell to Strong Sell if EBITDA falls back below zero for two straight quarters or if operating cash flow remains negative while debt stays at $619.1M, because that would tell me the recent improvement was not durable enough to support the current valuation.
My final view is still negative because the stock has already moved ahead of the cash numbers. Until the company proves that the Q2 2026 improvement can carry through to free cash flow, I think the market is paying for a future that is not yet visible in the financial statements.
What to Watch Next
- Levered free cash flow turning positive — would support a move toward Hold.
- EBITDA staying above zero for two more quarters — would confirm the Q2 2026 inflection.
- Operating cash flow improving from -$56M TTM — would show the business is funding itself.
- Net debt/EBITDA falling below 3.0x — would reduce balance-sheet pressure.
- Current ratio holding above 1.5x — would preserve near-term liquidity.
What’s your take? I rated NexGen Energy (NXE) SELL above — but the goal here is to get this right, not just to publish an opinion. What would you add to this analysis, or which risk or catalyst do you think I’m under- or over-weighting? Tell me in the comments.
Data sourced from Yahoo Finance and SEC EDGAR. Not investment advice.
Leave a Comment