| Company | Aug 25 | Sep 25 | Oct 25 | Nov 25 | Dec 25 | Jan 26 | Feb 26 | Mar 26 | Apr 26 | May 26 | Jun 26 | Jul 26 | 12-Mo |
|---|---|---|---|---|---|---|---|---|---|---|---|---|---|
| TXN | +12% | -9% | -11% | +4% | +3% | +25% | -2% | -8% | +45% | +9% | -2% | -7% | +56% |
| STX | +7% | +41% | +8% | +8% | -0% | +48% | +0% | -4% | +72% | +31% | +10% | -11% | +450% |
| WDC | +2% | +50% | +25% | +9% | +6% | +45% | +12% | -3% | +61% | +22% | +20% | -15% | +594% |
| TTDKY | +5% | +12% | +23% | -8% | -14% | -9% | +21% | -17% | +44% | +39% | -14% | -13% | +59% |
| ASMIY | -1% | +25% | +8% | -15% | +9% | +39% | +1% | -11% | +29% | +8% | +10% | -20% | +91% |
| CAJPY | +3% | -1% | -2% | +3% | +0% | +3% | -0% | -8% | -8% | +4% | -3% | +9% | -2% |
Source: Yahoo Finance monthly adjusted close.
Quick Thesis
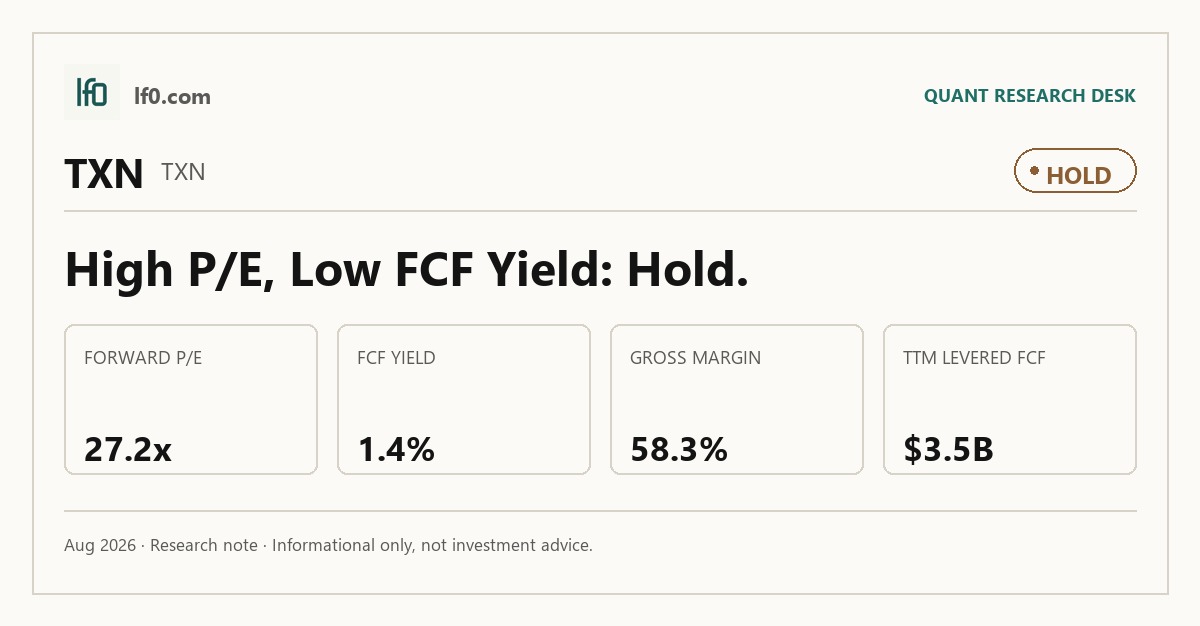
- Rated Hold — quality is real, but the valuation already discounts it.
- Strongest strength: 42.6% TTM operating margin and 18.2% FCF margin.
- Biggest risk: China exposure, with about 20% of 2025 revenue tied to China customers.
- Valuation is rich versus peers at 13.6x EV/revenue and 27.2x forward P/E.
- I would turn more constructive if quarterly revenue stays above $5.5B and margins hold.
Executive Summary
Rating: HOLD | TXN
Measured from adjusted close on 2026-08-18 to 2026-10-01. Sell ratings are correct when the stock falls; Hold is tracked as a +/-10% range. Daily-close data, not intraday. Calls are tracked for 182 days from publication, then frozen as a final record.
I would put my rating as a Hold because Texas Instruments has a durable manufacturing and direct-sales advantage, but the stock already trades at 13.6x EV/revenue and 27.2x forward P/E, which leaves limited room for error. In my view, the key strength is the combination of 42.6% TTM operating margin and 18.2% FCF margin, while the main risk is China exposure and trade restrictions that could hit both demand and delivery. I would raise my rating more towards a Buy if quarterly revenue stays above $5.5B, roughly the Q2 2026 run rate, and operating margin remains above 40%, meaning the newer fabs are translating scale into cash rather than just volume.
Company Profile
Texas Instruments Incorporated, founded in 1930 and incorporated in Delaware, designs and manufactures semiconductors sold to electronics designers and manufacturers worldwide. In 2025, it generated $17.7B of revenue, with Analog contributing $14B and Embedded Processing contributing $270M; the balance came from Other, including DLP products, calculators, and custom ASICs. The company sells to more than 100,000 customers across industrial, automotive, data center, personal electronics, and communications markets.
Headquartered in Dallas, Texas, TI has design, manufacturing, or sales operations in more than 30 countries and owns semiconductor fabs and assembly and test sites in North America, Asia, Japan, and Europe. It has been qualifying and ramping newer 300mm fabs in Richardson and Sherman, Texas, and Lehi, Utah, to support demand and internal transfers from legacy 150mm facilities. TI is listed on the Nasdaq under TXN and had about 33,000 employees worldwide at December 31, 2025.
Economic Moat
Business Model
The hardest parts of Texas Instruments’ model to copy within 3 years are its in-house manufacturing base, broad analog and embedded portfolio, and direct customer reach. I feel the manufacturing footprint is the most defensible element because TI owns and operates semiconductor facilities in North America, Asia, Japan, and Europe while continuing to qualify and ramp its newest 300mm wafer fabs in Richardson, Sherman, and Lehi. That 300mm shift matters because TI says an unpackaged chip built on a 300mm wafer costs about 40% less than one built on a 200mm wafer, so a rival would need years of capital spending and process qualification to match the cost position.
The channel mix is the second pillar. More than 80% of 2025 revenue was direct, including TI.com, which gives the company closer access to more than 100,000 customers and more of their design projects. In my view, that is a durable design-in advantage rather than a pure distribution story, and it helps explain why the moat shows up in both margin structure and customer stickiness.
Business & Operating Risks
The biggest disclosed risk is TI’s exposure to China and trade restrictions, because about 60% of 2025 revenue came from customers headquartered outside the United States, about 20% came from China headquartered end customers, and about 50% came from products shipped into China. That mix means tariffs, export controls, embargoes, sanctions, or cross-border investment limits could hit both demand and delivery at the same time. TI also faces cyclical demand and inventory mismatch risk: semiconductor demand can rise and fall quickly, and inaccurate manufacturing forecasts could leave it with excess or obsolete inventory that would pressure margins.
Cybersecurity is now a more concrete operating risk as well, with ransomware, malware, nation-state espionage, employee malfeasance, and even AI tools named as attack vectors. A breach could disrupt manufacturing, online services, or transactions and trigger remediation or regulatory costs. Supply chain dependence adds another layer, since TI relies on third parties for wafer fabrication, assembly, testing, and key materials, while limited alternate suppliers and longer lead times could hurt results. The disclosed risks do not break the moat, but they do test the managed-cost advantage that the 300mm manufacturing buildout is supposed to deliver.
Management Discussion & Analysis
Management is responding to those risks by leaning harder into manufacturing simplification and cash generation rather than trying to outrun them with aggressive expansion. The company expects capital expenditures of about $2B to $3B in 2026 after spending $4.55B in 2025, which tells me the elevated capex phase is easing even though the fab ramp is still underway. That matters because the payoff from the newer 300mm footprint should increasingly show up in free cash flow rather than in another year of heavy buildout.
The planned closure of the two remaining 150mm factories and the early-stage ramp of LFAB, the operating fab supporting Embedded Processing, reinforce the same point. TI is still spending to simplify and modernize the manufacturing base, but the benefit is back-end loaded, so I would not call the margin recovery complete yet. The company’s guidance is constructive, but it is also a reminder that the moat has to keep earning its keep through execution, not just through installed capacity.
Recent Events
The most important recent development is the CFO transition disclosed on June 2, 2026: Julie Knecht was appointed senior vice president and Chief Financial Officer effective August 1, 2026, replacing Rafael Lizardi after 25 years with the company. Because Knecht has been inside Texas Instruments for more than 25 years and has served as chief accounting officer since 2021, I read this as continuity rather than disruption.
Two governance changes also matter. On February 3, 2026, the board added a forum selection bylaw that channels certain shareholder and Securities Act claims into Delaware courts, which should reduce litigation venue risk and strengthen procedural control. At the April 16, 2026 annual meeting, shareholders re-elected the board, approved executive compensation, and ratified Ernst & Young LLP, but the written-consent proposal drew 417.9 million votes against versus 338.7 million for, showing meaningful investor pushback on governance rights. Taken together, these events do not weaken the operating moat, but they do show that management is using governance and succession planning to preserve control while the manufacturing base is still being rebuilt.
Financial Analysis
Growth
TXN — Financial Growth (Quarterly, USD Mil)
| Metric | 2025-06-30 | 2025-09-30 | 2025-12-31 | 2026-03-31 | 2026-06-30 |
|---|---|---|---|---|---|
| REVENUE (USD Mil) | 4,448 | 4,742 | 4,423 | 4,825 | 5,463 |
| EBIT (USD Mil) | 1,611 | 1,725 | 1,513 | 1,855 | 2,379 |
| EBITDA (USD Mil) | 2,092 | 2,242 | 2,070 | 2,417 | 2,947 |
| NET INCOME (USD Mil) | 1,295 | 1,364 | 1,163 | 1,545 | 1,980 |
| DILUTED EPS | 1.4 | 1.5 | 1.3 | 1.7 | 2.1 |
Source: Yahoo Finance — Quarterly Financial Statements
Revenue accelerated across the last three reported quarters: $4.4B in Q2 2025 rose to $4.7B in Q3 2025, then dipped to $4.4B in Q4 2025 before rebounding to $4.8B in Q1 2026 and $5.5B in Q2 2026. That is 22.0% year over year in Q2 2026 versus $4.5B in Q2 2025, while EBITDA grew to $2.9B from $2.1B, or 40.8% year over year. The Q4 2025 dip looks like a pause rather than a trend break, and the latest quarter supports the moat thesis because the newer manufacturing base is still feeding through to scale.
Profitability
TXN — Profitability (TTM)
| Metric | TTM |
|---|---|
| Operating Margin (TTM) | 42.6% |
| Net Margin (TTM) | 31.1% |
| Return on Assets (TTM) | 13.1% |
| Return on Equity (TTM) | 35.2% |
| Gross Margin (TTM) | 58.3% |
| EBITDA Margin (TTM) | 48.9% |
Source: Yahoo Finance — Trailing Twelve Months (TTM)
TTM gross margin of 58.3% and EBITDA margin of 48.9% show Texas Instruments still converts more than half of sales into gross profit before overhead, so the core product set is intact. The gap to TTM operating margin of 42.6% is wide but not alarming for a semiconductor maker with owned manufacturing capacity, because it reflects heavy R&D and factory costs rather than a broken pricing model. TTM net margin of 31.1% remains high, and TTM ROA of 13.1% plus TTM ROE of 35.2% point to strong capital efficiency. The key point for me is that profitability remains high even while TI is still investing in the fab footprint, which is exactly what a durable manufacturing moat should look like.
Valuation
TXN — Valuation Multiples
| Metric | Value |
|---|---|
| Market Cap (USD Mil) | 258,367 |
| Enterprise Value (USD Mil) | 265,418 |
| Trailing P/E | 42.5 |
| Forward P/E | 27.2 |
| Price/Sales (TTM) | 13.3 |
| Price/Book (mrq) | 14.3 |
| EV/Revenue | 13.6 |
| EV/EBITDA | 27.9 |
| Beta (5Y Monthly) | 1.32 |
| FCF Yield % (TTM) | 1.4% |
| Forward EPS (USD) | 10.4 |
| Analyst Target Price – Low (USD) | 225 |
| Analyst Target Price – Mean (USD) | 324.5 |
| Analyst Target Price – High (USD) | 405 |
| # Analyst Opinions | 31 |
Source: Yahoo Finance
Texas Instruments trades at 13.6x EV/revenue and 27.9x EV/EBITDA, with a 13.3x price to sales ratio and 14.3x price to book. The primary anchor here is EV/revenue, because the 1.4% FCF yield and 27.2x forward P/E already tell you the market is paying up for durable cash generation rather than near-term earnings cheapness. At 13.6x EV/revenue, the stock is priced for a long runway of high-margin analog and embedded processing cash flow, not for a cyclical trough multiple.
On the analysis here, I would put fair value in a range of about $282-$401 per share. That range sits broadly inside the analyst target range of $225-$405, and the fact that there are 31 analyst opinions gives that consensus real weight rather than a thin sample. My range is closer to the upper half of consensus because I give more credit to the 42.6% operating margin and 18.2% FCF margin than to the 1.4% FCF yield, but I do not think the current multiple deserves a much higher premium unless growth and cash conversion both stay firm.
Using the same operating logic, I would frame EPS in a range of about 10.4-$11.5, anchored by the company’s own forward EPS of 10.4. That sits above the peer group’s lower-quality names on a like-for-like basis because TI is converting revenue into profit more efficiently, but it is not so far above peers that the stock looks obviously cheap on earnings power alone. In other words, the earnings trajectory is solid, yet the market is already paying for that quality.
The earnings multiples are still usable, and they are not cheap: trailing P/E is 42.5x, forward P/E is 27.2x, and PEG is 1.2x. That combination implies investors are paying a premium for steady growth and quality, but not an extreme one if earnings keep compounding. The balance sheet supports that view, with net debt to EBITDA at 0.7x and total debt to equity at 78.0%, while the current ratio is 4.9x and cash per share is $7.7. The valuation picture is a bear signal on price, even if the business quality helps justify part of the premium.
Leverage
TXN — Leverage & Coverage (Quarterly)
| Metric | Value |
|---|---|
| Total Debt/Equity % (mrq) | 78 |
| Current Ratio (mrq) | 4.9 |
| Total Debt (mrq, USD Mil) | 14,052 |
| Operating Cash Flow (TTM, USD Mil) | 8,667 |
| Levered Free Cash Flow (TTM, USD Mil) | 3,545.2 |
| Net Debt/EBITDA (TTM) | 0.7 |
| FCF Margin % (TTM) | 18.2% |
Source: Yahoo Finance — Quarterly Financial Statements
Texas Instruments’ leverage is modest for a capital-intensive semiconductor maker. Total debt to equity was 78.0%, the current ratio was 4.9x, and total debt was $14.1B. Cash generation is the stronger signal: operating cash flow was $8.7B, levered free cash flow was $3.5B, net debt to EBITDA was 0.7x, and FCF margin was 18.2%.
In my opinion, this is low refinancing risk because the company has a 4.9x current ratio and net debt is only 0.7x EBITDA, so near-term liquidity is ample and debt is not stretched. The gap between $8.7B of operating cash flow and $3.5B of free cash flow shows that capex still absorbs a meaningful share of cash, but the business still converts enough earnings into cash to fund investment and balance-sheet needs without strain. That balance is important because the valuation premium is easier to defend when leverage is this contained.
Insider Activity
The insider transaction record I see here is one-sided: 74 open-market sales and 0 open-market purchases across 99 filings parsed from 2025-01-27 to 2026-05-28, so the sample is broad rather than thin. The selling is also spread across multiple insiders, not concentrated in one name, which suggests insiders are reducing exposure in a coordinated way rather than through one-off liquidity events. In my view, that is a bear signal because the open-market activity shows broad net selling with no offsetting insider buying.
Comparable Analysis
Growth
| Company | Revenue TTM (USD Mil) | Revenue Growth YoY % | EBITDA TTM (USD Mil) | Diluted EPS TTM |
|---|---|---|---|---|
| TXN | 19,453 | 22.8% | 9,520 | 6.7 |
| STX | 12,195 | 48.5% | 4,502 | 14.2 |
| WDC | 12,919 | 43.8% | 5,002 | 25.6 |
| TTDKY | 2,710,071.9 | 38.3% | 515,808 | 0.7 |
| ASMIY | 3,364 | 20.0% | 1,154.8 | 25.2 |
| CAJPY | 4,700,702.2 | 3.6% | 726,250 | 2.4 |
Source: Yahoo Finance
TXN’s revenue growth of 22.8% TTM trails STX at 48.5%, WDC at 43.8%, and TTDKY at 38.3%, but it is well ahead of CAJPY at 3.6% and ASMIY at 20.0%. That gap says TXN is growing faster than the mature cash-returning peer, yet slower than the most cyclical memory names, so I do not think the market should pay a top-of-group growth multiple unless the 51.8% quarterly earnings growth keeps compounding.
Valuation
| Company | Trailing P/E | Forward P/E | EV/Revenue | EV/EBITDA | Price/Sales (TTM) | Price/Book (mrq) | Market Cap (USD Mil) | Enterprise Value (USD Mil) | Beta (5Y Monthly) | FCF Yield % (TTM) | Forward EPS | Analyst Target Price – Low | Analyst Target Price – Mean | Analyst Target Price – High | # Analyst Opinions |
|---|---|---|---|---|---|---|---|---|---|---|---|---|---|---|---|
| TXN | 42.5 | 27.2 | 13.6 | 27.9 | 13.3 | 14.3 | 258,367 | 265,418 | 1.32 | 1.4% | 10.4 | 225 | 324.5 | 405 | 31 |
| STX | 69.9 | 18 | 18.7 | 50.6 | 18.5 | 203.9 | 225,817 | 227,658 | 2.10 | 0.9% | 55.4 | 700 | 1,125 | 1,600 | 23 |
| WDC | 21 | 16.9 | 14.9 | 38.6 | 15 | 25.6 | 193,254 | 192,866 | 2.22 | 1.2% | 31.7 | 420 | 664.9 | 1,050 | 24 |
| TTDKY | 31.3 | 26.4 | 0 | -0.1 | 0 | 2.7 | 38,589 | -49,076 | 0.70 | -87.5% | 0.8 | 26.5 | 26.5 | 26.5 | 1 |
| ASMIY | 41 | 28.6 | 14.7 | 43 | 15.1 | 9.9 | 50,722 | 49,613 | 1.52 | 0.5% | 36.2 | 1,280 | 1,280 | 1,280 | 1 |
| CAJPY | 11.8 | 12.9 | 0.2 | 1 | 0 | 1.1 | 24,230 | 753,504 | 0.25 | 692.9% | 2.2 | — | — | — | — |
Source: Yahoo Finance
TXN trades at 1.4% FCF yield TTM, 13.6x EV/revenue, 42.5x trailing P/E, and 27.2x forward P/E, versus STX at 0.9%, 18.7x, 69.9x, and 18.0x, WDC at 1.2%, 14.9x, 21.0x, and 16.9x, ASMIY at 0.5%, 14.7x, 41.0x, and 28.6x, and CAJPY at 692.9%, 0.2x, 11.8x, and 12.9x. On a value lens, TXN’s FCF yield is better than STX, WDC, and ASMIY, but the stock still screens rich because its forward P/E is above WDC and CAJPY despite TXN’s much stronger margins and balance sheet. Using peer EV/revenue of 13.6x to 18.7x on TXN’s $19.5B revenue implies about $265.4B to $364.2B of enterprise value, or roughly $282-$401 per share after netting $7B cash and $14.1B debt across 913.2M shares, which brackets the current price and says the premium is supported only if TXN keeps converting growth into cash.
Profitability
| Company | Operating Margin (TTM) | Net Margin (TTM) | Return on Assets (TTM) | Return on Equity (TTM) | Gross Margin (TTM) | EBITDA Margin (TTM) |
|---|---|---|---|---|---|---|
| TXN | 42.6% | 31.1% | 13.1% | 35.2% | 58.3% | 48.9% |
| STX | 43.1% | 26.1% | 29.4% | 371.5% | 45.6% | 36.9% |
| WDC | 43.6% | 72.9% | 20.8% | 130.9% | 48.9% | 38.7% |
| TTDKY | 11.6% | 8.7% | 4.5% | 11.6% | 31.1% | 19.0% |
| ASMIY | 32.2% | 31.9% | 11.5% | 26.8% | 51.8% | 34.3% |
| CAJPY | 13.5% | 7.4% | 4.9% | 10.4% | 47.9% | 15.4% |
Source: Yahoo Finance
TXN’s 42.6% operating margin, 31.1% net margin, 58.3% gross margin, and 48.9% EBITDA margin are stronger than CAJPY’s 13.5%, 7.4%, 47.9%, and 15.4%, and also above ASMIY’s 32.2%, 31.9%, 51.8%, and 34.3%. STX and WDC post similar operating margins at 43.1% and 43.6%, but TXN’s higher gross margin than STX’s 45.6% and WDC’s 48.9% points to a better cost structure. That is the important link for me: TXN is not winning on operating margin alone, it is winning on the quality of the gross margin base that feeds that margin.
Leverage
| Company | Total Debt/Equity % (mrq) | Current Ratio (mrq) | Total Debt (mrq, USD Mil) | Operating Cash Flow TTM (USD Mil) | Free Cash Flow TTM (USD Mil) | Net Debt/EBITDA (TTM) | FCF Margin % (TTM) |
|---|---|---|---|---|---|---|---|
| TXN | 78 | 4.9 | 14,052 | 8,667 | 3,545.2 | 0.7 | 18.2% |
| STX | 179.9 | 1.7 | 3,898 | 3,674 | 1,943.8 | 0.5 | 15.9% |
| WDC | 13.4 | 1.3 | 1,191 | 3,929 | 2,268.8 | -0.1 | 17.6% |
| TTDKY | 33 | 1.5 | 764,402 | 429,475 | -33,748.5 | -0.2 | -1.2% |
| ASMIY | 1.6 | 2.2 | 70.5 | 986.7 | 235.3 | -1 | 7.0% |
| CAJPY | 34.4 | 1.5 | 1,270,057 | 522,432 | 167,895.7 | 0.7 | 3.6% |
Source: Yahoo Finance
TXN’s 78.0% debt to equity is higher than WDC’s 13.4% and ASMIY’s 1.6%, but its 0.7x net debt to EBITDA and 18.2% FCF margin are healthier than STX’s 0.5x and 15.9% and far better than CAJPY’s 0.7x and 3.6%. That combination says TXN uses more balance-sheet leverage than WDC or ASMIY, yet the cash conversion is strong enough that the debt load looks like a financing choice, not a stress signal. It also helps explain why TXN can trade at a premium to lower-quality peers: the market is paying for balance-sheet safety plus cash generation, not just for growth.
Conclusion
I would put my rating as a Hold because the tension in Texas Instruments is not whether the business is high quality, but whether that quality is already fully reflected in the price. The latest quarter shows $5.5B of revenue, $2.9B of EBITDA, and 18.2% FCF margin, so the numbers are still moving in the right direction; the question is whether the newer fab base can keep those margins intact once growth normalizes.
I would raise my rating more towards a Buy if quarterly revenue stays above $5.5B and operating margin remains above 40%, meaning the newer fabs are translating scale into cash rather than just volume. If that happens, the current 1.4% FCF yield would likely look too low for the earnings power, and the market could start to underwrite a higher per-share cash flow base rather than just a premium multiple.
I would move from Hold to Sell if China-related sales weaken materially or if operating margin slips back toward the low 40s, because that would tell me the fixed-cost base is no longer being absorbed cleanly. A revenue pullback from the current $5.5B quarterly run rate would matter quickly here, since every point of underutilization hits a business with heavy factory costs and a large direct-sales footprint.
Weighing both paths, I lean to the bull case on business quality but not on timing, because the latest quarter still shows strong cash conversion while the valuation already discounts a lot of that strength. The stock can work from here, but I think the next move is more likely to be sideways until the company proves that the newer fab base can hold margins through a less forgiving demand backdrop.
What to Watch Next
- Quarterly revenue above $5.5B — would support a move more towards Buy.
- Operating margin above 40% — would show the fab ramp is still converting scale into profit.
- FCF margin holding near 18.2% — would confirm cash conversion is intact.
- China-related sales weakening materially — would push the rating more cautious.
- Net debt to EBITDA staying near 0.7x — would keep the balance sheet from becoming a thesis risk.
What’s your take? I rated Texas Instruments (TXN) HOLD above — but the goal here is to get this right, not just to publish an opinion. What would you add to this analysis, or which risk or catalyst do you think I’m under- or over-weighting? Tell me in the comments.
Sources
- SEC 10-K Annual Report — filed 2026-02-06
- SEC 8-K Filing (2026-06-02)
- SEC 8-K Filing (2026-04-22)
- SEC 8-K Filing (2026-04-17)
- SEC 8-K Filing (2026-03-25)
- SEC 8-K Filing (2026-02-06)
- SEC 8-K Filing (2026-02-04)
- SEC Form 4 Insider Transaction (2026-05-29)
- SEC Form 4 Insider Transaction (2026-05-15)
- SEC Form 4 Insider Transaction (2026-05-15)
- SEC 10-K Annual Report — FY2026
- SEC 10-K Annual Report — FY2025
- SEC 10-K Annual Report — FY2024
- SEC 10-K Annual Report — FY2023
- SEC 10-K Annual Report — FY2022
Data sourced from Yahoo Finance and SEC EDGAR. Not investment advice.
Leave a Comment