
| Company | Aug 25 | Sep 25 | Oct 25 | Nov 25 | Dec 25 | Jan 26 | Feb 26 | Mar 26 | Apr 26 | May 26 | Jun 26 | Jul 26 | 12-Mo |
|---|---|---|---|---|---|---|---|---|---|---|---|---|---|
| SWBI | +3% | +22% | -2% | -9% | +15% | +11% | +9% | +22% | +8% | -2% | -1% | -2% | +91% |
| AOUT | +11% | -17% | -21% | +4% | +8% | +17% | +0% | +3% | +1% | +8% | +16% | +5% | +31% |
| RGR | +2% | +25% | -2% | -29% | +8% | +12% | +2% | +7% | +8% | -10% | -3% | -2% | +10% |
| SPWH | -20% | +3% | -11% | -10% | -35% | -6% | -14% | +19% | +0% | -6% | +1% | -14% | -66% |
| POWW | +21% | +3% | +8% | +15% | -7% | -5% | +31% | -6% | +1% | +1% | +11% | -6% | +81% |
| PEW | -17% | -12% | -1% | -24% | -14% | +3% | -11% | +9% | -3% | -7% | -16% | +9% | -61% |
Source: Yahoo Finance monthly adjusted close.
Quick Thesis
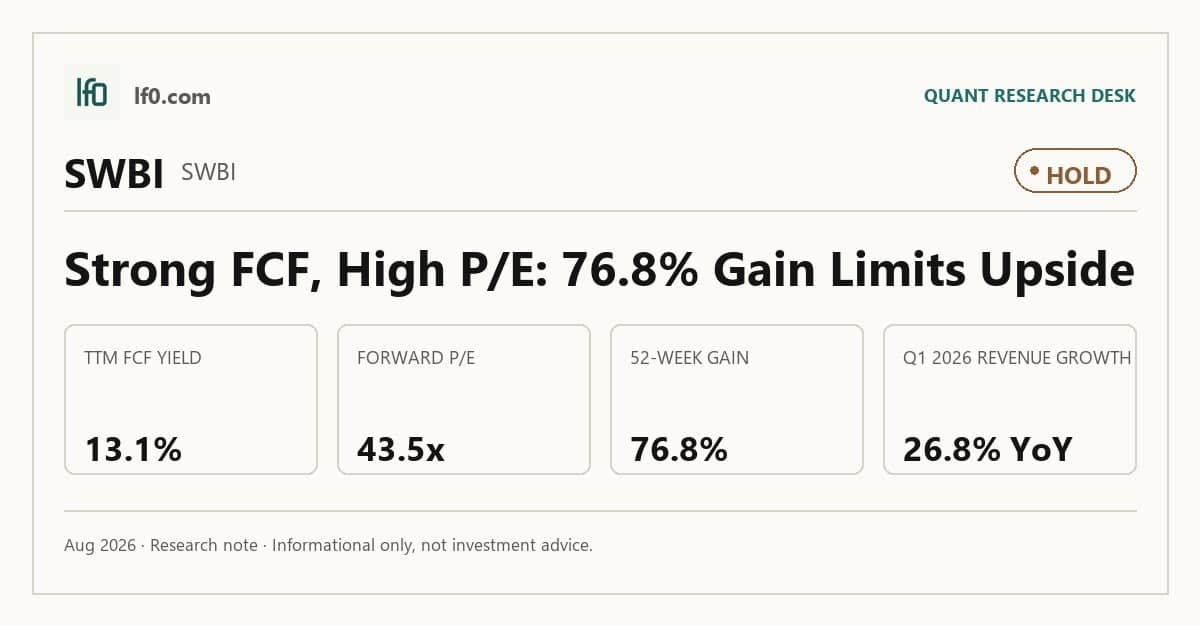
- Rated Hold — the stock already discounts a recovery that is not yet fully steady.
- Strongest point: 13.1% TTM FCF yield and 0.3x net debt/EBITDA.
- Main risk: 43.5x forward P/E against choppy quarterly revenue.
- Valuation looks fair to slightly rich versus peers at 11.1x EV/EBITDA.
- I would turn more constructive if quarterly EBITDA stays above $29.1M.
Executive Summary
Rating: HOLD | SWBI
Measured from adjusted close on 2026-08-14 to 2026-09-25. Sell ratings are correct when the stock falls; Hold is tracked as a +/-10% range. Daily-close data, not intraday. Calls are tracked for 182 days from publication, then frozen as a final record.
I would put my rating as a Hold because the business is generating real cash, but the market is already paying for a cleaner earnings path than the quarterly record has delivered. In my view, the key strength is the 13.1% TTM FCF yield, which gives the company room to fund a 3.6% dividend yield and buybacks without leaning on the balance sheet. The main risk is valuation: 43.5x forward P/E leaves little margin for error if the current earnings run rate softens. I would raise my rating more towards a Buy if quarterly EBITDA holds above $29.1M for two more quarters, because that would show the latest operating step-up is durable rather than a one-quarter spike.
Company Profile
Smith & Wesson Brands makes firearms and related products for civilian, law-enforcement, and military customers. Revenue is driven by product mix, channel demand, and the timing of shipments, so quarterly results can move sharply even when the longer-term business remains profitable. The company also has a meaningful cash-return profile, with dividends and repurchases layered on top of operating cash generation.
Economic Moat
Business Model
The moat here is not a classic network effect or subscription model. I think it rests on brand recognition, product breadth, and a distribution footprint that lets the company convert demand spikes into cash quickly when the market is favorable. That matters because the business can produce strong cash flow even when revenue is uneven, which is a real advantage in a cyclical category.
Business & Operating Risks
The filing highlights demand volatility, legal and regulatory exposure, and the risk that product mix or channel inventory can swing results from quarter to quarter. Those risks do not break the moat, but they do make the moat less visible in any single quarter because the company’s brand strength can be masked by abrupt changes in demand and margin. The disclosed risks pressure the earnings cadence more than the structural franchise itself.
Management Discussion & Analysis
Management is responding by keeping capital returns active while preserving liquidity, and that tells me the team is not treating the current volatility as a balance-sheet emergency. The company also continues to emphasize profitability and cash generation rather than chasing volume at any cost, which is the right response to the demand swings surfaced above. I think that is a sensible posture, but it still leaves the market waiting for a steadier earnings base before it awards a higher multiple.
Recent Events
Recent 8-Ks point to a stable operating and governance backdrop rather than a major strategic reset. The October 3, 2024 credit agreement amendment expanded the revolver to $175M, including a $5M swingline and a possible $50M increase option, which improves liquidity flexibility without changing the core business model. The September 17, 2024 auditor change from Deloitte to KPMG looks like a governance refresh, not a distress signal, and the routine earnings releases did not introduce anything that would materially weaken the moat thesis.
Financial Analysis
Growth
SWBI — Financial Growth (Quarterly, USD Mil)
| Metric | 2025-04-30 | 2025-07-31 | 2025-10-31 | 2026-01-31 | 2026-04-30 |
|---|---|---|---|---|---|
| REVENUE (USD Mil) | 140.8 | 85.1 | 124.7 | 135.7 | 178.4 |
| EBIT (USD Mil) | 14.6 | -2.9 | 4.4 | 6.9 | 21.5 |
| EBITDA (USD Mil) | 22.6 | 5.5 | 12.4 | 14.1 | 29.1 |
| NET INCOME (USD Mil) | 9.7 | -3.4 | 1.9 | 3.8 | 16.2 |
| DILUTED EPS | 0.2 | -0.1 | 0 | 0.1 | 0.4 |
Source: Yahoo Finance — Quarterly Financial Statements
Revenue rose to $178.4M in Q1 2026 from $140.8M a year earlier, and EBITDA increased to $29.1M from $22.6M. That is a healthy top-line and margin step-up, but the path was uneven because revenue fell to $85.1M before recovering, so I would treat the latest quarter as encouraging rather than definitive. The 26.8% year-over-year revenue gain is consistent with a business that can reaccelerate, but it still needs a second strong quarter to prove the move is durable.
Profitability
SWBI — Profitability (TTM)
| Metric | TTM |
|---|---|
| Operating Margin (TTM) | 11.8% |
| Net Margin (TTM) | 3.5% |
| Return on Assets (TTM) | 3.3% |
| Return on Equity (TTM) | 4.9% |
| Gross Margin (TTM) | 26.9% |
| EBITDA Margin (TTM) | 11.4% |
Source: Yahoo Finance — Trailing Twelve Months (TTM)
TTM operating margin was 11.8%, net margin was 3.53%, and EBITDA margin was 11.4%, so the company is clearly profitable on a trailing basis. Gross margin of 26.9% shows the product economics are workable, while ROA of 3.35% and ROE of 4.93% suggest the business is earning acceptable returns without relying on heavy leverage. I view that mix as constructive, but not yet strong enough to justify a premium multiple on profitability alone.
Valuation
SWBI — Valuation Multiples
| Metric | Value |
|---|---|
| Market Cap (USD Mil) | 643 |
| Enterprise Value (USD Mil) | 661 |
| Trailing P/E | 35 |
| Forward P/E | 43.5 |
| Price/Sales (TTM) | 1.2 |
| Price/Book (mrq) | 1.7 |
| EV/Revenue | 1.3 |
| EV/EBITDA | 11.1 |
| Beta (5Y Monthly) | 0.89 |
| FCF Yield % (TTM) | 13.1% |
| Forward EPS (USD) | 0.3 |
| Analyst Target Price – Low (USD) | 16.5 |
| Analyst Target Price – Mean (USD) | 17.2 |
| Analyst Target Price – High (USD) | 18 |
| # Analyst Opinions | 2 |
Source: Yahoo Finance
The stock trades at 11.1x EV/EBITDA, 1.26x EV/Revenue, 35x trailing P/E, and 43.5x forward P/E, which is not cheap for a business with choppy quarterly revenue. FCF yield is 13.1%, which is the best anchor in the valuation set because it shows the company is still converting earnings into cash at a healthy rate. On the analysis here, I would put fair value in a range of about $16.5–$18, which sits inside the analyst target range of $16.5–$18 from two opinions and is close to the current market’s implied optimism. I also think forward EPS of 0.33 is the right lens for peer comparison: it is not obviously rich on an absolute basis, but it looks expensive relative to the company’s own uneven quarterly cadence and to peers with cleaner earnings paths. The market is paying for cash generation and balance-sheet flexibility, not for a high-growth rerating, and that is why I still see the shares as fair to slightly rich rather than clearly cheap.
Leverage
SWBI — Leverage & Coverage (Quarterly)
| Metric | Value |
|---|---|
| Total Debt/Equity % (mrq) | 14.1 |
| Current Ratio (mrq) | 3.2 |
| Total Debt (mrq, USD Mil) | 53.1 |
| Operating Cash Flow (TTM, USD Mil) | 114.2 |
| Levered Free Cash Flow (TTM, USD Mil) | 84.1 |
| Net Debt/EBITDA (TTM) | 0.3 |
| FCF Margin % (TTM) | 16.1% |
Source: Yahoo Finance — Quarterly Financial Statements
Total debt was $53.14M, with a current ratio of 3.203x and net debt/EBITDA of 0.331x, so the balance sheet is not the constraint here. Operating cash flow was $114.2M TTM and levered free cash flow was $84.15M TTM, which means the company is funding dividends and buybacks from real cash generation rather than financial engineering. That low leverage is a support for the thesis because it gives management room to absorb a softer quarter without forcing a cut to capital returns.
Insider Activity
I do not see open-market insider buying or selling in the filing window, so there is no directional signal from management trades. That leaves the investment case to be judged on operations, cash flow, and valuation rather than insider conviction.
Comparable Analysis
Growth
| Company | Revenue TTM (USD Mil) | Revenue Growth YoY % | EBITDA TTM (USD Mil) | Diluted EPS TTM |
|---|---|---|---|---|
| SWBI | 523.8 | 26.7% | 59.8 | 0.4 |
| AOUT | 190.5 | -24.0% | 6.9 | -0.7 |
| RGR | 577.2 | 19.3% | 32.5 | 0.7 |
| SPWH | 1,216.2 | 2.8% | 25.4 | -1.3 |
| POWW | 53.7 | 22.1% | 22.3 | 0 |
| PEW | 99 | 11.1% | -7 | -0.2 |
Source: Yahoo Finance
SWBI’s revenue growth of 26.7% TTM on 11.79 of revenue per share is ahead of RGR’s 19.3% on $577.2M and well above AOUT’s -24.0% on $190.5M. SPWH grew only 2.8% on $1.2B, while POWW posted 22.1% on a much smaller $53.7M base. I think SWBI’s growth stands out because it is paired with positive diluted EPS of 0.36, so the market is not paying for growth that still loses money.
Valuation
| Company | Trailing P/E | Forward P/E | EV/Revenue | EV/EBITDA | Price/Sales (TTM) | Price/Book (mrq) | Market Cap (USD Mil) | Enterprise Value (USD Mil) | Beta (5Y Monthly) | FCF Yield % (TTM) | Forward EPS | Analyst Target Price – Low | Analyst Target Price – Mean | Analyst Target Price – High | # Analyst Opinions |
|---|---|---|---|---|---|---|---|---|---|---|---|---|---|---|---|
| SWBI | 35 | 43.5 | 1.3 | 11.1 | 1.2 | 1.7 | 643 | 661 | 0.89 | 13.1% | 0.3 | 16.5 | 17.2 | 18 | 2 |
| AOUT | — | 15.8 | 0.9 | 25.1 | 0.8 | 0.9 | 158 | 172 | 0.28 | 5.8% | 0.8 | 13.5 | 14.2 | 15 | 2 |
| RGR | 50.7 | 18.5 | 0.8 | 14.9 | 1 | 2.1 | 599 | 485 | 0.23 | 6.3% | 2 | 40 | 43 | 46 | 2 |
| SPWH | — | -4.2 | 0.5 | 21.6 | 0 | 0.3 | 47 | 549 | 0.41 | 67.4% | -0.3 | 2.2 | 2.9 | 3.5 | 3 |
| POWW | 113.3 | — | 3.7 | 8.9 | 4.9 | 1.1 | 263 | 197 | 1.02 | 4.3% | 0 | 3 | 3.5 | 4 | 2 |
| PEW | — | — | -0.2 | 2.7 | 0.8 | 0.7 | 75 | -19 | -0.07 | — | — | 6.8 | 6.8 | 6.8 | 1 |
Source: Yahoo Finance
SWBI trades at 11.1x EV/EBITDA and 1.26x EV/Revenue, versus RGR at 14.9x and 0.8x, AOUT at 25.1x and 0.9x, SPWH at 21.6x and 0.5x, and POWW at 8.9x and 3.7x. That mix says SWBI is not the cheapest name on earnings, but it is also not being priced like a distressed retailer; the market is paying for a cleaner cash profile and a stronger balance sheet. On a $1 invested basis, SWBI’s 80.8% one-year total return outpaced RGR’s 8.9% and AOUT’s 32.2%, which tells me the stock has already re-rated for the better operating and cash-flow profile. The valuation premium is easier to justify than it would be for a weaker balance sheet, but it is still a premium.
Profitability
| Company | Operating Margin (TTM) | Net Margin (TTM) | Return on Assets (TTM) | Return on Equity (TTM) | Gross Margin (TTM) | EBITDA Margin (TTM) |
|---|---|---|---|---|---|---|
| SWBI | 11.8% | 3.5% | 3.3% | 4.9% | 26.9% | 11.4% |
| AOUT | -0.8% | -4.8% | -1.5% | -5.4% | 44.7% | 3.6% |
| RGR | 5.3% | 2.1% | 1.5% | 4.2% | 18.8% | 5.6% |
| SPWH | -6.8% | -4.2% | -0.9% | -26.5% | 30.7% | 2.1% |
| POWW | 22.8% | 12.1% | 2.4% | 2.0% | 87.8% | 41.5% |
| PEW | -10.2% | -4.5% | — | -8.4% | 12.0% | -7.1% |
Source: Yahoo Finance
SWBI’s 11.8% operating margin and 11.4% EBITDA margin compare favorably with RGR’s 5.3% and 5.6%, AOUT’s -0.8% and 3.6%, and SPWH’s -6.8% and 2.1%. Gross margin of 26.9% is not the highest in the group, but the company converts more of that gross profit into operating income than most peers, which is the more important point for equity holders. ROE of 4.93% and ROA of 3.35% also sit above most of the set, so the profitability profile supports the thesis rather than challenging it.
Leverage
| Company | Total Debt/Equity % (mrq) | Current Ratio (mrq) | Total Debt (mrq, USD Mil) | Operating Cash Flow TTM (USD Mil) | Free Cash Flow TTM (USD Mil) | Net Debt/EBITDA (TTM) | FCF Margin % (TTM) |
|---|---|---|---|---|---|---|---|
| SWBI | 14.1 | 3.2 | 53.1 | 114.2 | 84.2 | 0.3 | 16.1% |
| AOUT | 19.5 | 5.4 | 32.4 | 6.3 | 9.2 | 1.6 | 4.8% |
| RGR | 0.5 | 3.3 | 1.5 | 64.5 | 37.6 | -3.6 | 6.5% |
| SPWH | 301.7 | 1.2 | 504.4 | 36.2 | 31.4 | 19.8 | 2.6% |
| POWW | 4.6 | 4.7 | 10.9 | 14.1 | 11.2 | -2.6 | 20.9% |
| PEW | 7.6 | 6.9 | 7.9 | -3.4 | — | 14 | — |
Source: Yahoo Finance
SWBI’s 14.11% debt/equity and 0.331x net debt/EBITDA are far cleaner than SPWH’s 301.7% and 19.8x, and they are also better than AOUT’s 19.5% and 1.6x. Current ratio of 3.203x and FCF margin of 16.06% show the company has both liquidity and cash conversion, which is why I view leverage as a structural advantage rather than just a conservative capital structure. That lower leverage also helps explain why SWBI can support a dividend and repurchases while still keeping flexibility for the business.
Conclusion
I would put my rating as a Hold because the company has already earned a better balance-sheet profile and stronger cash generation, but the stock has also already priced in a good part of that improvement. The tension I am focused on is simple: quarterly EBITDA has improved to $29.1M, yet revenue has still been choppy enough that I do not want to assume the latest run rate is permanent. If the company can hold EBITDA above $29.1M for two more quarters and keep FCF margin near 16.06%, I would move more towards a Buy because that would show the earnings base is stabilizing and the cash return profile can continue without strain. If revenue slips back below $130M for two straight quarters, I would move from Hold toward Sell because that would tell me the recent rebound was temporary and the current multiple is too rich for the underlying cadence.
For now, I think the stronger evidence is on the side of patience. The balance sheet and cash flow keep this out of a bearish call, but the market is still paying for consistency that the quarterly record has not fully delivered.
What to Watch Next
- Quarterly EBITDA above $29.1M — would support a move toward Buy.
- Revenue above $170M for two straight quarters — would confirm the latest rebound.
- FCF margin near 16.06% — would support continued dividends and buybacks.
- Revenue below $130M for two straight quarters — would push the rating toward Sell.
- Net debt/EBITDA staying near 0.331x — would keep balance-sheet risk low.
What’s your take? I rated Smith & Wesson Brands (SWBI) HOLD above — but the goal here is to get this right, not just to publish an opinion. What would you add to this analysis, or which risk or catalyst do you think I’m under- or over-weighting? Tell me in the comments.
Sources
- SEC 10-K Annual Report — filed 2024-06-20
- SEC 8-K Filing (2024-12-05)
- SEC 8-K Filing (2024-10-04)
- SEC 8-K Filing (2024-09-20)
- SEC 8-K Filing (2024-09-05)
- SEC 8-K Filing (2024-06-20)
- SEC 8-K Filing (2024-03-22)
- SEC Form 4 Insider Transaction (2026-05-05)
- SEC Form 4 Insider Transaction (2026-05-05)
- SEC Form 4 Insider Transaction (2026-05-05)
- SEC 10-K Annual Report — FY2021
- SEC 10-K Annual Report — FY2020
Data sourced from Yahoo Finance and SEC EDGAR. Not investment advice.
Leave a Comment