
Expected price range
Each range is set from the stock’s recent price history and our Strong Sell rating, using its own 1-year realised volatility (67% annualised) as the width of a ~68% statistical band, and checked against that rating so the range leans the same way as our view. Starting price $27.06 (close 2026-10-29). The stock traded between $24.21 and $42.13 over the last 6 months and between $24.21 and $42.13 over the last year. This is an illustration of where our view and normal volatility point, not a forecast, price target or investment advice; the stock can move outside it.
| Company | Oct 25 | Nov 25 | Dec 25 | Jan 26 | Feb 26 | Mar 26 | Apr 26 | May 26 | Jun 26 | Jul 26 | Aug 26 | Sep 26 | 12-Mo |
|---|---|---|---|---|---|---|---|---|---|---|---|---|---|
| VKTX | +45% | -3% | -4% | -17% | +17% | -4% | -4% | +5% | +19% | -19% | +3% | -1% | +24% |
| NVO | -11% | -0% | +3% | +17% | -37% | +2% | +15% | +8% | +5% | -2% | -2% | -16% | -28% |
| BCRX | -4% | -2% | +9% | -16% | +33% | +9% | -4% | -3% | +12% | -10% | +8% | -14% | +10% |
| ABBV | -5% | +4% | +0% | -2% | +4% | -6% | -2% | +3% | +16% | +0% | +2% | +2% | +16% |
| MDGL | -9% | +43% | -2% | -16% | -12% | +21% | -1% | -4% | +8% | -13% | +16% | -7% | +10% |
| ALT | +7% | +30% | -31% | +55% | -23% | -29% | -16% | +17% | -0% | -7% | +10% | -8% | -24% |
Source: Yahoo Finance monthly adjusted close.
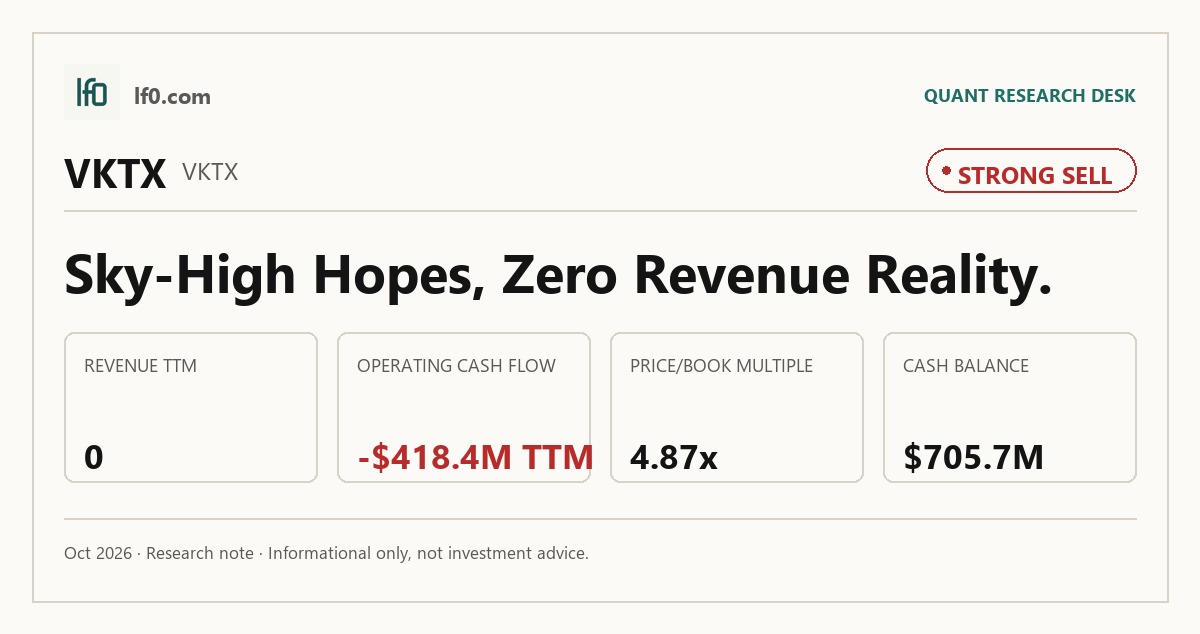
Quick Thesis
- Rated strong sell — cash burn is the core issue, not debt.
- Biggest strength: $501.7M of cash and a 4.7x current ratio.
- Biggest risk: $418.4M of TTM operating cash outflow.
- Valuation is rich at 4.9x book with no earnings base.
- I would improve only if Phase 3 stays on track and burn eases.
Executive Summary
Rating: STRONG SELL | VKTX
Measured from adjusted close on 2026-10-29 to 2026-10-29. Sell ratings are correct when the stock falls; Hold is tracked as a +/-10% range. Daily-close data, not intraday. Calls are tracked for 182 days from publication, then frozen as a final record.
I would put my rating as a strong sell because Viking Therapeutics is still a pre-revenue biotech with heavy cash burn, and the stock already prices in a lot of pipeline success. The company’s main strength is liquidity: it had $501.7M of cash and a 4.7x current ratio at the most recent quarter, which gives it room to fund development. The main risk is the burn rate, with $418.4M of operating cash outflow over the past year and $230.8M of levered free cash flow outflow, so the balance sheet is being consumed faster than the pipeline is monetized. I would move toward a sell if Phase 3 obesity data slips or if cash burn stays near the current pace, because that would shift the story from clinical optionality to financing pressure.
Company Profile
Viking Therapeutics is a clinical-stage biopharmaceutical company focused on metabolic and endocrine disorders. Its lead program is VK2735, a dual GLP-1 and GIP receptor agonist being developed in subcutaneous and oral forms for obesity. The pipeline also includes VK2809 for metabolic liver disease, VK0214 for X-linked adrenoleukodystrophy, and VK5211 for post-hip-fracture muscle loss. The company was incorporated in Delaware in 2012 and trades on Nasdaq under VKTX.
The business is headquartered in San Diego and had 53 full-time employees at December 31, 2025. It does not own manufacturing facilities, so it depends on contract manufacturers, including CordenPharma, for active ingredient and finished-dose supply. That operating model keeps fixed overhead light, but it also means Viking must secure outside capacity before it can commercialize anything.
Economic Moat
Business Model
The clearest structural advantage is the CordenPharma supply arrangement for VK2735. In March 2025, Viking locked in dedicated capacity for 100 million autoinjectors, 100 million vial and syringe products, and more than 1 billion oral tablets annually, with capacity expandable at Viking’s option. I feel that is hard to replicate quickly because it requires scarce biologics manufacturing slots, validated fill-finish lines, and a prepayment structure that secures supply before commercial demand is proven.
The second pillar is the clinical package itself. VK2735 showed up to 14.7% mean body-weight reduction in Phase 2, and the oral version showed up to 12.2% in Phase 2 as well. That matters because the moat is not just manufacturing access; it is the combination of a differentiated obesity asset and reserved supply that could support launch if the data continue to hold up.
Business & Operating Risks
The most material disclosed risk is Viking’s dependence on Ligand Pharmaceuticals under the Master License Agreement. That agreement covers several programs, and Ligand can terminate it for insolvency, nonpayment, or default on material obligations. In plain terms, that is a direct control point over part of the pipeline, not a generic biotech risk.
Clinical and regulatory execution is the other major threat. VK2735 subcutaneous is in Phase 3, the oral program is earlier, and the rest of the pipeline is still in development, so the company is years away from proving that any asset can clear the FDA approval bar. The filing also points to slower enrollment, toxicology or efficacy setbacks, and the need for additional studies, which is exactly the kind of uncertainty that can delay a launch.
The risk set does not yet look like it is breaking the moat, but it is testing it. The Ligand dependency and third-party manufacturing chain could slow or block commercialization if execution slips, which would directly threaten the reserved-capacity advantage behind VK2735.
Management Discussion & Analysis
Management is responding to those risks by pushing capital into VK2735 and securing supply ahead of launch. The CordenPharma agreements are a clear sign that the company is trying to de-risk manufacturing, while the move into Phase 3 shows it is pressing the lead asset forward rather than pausing for balance-sheet repair. That is the right response to the disclosed risks, although it also raises the cash burden before revenue exists.
The spending profile confirms that trade-off. Research and development expense rose to $345.0 million in 2025 from $101.6 million in 2024, so management is clearly leaning into late-stage development. In my view, that is credible execution, but it also means the company is buying optionality with cash rather than generating it.
Recent Events
The April 29, 2026 first-quarter update did not bring a new strategic pivot, deal, or financing event, so it left the core thesis unchanged. That matters because it suggests management is still executing the same plan rather than changing course in response to pressure.
The May 19, 2026 annual meeting was also a governance continuation event rather than a strategic inflection. Shareholders elected J. Matthew Singleton and S. Kathryn Rouan, Ph.D. as Class II directors and approved executive pay on an advisory basis, but I do not see that as changing the moat case in a material way.
Financial Analysis
Growth
VKTX — Financial Growth (Quarterly, USD Mil)
| Metric | 2025-06-30 | 2025-09-30 | 2025-12-31 | 2026-03-31 | 2026-06-30 |
|---|---|---|---|---|---|
| EBIT (USD Mil) | -74.6 | -98.6 | -164.7 | -164.1 | -132.6 |
| EBITDA (USD Mil) | -74.5 | -98.4 | -164.6 | -164 | -132.4 |
| NET INCOME (USD Mil) | -65.6 | -90.8 | -157.7 | -158.3 | -128 |
| DILUTED EPS | -0.6 | -0.8 | -1.4 | -1.4 | -1.1 |
Source: Yahoo Finance — Quarterly Financial Statements
Revenue is still effectively zero, so the growth discussion is really about the loss trajectory. EBIT moved from -$74.6M in Q2 2025 to -$98.6M in Q3 2025, then widened to -$164.7M in Q4 2025 before improving to -$132.6M in Q2 2026. EBITDA followed the same pattern, which tells me the company is still spending ahead of revenue and that the recent improvement is a cost reset, not a commercial inflection.
That is consistent with the company’s stage, but it also means the moat has not yet translated into sales. The key point for investors is that the pipeline can still create value, yet the current numbers do not show operating leverage.
Profitability
VKTX — Profitability (TTM)
| Metric | TTM |
|---|---|
| Operating Margin (TTM) | 0.0% |
| Net Margin (TTM) | 0.0% |
| Return on Assets (TTM) | -51.9% |
| Return on Equity (TTM) | -88.9% |
Source: Yahoo Finance — Trailing Twelve Months (TTM)
TTM operating margin was 0.0% and TTM net margin was 0.0%, which is what I would expect from a pre-commercial biotech. Return on assets was -51.9% and return on equity was -88.9%, so capital is still being consumed rather than compounded.
I would watch for a positive operating margin first, because that would show the business is starting to absorb its development spend with actual product revenue. Until then, the profitability profile remains a bear signal.
Valuation
VKTX — Valuation Multiples
| Metric | Value |
|---|---|
| Current Share Price (USD) | 27.1 |
| Market Cap (USD Mil) | 3,450 |
| Enterprise Value (USD Mil) | 2,461 |
| Forward P/E | -6.2 |
| Price/Book (mrq) | 4.9 |
| Beta (5Y Monthly) | 0.65 |
| FCF Yield % (TTM) | -6.7% |
| Forward EPS (USD) | -4.3 |
| Analyst Target Price – Low (USD) | 38 |
| Analyst Target Price – Mean (USD) | 95.1 |
| Analyst Target Price – High (USD) | 125 |
| # Analyst Opinions | 19 |
Source: Yahoo Finance
I would put the stock’s fair value in a wide range of roughly $20-$40 on the analysis here, with the lower end reflecting the current cash burn and the upper end reflecting successful Phase 3 execution and launch optionality. That range sits well below the $95.1 analyst mean target and inside the $38–$125 analyst range, which tells me the Street is still assigning a much richer outcome than I am.
The stock trades at 27.1 per share, 4.87x price/book, and a -6.25x forward P/E because forward EPS is -4.34. I do not think that is cheap for a company with no revenue base and negative free cash flow, even though the balance sheet is still solid. The market is paying for pipeline optionality, not current economics, and that is why I keep the valuation view negative.
Leverage
VKTX — Leverage & Coverage (Quarterly)
| Metric | Value |
|---|---|
| Total Debt/Equity % (mrq) | 1 |
| Current Ratio (mrq) | 4.7 |
| Total Debt (mrq, USD Mil) | 4.1 |
| Operating Cash Flow (TTM, USD Mil) | -418.4 |
| Levered Free Cash Flow (TTM, USD Mil) | -230.8 |
Source: Yahoo Finance — Quarterly Financial Statements
Debt is not the problem here. Total debt was $4.086M, debt-to-equity was 1.001%, and the current ratio was 4.72x, so the balance sheet has room.
The real issue is cash consumption. Operating cash flow was $418.4M TTM and levered free cash flow was $230.8M TTM, which means the company is funding development with its cash balance rather than with operations. That is why I focus more on runway than on leverage: the debt load is tiny, but the burn rate is large enough to matter if development timing slips.
Insider Activity
The insider tape is net negative. There were 19 open-market sales totaling $24.8M versus 3 purchases totaling $0.2M, and the selling was concentrated among senior insiders rather than spread evenly across the register.
Brian Lian’s January 5 sales were the largest part of that pattern, while the lone recent buy from Neil William Aubuchon was too small to offset it. I read that as a bearish signal because insiders are reducing exposure faster than they are adding it.
Comparable Analysis
Growth
| Company | Revenue TTM (USD Mil) | Revenue Growth YoY % | Diluted EPS TTM |
|---|---|---|---|
| VKTX | — | — | -4.7 |
| NVO | 329,431 | 2.1% | 4.1 |
| BCRX | 940.6 | 33.6% | -1.4 |
| ABBV | 64,386 | 10.2% | 3.5 |
| MDGL | 1,283.9 | 71.2% | -12.8 |
| ALT | 0 | — | -0.8 |
Source: Yahoo Finance
VKTX has no reported TTM revenue growth, while NVO grew revenue 2.1%, BCRX grew 33.6%, ABBV grew 10.2%, and MDGL grew 71.2%. That gap is not a normal operating lag; it is a development-stage profile, so the stock only deserves a premium if investors are underwriting pipeline success rather than current earnings power.
Valuation
| Company | Current Share Price (USD) | Trailing P/E | Forward P/E | EV/Revenue | EV/EBITDA | Price/Sales (TTM) | Price/Book (mrq) | Market Cap (USD Mil) | Enterprise Value (USD Mil) | Beta (5Y Monthly) | FCF Yield % (TTM) | Forward EPS | Analyst Target Price – Low | Analyst Target Price – Mean | Analyst Target Price – High | # Analyst Opinions |
|---|---|---|---|---|---|---|---|---|---|---|---|---|---|---|---|---|
| VKTX | 27.1 | — | -6.2 | — | — | — | 4.9 | 3,450 | 2,461 | 0.65 | -6.7% | -4.3 | 38 | 95.1 | 125 | 19 |
| NVO | 39 | 9.5 | 11.3 | 0.8 | 1.5 | 0.5 | 5.2 | 172,171 | 264,695 | 0.38 | 21.9% | 3.4 | 39.7 | 45 | 61.6 | 12 |
| BCRX | 8.5 | — | 10.3 | 2.8 | 6.1 | 2.3 | -4.8 | 2,166 | 2,623 | 0.55 | 14.9% | 0.8 | 11 | 20.5 | 32 | 11 |
| ABBV | 289 | 81.6 | 17.8 | 8.8 | 18.5 | 7.9 | -86 | 510,670 | 569,741 | 0.23 | 3.3% | 16.2 | 200 | 283.2 | 325 | 27 |
| MDGL | 439.3 | — | 45.6 | 7.4 | -29.5 | 7.9 | 19.4 | 10,150 | 9,467 | -1.05 | -0.8% | 9.6 | 533 | 685.2 | 962 | 18 |
| ALT | 2.2 | — | -3.2 | 3,813.7 | -1.2 | 13,559.8 | 0.9 | 420 | 118 | 0.06 | -11.6% | -0.7 | 11 | 17.1 | 28 | 9 |
Source: Yahoo Finance
VKTX trades at 27.1 with a -6.25x forward P/E and a -6.69% FCF yield, while NVO trades at 11.3x forward P/E and 21.9% FCF yield, BCRX at 10.3x and 14.9%, and ABBV at 17.8x and 3.3%. On a like-for-like basis, VKTX is being priced for a clinical catalyst, not for cash generation, and that is why I think the multiple is demanding rather than cheap.
The peer set also helps frame the market’s expectations. VKTX’s analyst target range of $38 to $125 sits above the current price, but the wide spread tells me the market is still debating how much value to assign to the obesity pipeline versus the cash burn.
Profitability
| Company | Operating Margin (TTM) | Net Margin (TTM) | Return on Assets (TTM) | Return on Equity (TTM) | Gross Margin (TTM) | EBITDA Margin (TTM) |
|---|---|---|---|---|---|---|
| VKTX | 0.0% | 0.0% | -51.9% | -88.9% | — | — |
| NVO | 42.5% | 35.3% | 18.7% | 59.8% | 82.0% | 52.7% |
| BCRX | 45.1% | -40.9% | 52.9% | — | 77.4% | 46.0% |
| ABBV | 40.0% | 9.8% | 10.5% | — | 72.8% | 47.8% |
| MDGL | -15.5% | -25.3% | -17.8% | -53.3% | 91.5% | -25.0% |
| ALT | -318,493.5% | 0.0% | -17.2% | -28.9% | -215,138.7% | -318,174.2% |
Source: Yahoo Finance
VKTX shows 0.0% operating and net margin, with ROA of -51.9% and ROE of -88.9%. By contrast, NVO posts 42.5% operating margin and 59.8% ROE, ABBV posts 40.0% operating margin and 10.5% ROA, and BCRX posts 45.1% operating margin and 46.0% EBITDA margin.
That spread says VKTX is still in pure investment mode, not a scaled commercial model. The profitability discount is structural for now, and it will stay that way until the company proves it can turn the pipeline into revenue.
Leverage
| Company | Total Debt/Equity % (mrq) | Current Ratio (mrq) | Total Debt (mrq, USD Mil) | Operating Cash Flow TTM (USD Mil) | Free Cash Flow TTM (USD Mil) | Net Debt/EBITDA (TTM) | FCF Margin % (TTM) |
|---|---|---|---|---|---|---|---|
| VKTX | 1 | 4.7 | 4.1 | -418.4 | -230.8 | — | — |
| NVO | 63.3 | 0.9 | 140,127 | 131,881 | 37,673.2 | 0.5 | 11.4% |
| BCRX | — | 2.3 | 836.6 | 376.1 | 323.7 | 1.1 | 34.4% |
| ABBV | — | 0.8 | 70,885 | 19,507 | 16,870.2 | 2.1 | 26.2% |
| MDGL | 66.4 | 3.2 | 347.8 | -197.7 | -80.5 | 1.5 | -6.3% |
| ALT | 7.6 | 26.8 | 36 | -76.5 | -48.8 | 2.9 | -157,374.6% |
Source: Yahoo Finance
VKTX’s debt-to-equity ratio is only 1.0% and its current ratio is 4.7x, which is much cleaner than the leverage profiles of NVO, ABBV, or MDGL. But the company’s -$418.4M of operating cash flow and -$230.8M of free cash flow mean the clean balance sheet is a financing buffer, not a competitive advantage.
That is the key cross-check for me: low leverage helps, but it does not offset the burn. Until the pipeline converts, the cash balance is what matters most.
Conclusion
I would put my rating as a strong sell because the stock is still being carried by pipeline hope while the financials show a large and ongoing cash drain. The bull case is real: VK2735 has late-stage obesity data, management has secured manufacturing capacity, and the company still has $501.7M of cash with a 4.7x current ratio. The bear case is just as clear: operating cash outflow was $418.4M TTM, and that burn can force the market to focus on dilution and runway rather than on clinical upside.
I would raise my rating toward a buy if VK2735 subcutaneous stays on schedule through Phase 3 and the oral program advances to Phase 3 in Q3 2026 without a safety or efficacy setback. That would tell me the lead asset is moving from promise to a more visible commercial path, and it would make the reserved CordenPharma capacity look like a real launch advantage rather than a pre-commercial expense.
I would move from strong sell toward hold if the company can show that cash burn is moderating while the clinical timeline stays intact. If operating cash outflow remains near $418.4M a year, the cash cushion will keep shrinking, and the market will keep valuing the stock more as a financing story than as a drug-development asset.
Weighing both sides, I still think the downside case is more immediate because the burn is already visible while the commercial payoff is still ahead. The next few readouts matter, but until they arrive, I see more evidence of capital consumption than of durable value creation.
What to Watch Next
- Phase 3 VK2735 timing — on schedule would support a higher rating.
- Oral VK2735 Phase 3 initiation in Q3 2026 — would strengthen the launch case.
- Operating cash outflow near $418.4M — staying that high would keep financing risk elevated.
- Cash and investments near $501.7M — a faster drawdown would tighten runway.
- CordenPharma supply execution — any slip would weaken the manufacturing advantage.
What’s your take? I rated Viking Therapeutics (VKTX) STRONG SELL above — but the goal here is to get this right, not just to publish an opinion. What would you add to this analysis, or which risk or catalyst do you think I’m under- or over-weighting? Tell me in the comments.
Our track record: every directional call is tracked publicly on The Scorecard, and Stocks Covered lists every company we have rated and when.
Sources
- SEC 10-K Annual Report — filed 2026-02-11
- SEC 8-K Filing (2026-05-26)
- SEC 8-K Filing (2026-04-29)
- SEC 8-K Filing (2026-02-11)
- SEC Form 4 Insider Transaction (2026-06-03)
- SEC Form 4 Insider Transaction (2026-03-10)
- SEC Form 4 Insider Transaction (2026-01-26)
- SEC 10-K Annual Report — FY2026
- SEC 10-K Annual Report — FY2025
- SEC 10-K Annual Report — FY2024
- SEC 10-K Annual Report — FY2023
- SEC 10-K Annual Report — FY2022
Data sourced from Yahoo Finance and SEC EDGAR. Not investment advice.
Leave a Comment