| Company | Aug 25 | Sep 25 | Oct 25 | Nov 25 | Dec 25 | Jan 26 | Feb 26 | Mar 26 | Apr 26 | May 26 | Jun 26 | Jul 26 | 12-Mo |
|---|---|---|---|---|---|---|---|---|---|---|---|---|---|
| MLI | +12% | +6% | +5% | +4% | +5% | +19% | -13% | -6% | +22% | -5% | -4% | +8% | +57% |
| CNM | +2% | -17% | -3% | -7% | +8% | +3% | +1% | -9% | +2% | -2% | -2% | -9% | -31% |
| FERG | +4% | -2% | +11% | +1% | -12% | +14% | +3% | -10% | +15% | -15% | +5% | -1% | +7% |
| WTS | +6% | +1% | -2% | +1% | +0% | +8% | +10% | -12% | +3% | +3% | +27% | -12% | +33% |
| MWA | +7% | -3% | +1% | -5% | -2% | +14% | +11% | -8% | +1% | -9% | +2% | -2% | +3% |
| ZWS | +3% | +4% | +0% | +1% | -3% | -1% | +11% | -12% | +16% | -9% | +8% | -0% | +15% |
Source: Yahoo Finance monthly adjusted close.
Executive Summary
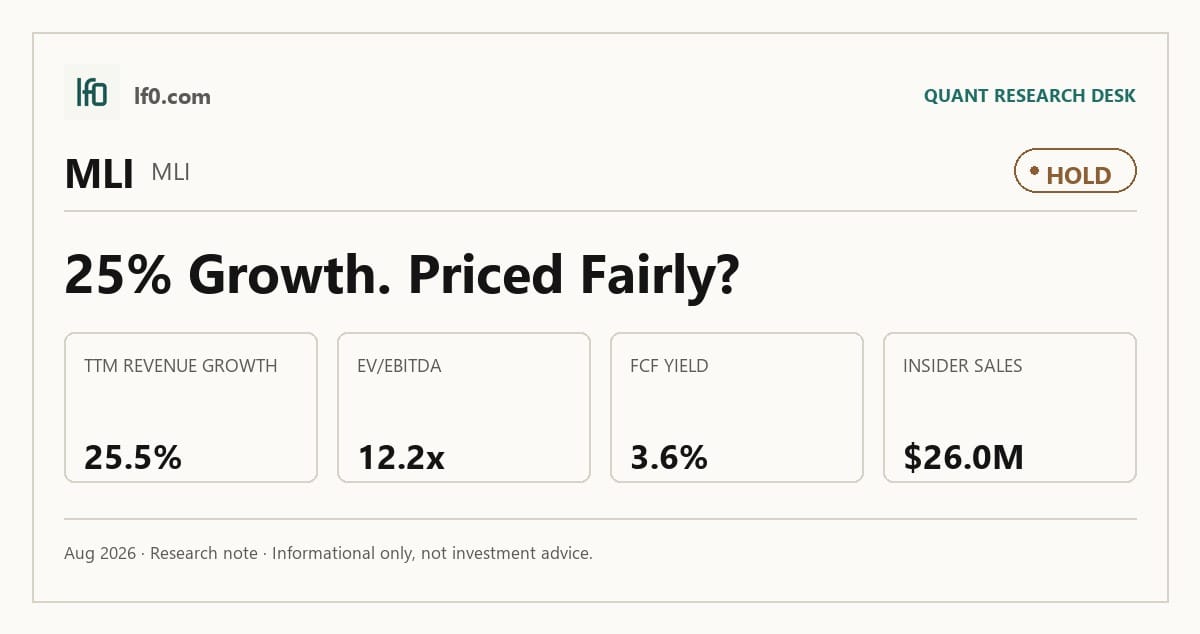
Rating: HOLD | MLI
Measured from adjusted close on 2026-08-03 to 2026-09-17. Sell ratings are correct when the stock falls; Hold is tracked as a +/-10% range. Daily-close data, not intraday. Calls are tracked for 182 days from publication, then frozen as a final record.
I would put my rating as a Hold because Mueller Industries has strong cash generation and a net cash balance sheet, but the stock already discounts much of that quality at 15.2x forward P/E and 12.2x EV/EBITDA. In my view, the key question is not whether the business is good — it is whether the current 3.6% FCF yield and 11.3% FCF margin are enough to justify paying up for a cyclical industrial name with only two analyst opinions behind the target range. I would raise my rating more towards a Buy if operating margin stays above 20.0%, meaning the company keeps converting volume into profit through a normal industrial cycle.
Company Profile
Mueller Industries makes copper tube, brass and aluminum products, HVACR components, and industrial metal and climate products for plumbing, refrigeration, and industrial applications. Founded in 1917, it operates through three segments: Piping Systems, Industrial Metals, and Climate. The company owns or leases manufacturing, distribution, and machining facilities across the United States, Mexico, Canada, the United Kingdom, South Korea, Bahrain, and China, including major sites in Fort Worth, Houston, Phoenix, and Fulton, Mississippi. It trades on the New York Stock Exchange under MLI. As of fiscal 2025, Mueller had 40 million shares authorized for repurchase through July 2026 and paid a quarterly cash dividend of $0.25 per share, up from $0.20 in fiscal 2024.
Economic Moat
Business Model
Mueller’s moat comes from its integrated manufacturing footprint across copper, brass, aluminum, and climate products. I feel that a new entrant would struggle to recreate that multi-plant, multi-country network within 3 years, especially in a business where supply reliability and product breadth matter to distributors and contractors. The three-segment structure also gives the company reach across plumbing, refrigeration, and industrial end markets, so it is not dependent on one product line or one geography.
That footprint is not just a business description; it helps explain why Mueller can hold 21.8% operating margin and 23.4% EBITDA margin in the TTM data. In my view, those margins are consistent with a scaled manufacturer that has enough breadth to absorb cyclical swings better than a single-product peer.
Business & Operating Risks
The biggest disclosed risk is input cost and energy volatility, because Mueller’s copper, brass, zinc, aluminum, electricity, natural gas, and fuel costs can move faster than selling prices. The risk factors in their SEC 10-K say failure to fully pass increases through to customers could hurt operating margins, and that is the right place to focus because the company’s margin structure depends on keeping that spread intact. Housing and commercial construction demand are the second major risk, since prolonged weak demand or excess supply would pressure both revenue and pricing.
Trade barriers are a third risk, and they matter because Mueller has cross-border exposure in North America and Asia. The filing’s tariff language points to a two-sided problem: tariffs can raise Mueller’s own costs, while retaliatory tariffs or weaker import demand can hurt volumes. I do not think these risks break the moat itself, but they do test the company’s ability to preserve the cost and supply advantages that the footprint is supposed to provide.
Management Discussion & Analysis
Management appears to be responding to those risks by keeping liquidity high and capital returns steady. The March 27, 2026 credit agreement replaced the prior revolver with a new unsecured 100M facility maturing in March 2031, which gives the company flexibility without changing the operating model. The dividend step-up to $0.35 per share in 2026 also tells me management is comfortable with cash generation even after the higher tariff and input-cost backdrop.
The March 2026 financing and the dividend increase are relevant together: one supports working capital and the other signals confidence in free cash flow. In my view, that is a constructive response to the disclosed risks, although it does not remove the underlying exposure to construction demand and commodity pricing.
Recent Events
The April 2026 earnings release was routine, but the June 1, 2026 two-for-one forward stock split is more telling. A split does not change intrinsic value, yet it usually signals confidence in liquidity and broader marketability, which modestly improves the stock’s trading profile. The two consecutive quarterly dividends of $0.35 per share, paid in March and June 2026, also show that management is still returning cash while funding the business.
The recent events do not change the moat thesis, but they do reinforce it: Mueller is using its cash generation to support liquidity, dividends, and shareholder access rather than stretching the balance sheet. That is consistent with a mature industrial platform that still has room to compound.
Financial Analysis
Growth
MLI — Financial Growth (Quarterly, USD Mil)
| Metric | 2025-06-30 | 2025-09-30 | 2025-12-31 | 2026-03-31 | 2026-06-30 |
|---|---|---|---|---|---|
| REVENUE (USD Mil) | 1,138.2 | 1,077.8 | 962.4 | 1,193 | 1,427.9 |
| EBIT (USD Mil) | 324.5 | 280.5 | 196.3 | 320.8 | 326.4 |
| EBITDA (USD Mil) | 342.4 | 297.1 | 213.2 | 337.5 | 343.7 |
| NET INCOME (USD Mil) | 245.9 | 208.1 | 153.7 | 239 | 249.7 |
| DILUTED EPS | 1.1 | 0.9 | 0.7 | 1.1 | 1.1 |
Source: Yahoo Finance — Quarterly Financial Statements
| Metric | 2025-06-30 | 2025-09-30 | 2025-12-31 | 2026-03-31 | 2026-06-30 |
|---|---|---|---|---|---|
| Revenue USD Mil | 1,138.2 | 1,077.8 | 962.4 | 1,193 | 1,427.9 |
| EBIT USD Mil | 324.5 | 280.5 | 196.3 | 320.8 | 326.4 |
| EBITDA USD Mil | 342.4 | 297.1 | 213.2 | 337.5 | 343.7 |
| Net Income USD Mil | 245.9 | 208.1 | 153.7 | 239 | 249.7 |
| Diluted EPS | 1.1 | 0.9 | 0.7 | 1.1 | 1.1 |
Revenue fell to $962.4M in 2025-12-31 before rebounding to $1.2B in 2026-03-31 and $1.4B in 2026-06-30, so the latest growth is a recovery from a trough rather than a straight-line acceleration. EBITDA moved in the same direction, from $213.2M to $343.7M, which tells me the business is regaining operating momentum as volumes recover. That pattern is consistent with a cyclical industrial name, not a structural demand break.
The key point is that growth is now strong enough to support the moat discussion above: the footprint is not just broad, it is still producing earnings growth. I would watch whether the next two quarters keep revenue above the current run rate, because that would show the rebound is durable rather than seasonal.
Profitability
MLI — Profitability (TTM)
| Metric | TTM |
|---|---|
| Operating Margin (TTM) | 21.8% |
| Net Margin (TTM) | 18.2% |
| Return on Assets (TTM) | 16.5% |
| Return on Equity (TTM) | 26.3% |
| Gross Margin (TTM) | 28.8% |
| EBITDA Margin (TTM) | 23.4% |
Source: Yahoo Finance — Trailing Twelve Months (TTM)
| Metric | TTM |
|---|---|
| Operating Margin TTM | 21.8% |
| Net Margin TTM | 18.2% |
| Return on Assets TTM | 16.5% |
| Return on Equity TTM | 26.3% |
| Gross Margin TTM | 28.8% |
| EBITDA Margin TTM | 23.4% |
Mueller’s TTM gross margin of 28.8% and EBITDA margin of 23.4% show that the core product layer is healthy, while the 5.6-point gap between them implies operating costs are meaningful but still well controlled. Operating margin of 21.8% and net margin of 18.2% stay close to EBITDA, which means the earnings bridge is clean and not being distorted by unusual below-the-line items.
ROA of 16.5% and ROE of 26.3% point to strong capital efficiency, and the spread between them suggests leverage is enhancing returns rather than driving them. That matters because the moat is not just about scale; it is also about turning that scale into real profit. If operating margin stays above 20.0% and net margin remains in the high teens, I would read that as confirmation that the business is still converting volume into cash-backed earnings.
Valuation
MLI — Valuation Multiples
| Metric | Value |
|---|---|
| Market Cap (USD Mil) | 14,723 |
| Enterprise Value (USD Mil) | 13,324 |
| Trailing P/E | 17.3 |
| Forward P/E | 15.2 |
| Price/Sales (TTM) | 3.2 |
| Price/Book (mrq) | 4.1 |
| EV/Revenue | 2.9 |
| EV/EBITDA | 12.2 |
| Beta (5Y Monthly) | 1.12 |
| FCF Yield % (TTM) | 3.6% |
| Forward EPS (USD) | 4.4 |
| Analyst Target Price – Low (USD) | 75 |
| Analyst Target Price – Mean (USD) | 77.5 |
| Analyst Target Price – High (USD) | 80 |
| # Analyst Opinions | 2 |
Source: Yahoo Finance
| Metric | Value |
|---|---|
| Market Cap USD Mil | 14,723 |
| Enterprise Value USD Mil | 13,324 |
| Trailing P/E | 17.3 |
| Forward P/E | 15.2 |
| Price/Sales TTM | 3.2 |
| Price/Book mrq | 4.1 |
| EV/Revenue | 2.9 |
| EV/EBITDA | 12.2 |
| Beta 5Y Monthly | 1.12 |
| FCF Yield % TTM | 3.6% |
| Forward EPS USD | 4.4 |
| Analyst Target Price Low USD | 75 |
| Analyst Target Price Mean USD | 77.5 |
| Analyst Target Price High USD | 80 |
| Analyst Opinions | 2 |
MLI screens as a quality industrial, not a bargain. EV/Revenue of 2.9x and EV/EBITDA of 12.2x say the market is paying for a business that can hold margins through a normal cycle, while Forward P/E of 15.2x and FCF yield of 3.6% leave only moderate upside if execution merely stays steady. The current valuation is also supported by the balance sheet, because enterprise value is only 13.3B against a 14.7B market cap and very small debt.
On my read, fair value sits around $70-$80 per share. That range sits inside the 75–80 analyst target band, but the coverage base is thin at only 2 opinions, so I would not treat the consensus as especially broad. The implied forward EPS of 4.38 also looks reasonable versus peers: it is below FERG’s $12.6 and WTS’s $13.2, but those names trade on much larger earnings bases and richer multiples, so MLI’s multiple is not demanding on a like-for-like basis. I would keep the stock at Hold because the valuation already reflects the company’s margin quality and net cash position.
Leverage
MLI — Leverage & Coverage (Quarterly)
| Metric | Value |
|---|---|
| Total Debt/Equity % (mrq) | 0.7 |
| Current Ratio (mrq) | 4.8 |
| Total Debt (mrq, USD Mil) | 24.7 |
| Operating Cash Flow (TTM, USD Mil) | 743.3 |
| Levered Free Cash Flow (TTM, USD Mil) | 524.9 |
| Net Debt/EBITDA (TTM) | -1.3 |
| FCF Margin % (TTM) | 11.3% |
Source: Yahoo Finance — Quarterly Financial Statements
| Metric | mrq / TTM |
|---|---|
| Total Debt/Equity % mrq | 0.7 |
| Current Ratio mrq | 4.8 |
| Total Debt USD Mil mrq | 24.7 |
| Operating Cash Flow USD Mil TTM | 743.3 |
| Levered Free Cash Flow USD Mil TTM | 524.9 |
| Net Debt/EBITDA TTM | -1.3 |
| FCF Margin % TTM | 11.3% |
Mueller’s balance sheet is the cleanest part of the story. Total debt is only 24.7M, current ratio is 4.8x, and net debt/EBITDA is -1.3x, which means cash exceeds debt by a wide margin. Operating cash flow of 743.3M and levered free cash flow of 524.9M show that earnings are converting into cash, not just accounting profit.
That matters for the thesis because the company can keep paying dividends and buying back stock without leaning on leverage. In my view, the balance sheet is a support, not a constraint, and it gives management room to absorb a softer industrial backdrop before the equity case breaks.
Insider Activity
The insider transaction record is one-sided: 14 open-market sales, $26M in total value, and no open-market purchases in the 2025-02-06 to 2026-05-29 window. The selling is concentrated, which weakens the alignment signal, especially when insider ownership is only 2.1%. I would not overread one quarter of selling on its own, but I do think it argues against paying a full premium for the shares.
Comparable Analysis
Growth
| Company | Revenue TTM (USD Mil) | Revenue Growth YoY % | EBITDA TTM (USD Mil) | Diluted EPS TTM |
|---|---|---|---|---|
| MLI | 4,661.1 | 25.5% | 1,089.4 | 3.8 |
| CNM | 7,646 | -0.1% | 919 | 2.4 |
| FERG | 31,058.2 | 3.6% | 3,042.6 | 10.2 |
| WTS | 2,557.8 | 21.4% | 558.5 | 10.9 |
| MWA | 1,463.7 | 5.5% | 339.7 | 1.3 |
| ZWS | 1,786.6 | 10.5% | 466.3 | 1.6 |
Source: Yahoo Finance
MLI’s revenue growth of 25.5% TTM is well ahead of CNM at -0.1%, FERG at 3.6%, WTS at 21.4%, MWA at 5.5%, and ZWS at 10.5%. That is a real growth advantage, not just a small difference, and it is especially notable because MLI is doing it off a $4.7B revenue base rather than a much smaller starting point. WTS is the closest peer on growth, but MLI still leads by 4.1 percentage points.
Valuation
| Company | Trailing P/E | Forward P/E | EV/Revenue | EV/EBITDA | Price/Sales (TTM) | Price/Book (mrq) | Market Cap (USD Mil) | Enterprise Value (USD Mil) | Beta (5Y Monthly) | FCF Yield % (TTM) | Forward EPS | Analyst Target Price – Low | Analyst Target Price – Mean | Analyst Target Price – High | # Analyst Opinions |
|---|---|---|---|---|---|---|---|---|---|---|---|---|---|---|---|
| MLI | 17.3 | 15.2 | 2.9 | 12.2 | 3.2 | 4.1 | 14,723 | 13,324 | 1.12 | 3.6% | 4.4 | 75 | 77.5 | 80 | 2 |
| CNM | 19.5 | 14.5 | 1.4 | 11.5 | 1.2 | 4.2 | 8,899 | 10,601 | 0.92 | 4.9% | 3.2 | 40 | 60.3 | 75 | 15 |
| FERG | 24.8 | 20.1 | 1.6 | 16.7 | 1.6 | 8.3 | 48,898 | 50,706 | 1.12 | — | 12.6 | 225 | 279.4 | 310 | 19 |
| WTS | 32 | 26.5 | 4.5 | 20.5 | 4.6 | 5.6 | 11,675 | 11,477 | 1.13 | 1.6% | 13.2 | 320 | 358.3 | 414 | 9 |
| MWA | 19.5 | 16.4 | 2.7 | 11.7 | 2.8 | 3.8 | 4,031 | 3,981 | 1.01 | 2.5% | 1.6 | 25 | 31 | 35 | 6 |
| ZWS | 31.7 | 25 | 4.8 | 18.4 | 4.7 | 5.1 | 8,471 | 8,563 | 0.78 | 3.8% | 2 | 52 | 58.1 | 65 | 10 |
Source: Yahoo Finance
MLI trades at 15.2x forward P/E, 2.9x EV/Revenue, and 3.6% FCF yield, versus CNM at 14.5x, 1.4x, and 4.9%; WTS at 26.5x, 4.5x, and 1.6%; MWA at 16.4x, 2.7x, and 2.5%; and ZWS at 25.0x, 4.8x, and 3.8%. I think the market is paying a fair price for MLI’s growth and balance-sheet strength, but not a cheap one. The stock also looks better on a growth-adjusted basis than WTS or ZWS, because MLI’s faster growth comes at a lower revenue multiple than those peers.
Profitability
| Company | Operating Margin (TTM) | Net Margin (TTM) | Return on Assets (TTM) | Return on Equity (TTM) | Gross Margin (TTM) | EBITDA Margin (TTM) |
|---|---|---|---|---|---|---|
| MLI | 21.8% | 18.2% | 16.5% | 26.3% | 28.8% | 23.4% |
| CNM | 9.3% | 5.9% | 7.2% | 23.9% | 27.1% | 12.0% |
| FERG | 8.1% | 6.3% | — | — | 30.7% | 9.8% |
| WTS | 19.7% | 14.3% | 11.5% | 18.9% | 49.2% | 21.8% |
| MWA | 22.1% | 14.2% | 10.3% | 21.3% | 37.6% | 23.2% |
| ZWS | 31.4% | 15.5% | 8.7% | 16.9% | 49.0% | 26.1% |
Source: Yahoo Finance
MLI’s 21.8% operating margin, 18.2% net margin, 28.8% gross margin, and 23.4% EBITDA margin compare favorably with CNM’s 9.3%, 5.9%, 27.1%, and 12.0%, and with FERG’s 8.1%, 6.3%, 30.7%, and 9.8%. The cleaner read is that MLI’s edge is mostly operating leverage, not gross margin, because its gross margin is only modestly above CNM and below FERG while its operating and EBITDA margins are much stronger. That tells me the company is running a tighter expense structure than most of the peer set.
Leverage
| Company | Total Debt/Equity % (mrq) | Current Ratio (mrq) | Total Debt (mrq, USD Mil) | Operating Cash Flow TTM (USD Mil) | Free Cash Flow TTM (USD Mil) | Net Debt/EBITDA (TTM) | FCF Margin % (TTM) |
|---|---|---|---|---|---|---|---|
| MLI | 0.7 | 4.8 | 24.7 | 743.3 | 524.9 | -1.3 | 11.3% |
| CNM | 115.9 | 2.3 | 2,451 | 655 | 437.9 | 2.5 | 5.7% |
| FERG | 103.5 | 1.8 | 6,081 | 1,959.6 | — | 1.7 | — |
| WTS | 14.5 | 2.7 | 305 | 364.7 | 184.4 | -0.1 | 7.2% |
| MWA | 42.2 | 4.6 | 452.4 | 199.3 | 99.4 | 0.1 | 6.8% |
| ZWS | 33.2 | 3.1 | 550.5 | 401.4 | 322.7 | 0.4 | 18.1% |
Source: Yahoo Finance
MLI’s 0.7% debt/equity, -1.3x net debt/EBITDA, and 11.3% FCF margin are materially stronger than CNM’s 115.9%, 2.5x, and 5.7%, and also better than FERG’s 103.5%, 1.7x, and no disclosed FCF margin. WTS and MWA are also conservatively financed, at 14.5% and 42.2% debt/equity with -0.1x and 0.1x net debt/EBITDA, but MLI’s net cash position gives it the cleanest balance sheet in the set. That balance-sheet edge helps explain why MLI can trade at a higher multiple than CNM without looking obviously stretched.
Conclusion
I would put my rating as a Hold because Mueller’s strongest numbers are already visible in the stock: 25.5% TTM revenue growth, 23.4% EBITDA margin, and a net cash balance sheet. The question now is whether those strengths can persist without a further rerating, and I do not think the current setup gives enough margin of safety to call it a Buy. The valuation is fair, but not cheap enough to ignore the cycle.
I would move more towards a Buy if revenue stays above the current $4.7B annual run rate and operating margin remains above 20.0%, meaning the company keeps turning growth into profit through a normal industrial backdrop. That would tell me the rebound is not just a short-term bounce and that the cash generation can keep supporting dividends and repurchases. I would move from Hold to Sell if revenue growth falls back into the low single digits for two straight quarters or if EBITDA margin drops below 20.0%, because that would show the current multiple is being paid for peak earnings rather than durable earnings power.
The balance sheet is the main reason I am not more negative. With only 24.7M of debt and 524.9M of levered free cash flow, Mueller has room to absorb a softer environment before the thesis breaks. For now, I think the stock is fairly valued for a high-quality industrial franchise, and I would want either a cheaper entry point or another quarter of sustained margin strength before becoming more constructive.
What’s your take? I rated Mueller Industries (MLI) HOLD above — but the goal here is to get this right, not just to publish an opinion. What would you add to this analysis, or which risk or catalyst do you think I’m under- or over-weighting? Tell me in the comments.
Sources
- SEC 10-K Annual Report — filed 2026-02-25
- SEC 8-K Filing (2026-06-02)
- SEC 8-K Filing (2026-05-11)
- SEC 8-K Filing (2026-04-21)
- SEC 8-K Filing (2026-03-30)
- SEC 8-K Filing (2026-02-20)
- SEC 8-K Filing (2026-02-03)
- SEC Form 4 Insider Transaction (2026-05-29)
- SEC Form 4 Insider Transaction (2026-05-11)
- SEC Form 4 Insider Transaction (2026-05-11)
- SEC 10-K Annual Report — FY2026
- SEC 10-K Annual Report — FY2025
- SEC 10-K Annual Report — FY2024
- SEC 10-K Annual Report — FY2023
- SEC 10-K Annual Report — FY2022
Data sourced from Yahoo Finance and SEC EDGAR. Not investment advice.
Leave a Comment