
Expected price range
Each range is a ~68% statistical band built from the stock’s own 1-year realised volatility (34% annualised), centred on a path that closes a quarter of the gap to our fair-value midpoint by 3 months and half by 6 months. Starting price $50.38 (close 2026-10-20). This is an illustration of where our view and normal volatility point, not a forecast, price target or investment advice; the stock can move outside it.
| Company | Oct 25 | Nov 25 | Dec 25 | Jan 26 | Feb 26 | Mar 26 | Apr 26 | May 26 | Jun 26 | Jul 26 | Aug 26 | Sep 26 | 12-Mo |
|---|---|---|---|---|---|---|---|---|---|---|---|---|---|
| DVN | -7% | +14% | -1% | +10% | +8% | +16% | +2% | -13% | -6% | +9% | +7% | -4% | +35% |
| PR | -2% | +15% | -2% | +15% | +13% | +18% | +1% | -11% | -3% | +16% | +9% | -9% | +71% |
| EOG | -5% | +2% | -3% | +8% | +11% | +17% | -2% | -5% | -3% | +15% | -3% | -5% | +27% |
| EQT | -2% | +14% | -12% | +8% | +7% | +4% | -6% | -8% | -3% | +0% | +2% | -10% | -10% |
Source: Yahoo Finance monthly adjusted close.
Quick Thesis
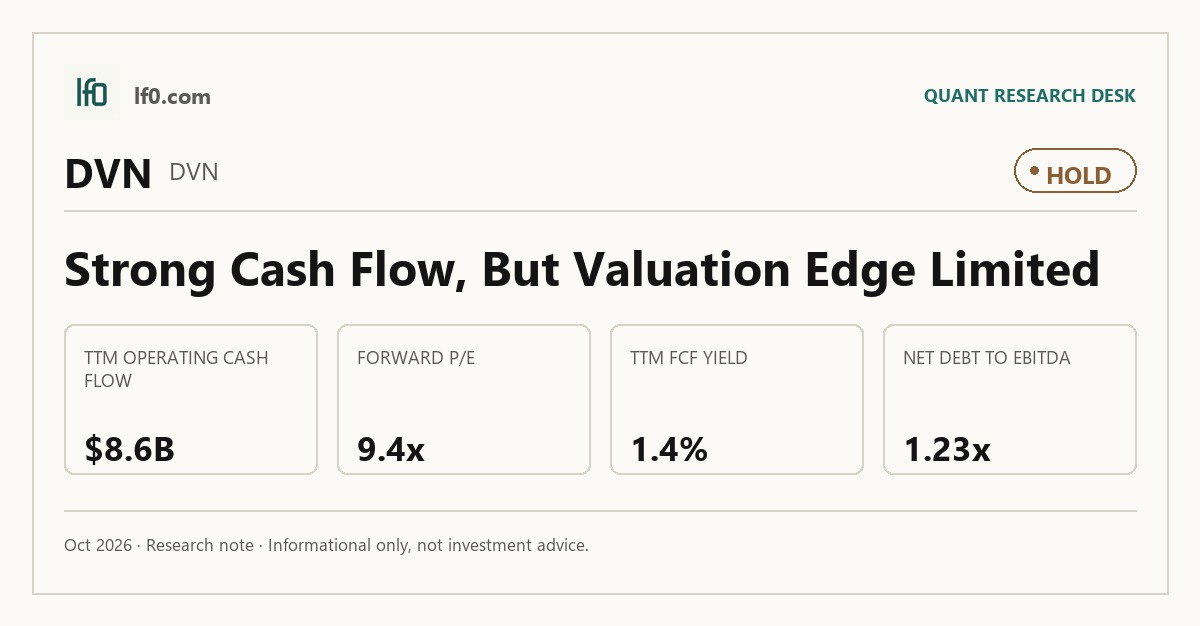
- Rated Hold — solid cash generation, but the stock already prices it in.
- Strongest support: $8.6B of operating cash flow and $782.6M of levered free cash flow.
- Main risk: 1.23x net debt/EBITDA and a 0.7 current ratio.
- Valuation is fair, not cheap: 7.4x EV/EBITDA and 1.4% FCF yield.
- I would turn more constructive if free cash flow margin moves above 5.0%.
Executive Summary
Rating: HOLD | DVN
We’ll begin tracking this call’s performance since publication once sufficient adjusted-close data is available.
I would put my rating as a Hold because Devon’s cash generation is solid, but the shares already discount much of that quality at 7.4x EV/EBITDA and only a 1.4% free cash flow yield. The balance sheet is manageable at 1.23x net debt/EBITDA, yet the 0.7 current ratio and the suspension of buybacks under the Coterra merger mean the next leg of value creation depends on execution, not capital return. I would raise my rating more towards a Buy if the combined Devon and Coterra platform delivers the promised $1B of annual synergies and the remaining $150M of Devon’s $1B optimization plan shows up in margins rather than just in guidance.
Company Profile
Devon Energy is an upstream oil and gas producer with a concentrated position in the Delaware Basin and other U.S. shale assets. Its earnings are driven by commodity prices, production volumes, and operating efficiency, so cash flow can move sharply with realized pricing even when the asset base is stable. The company’s current strategy centers on disciplined capital spending, free cash flow generation, and a larger operating footprint after the Coterra transaction.
Economic Moat
Business Model
Devon’s edge comes from scale in core shale basins, especially the Delaware Basin, where inventory depth and infrastructure access support repeat drilling and lower unit costs. The business also benefits from a capital-light operating model relative to many industrial companies: once acreage is assembled, management can flex spending up or down quickly as prices change. That flexibility matters because it lets Devon protect cash flow in weak commodity periods without abandoning its best acreage.
Business & Operating Risks
The main disclosed risks are commodity-price volatility, reserve replacement, and execution risk around large capital programs and acquisitions. Those risks do not destroy the moat, but they do test it because Devon’s basin scale only matters if management can keep converting acreage into profitable barrels at acceptable costs. The Coterra merger and the Delaware Basin acquisition strengthen the scale thesis, but they also make execution discipline more important, not less.
Management Discussion & Analysis
Management is responding to those risks by keeping capital spending tight, targeting roughly 4% lower 2026 capex than 2025, and pushing a $1B annual pre-tax free cash flow improvement plan. The company says about $850M of that improvement had already been achieved by 2025, which tells me the cost program is real, but the final stretch still needs to show up in margins rather than in presentation. The buyback suspension under the merger agreement is the clearest sign that management is prioritizing balance-sheet and transaction discipline over near-term capital returns.
Recent Events
The most important recent development is the May 7, 2026 closing of Devon’s merger with Coterra, followed by a May 22, 2026 pro forma filing that shows the combined company is already being reflected in reporting. That is strategically positive because it expands scale and should deepen inventory, but it also shifts the burden onto integration and synergy delivery. The May 20, 2026 purchase of 16,300 net undeveloped Delaware Basin acres for about $2.6B reinforces the same point: Devon is leaning into core-basin concentration, which should help the moat if returns clear the acquisition cost.
Financial Analysis
Growth
DVN — Financial Growth (Quarterly, USD Mil)
| Metric | 2025-06-30 | 2025-09-30 | 2025-12-31 | 2026-03-31 | 2026-06-30 |
|---|---|---|---|---|---|
| REVENUE (USD Mil) | 4,284 | 4,331 | 4,121 | 3,807 | 7,417 |
| EBIT (USD Mil) | 1,287 | 1,037 | 866 | 284 | 2,528 |
| EBITDA (USD Mil) | 2,201 | 1,916 | 1,756 | 1,188 | 3,944 |
| NET INCOME (USD Mil) | 899 | 687 | 562 | 120 | 1,911 |
| DILUTED EPS | 1.4 | 1.1 | 0.9 | 0.2 | 2 |
Source: Yahoo Finance — Quarterly Financial Statements
Revenue rose from $3.8B in Q1 2026 to $7.4B in Q2 2026, while EBITDA jumped to $3.9B from $1.2B. That rebound is strong enough to support the thesis, but the quarter-to-quarter swing is too large to read as a straight-line trend; I would want to see whether the higher run rate holds before calling it durable growth. Net income also moved sharply higher to $1.9B from $120M, which shows how quickly Devon’s earnings can reset when pricing and volumes improve.
Profitability
DVN — Profitability (TTM)
| Metric | TTM |
|---|---|
| Operating Margin (TTM) | 41.1% |
| Net Margin (TTM) | 17.5% |
| Return on Assets (TTM) | 5.9% |
| Return on Equity (TTM) | 11.5% |
| Gross Margin (TTM) | 50.3% |
| EBITDA Margin (TTM) | 47.5% |
Source: Yahoo Finance — Trailing Twelve Months (TTM)
TTM operating margin of 41.1% and EBITDA margin of 47.5% show Devon is converting a large share of revenue into operating profit, which is the right sign for an upstream producer. Gross margin of 50.3% leaves room for field and overhead costs, but the bigger point is that the business is still producing a healthy spread before depreciation and financing. Net margin of 17.5% and return on equity of 11.5% confirm that the model is profitable on a trailing basis, even if the earnings base remains cyclical.
Valuation
DVN — Valuation Multiples
| Metric | Value |
|---|---|
| Current Share Price (USD) | 50.4 |
| Market Cap (USD Mil) | 55,418 |
| Enterprise Value (USD Mil) | 66,361 |
| Trailing P/E | 11 |
| Forward P/E | 9.4 |
| Price/Sales (TTM) | 3 |
| Price/Book (mrq) | 1.4 |
| EV/Revenue | 3.5 |
| EV/EBITDA | 7.4 |
| Beta (5Y Monthly) | 0.54 |
| FCF Yield % (TTM) | 1.4% |
| Forward EPS (USD) | 5.4 |
| Analyst Target Price – Low (USD) | 44 |
| Analyst Target Price – Mean (USD) | 61.6 |
| Analyst Target Price – High (USD) | 74 |
| # Analyst Opinions | 27 |
Source: Yahoo Finance
Devon trades at 11.0x trailing P/E, 9.4x forward P/E, 3.5x EV/revenue, and 7.4x EV/EBITDA, with a 1.4% FCF yield. In my view, that is fair rather than cheap: the market is paying for a business that can keep generating cash through the cycle, but not for a large margin of safety. With 27 analyst opinions, the target range of $44 to $74 and mean of $61.6 sits above the current $50.4 share price, so my own view is that fair value is roughly $48-$63. That range sits inside consensus, which tells me the Street is not far from my read, but I weight the thin 1.4% FCF yield more heavily than the target-price mean. On earnings, I would frame fair value around $5.2-$5.8 of forward EPS, which is close to the table’s $5.39 estimate and implies the stock is not expensive on a pure earnings basis, but it is not obviously cheap once leverage and cash conversion are included.
Leverage
DVN — Leverage & Coverage (Quarterly)
| Metric | Value |
|---|---|
| Total Debt/Equity % (mrq) | 28.5 |
| Current Ratio (mrq) | 0.7 |
| Total Debt (mrq, USD Mil) | 11,893 |
| Operating Cash Flow (TTM, USD Mil) | 8,553 |
| Levered Free Cash Flow (TTM, USD Mil) | 782.6 |
| Net Debt/EBITDA (TTM) | 1.2 |
| FCF Margin % (TTM) | 4.2% |
Source: Yahoo Finance — Quarterly Financial Statements
Debt is manageable, not trivial. Total debt is $11.9B, net debt/EBITDA is 1.23x, and total debt/equity is 28.5%, so the balance sheet is not stretched, but it is not a source of major upside either. The 0.7 current ratio means near-term liabilities exceed current assets, which leaves Devon dependent on continued operating cash flow rather than on liquidity slack. That is why the $8.6B of operating cash flow and $782.6M of levered free cash flow matter so much: the equity case depends on cash generation staying strong enough to absorb the debt load and fund the dividend.
Insider Activity
The insider record shows two open-market sales and no open-market purchases in the period shown. The activity is limited, so I would not overread it, but the absence of buying does not help sentiment. On balance, it is a mild negative rather than a thesis driver.
Comparable Analysis
LF0 has published standalone analyses of these peers: EQT (EQT) (rated Hold).
Growth
| Company | Revenue TTM (USD Mil) | Revenue Growth YoY % | EBITDA TTM (USD Mil) | Diluted EPS TTM |
|---|---|---|---|---|
| DVN | 18,781 | 64.2% | 8,924 | 4.6 |
| PR | 5,737.4 | 55.1% | 4,255.1 | 1.5 |
| EOG | 26,721 | 58.7% | 14,495 | 12.8 |
| EQT | 9,293.9 | -3.9% | 6,995.4 | 4.3 |
Source: Yahoo Finance
Devon’s revenue growth of $64.2% TTM is ahead of PR’s $55.1% and EOG’s $58.7%, while EQT is negative at -3.9%. That puts Devon in the stronger half of the group, but not so far ahead that it deserves a large growth premium. The point is that Devon is growing faster than the weakest peer, yet the gap versus the better operators is not wide enough to justify a much richer multiple on growth alone.
Valuation
| Company | Current Share Price (USD) | Trailing P/E | Forward P/E | EV/Revenue | EV/EBITDA | Price/Sales (TTM) | Price/Book (mrq) | Market Cap (USD Mil) | Enterprise Value (USD Mil) | Beta (5Y Monthly) | FCF Yield % (TTM) | Forward EPS | Analyst Target Price – Low | Analyst Target Price – Mean | Analyst Target Price – High | # Analyst Opinions |
|---|---|---|---|---|---|---|---|---|---|---|---|---|---|---|---|---|
| DVN | 50.4 | 11 | 9.4 | 3.5 | 7.4 | 3 | 1.4 | 55,418 | 66,361 | 0.54 | 1.4% | 5.4 | 44 | 61.6 | 74 | 27 |
| PR | 24.8 | 16.3 | 10.3 | 4.2 | 5.6 | 3.6 | 1.7 | 20,805 | 23,824 | 0.65 | 2.2% | 2.4 | 25 | 28.6 | 34 | 22 |
| EOG | 157.9 | 12.3 | 9.8 | 3.2 | 5.9 | 3.1 | 2.6 | 84,107 | 86,171 | 0.37 | 5.3% | 16.1 | 141 | 166.4 | 213 | 29 |
| EQT | 54.8 | 12.7 | 15.1 | 4.7 | 6.2 | 3.7 | 1.4 | 34,291 | 43,438 | 0.65 | 7.2% | 3.6 | 52 | 66.4 | 81 | 27 |
Source: Yahoo Finance
On valuation, Devon’s 7.4x EV/EBITDA is above PR’s 5.6x and EOG’s 5.9x, while its 1.4% FCF yield trails PR’s 2.2% and EOG’s 5.3%. That combination matters because Devon’s growth is better than EQT’s, but its cash yield is weaker than the stronger peers, so the market is not giving it a clear growth-adjusted discount. Using peer EV/revenue and the company’s own leverage profile, the implied equity range is roughly $44-$69 per share, which brackets the current price and supports a fair-value view rather than a deep-value one.
Profitability
| Company | Operating Margin (TTM) | Net Margin (TTM) | Return on Assets (TTM) | Return on Equity (TTM) | Gross Margin (TTM) | EBITDA Margin (TTM) |
|---|---|---|---|---|---|---|
| DVN | 41.1% | 17.5% | 5.9% | 11.5% | 50.3% | 47.5% |
| PR | 57.4% | 21.5% | 7.5% | 11.4% | 75.8% | 74.2% |
| EOG | 40.7% | 25.7% | 11.0% | 22.5% | 62.6% | 54.2% |
| EQT | 23.4% | 29.2% | 6.6% | 11.1% | 80.8% | 75.3% |
Source: Yahoo Finance
Devon’s 41.1% operating margin is close to EOG’s 40.7% and below PR’s 57.4%, while its 17.5% net margin trails both PR and EOG. Gross margin of 50.3% and EBITDA margin of 47.5% are also below the best peers, which tells me Devon is not the most efficient operator in the group even though it remains solidly profitable. ROE of 11.5% and ROA of 5.91% are respectable, but they sit in the middle of the pack rather than at the top.
Leverage
| Company | Total Debt/Equity % (mrq) | Current Ratio (mrq) | Total Debt (mrq, USD Mil) | Operating Cash Flow TTM (USD Mil) | Free Cash Flow TTM (USD Mil) | Net Debt/EBITDA (TTM) | FCF Margin % (TTM) |
|---|---|---|---|---|---|---|---|
| DVN | 28.5 | 0.7 | 11,893 | 8,553 | 782.6 | 1.2 | 4.2% |
| PR | 26.2 | 0.6 | 3,150.9 | 3,991.6 | 458.4 | 0.7 | 8.0% |
| EOG | 25.9 | 1.9 | 8,250 | 13,358 | 4,478.8 | 0.2 | 16.8% |
| EQT | 19.6 | 0.7 | 5,655.7 | 6,246.1 | 2,460.9 | 0.8 | 26.5% |
Source: Yahoo Finance
Devon’s 1.23x net debt/EBITDA is higher than EOG’s 0.2x and PR’s 0.7x, while its 0.7 current ratio is weaker than EOG’s 1.9x. That is the key reason I do not assign a premium valuation for balance-sheet strength. The leverage profile is still workable, but it leaves less room for error than the best-capitalized peers, so the stock has to earn its multiple through cash flow rather than through financial conservatism.
Conclusion
I would put my rating as a Hold because the core tension is between strong cash generation and a valuation that already reflects it. Devon is producing $8.6B of operating cash flow and $782.6M of levered free cash flow, but the stock still trades at 7.4x EV/EBITDA and only a 1.4% FCF yield, so the market is not leaving much room for disappointment. The merger with Coterra and the Delaware Basin acquisition improve scale, yet they also make execution the central issue rather than a side note.
I would raise my rating more towards a Buy if the combined company delivers the promised $1B of annual synergies and Devon’s remaining $150M of optimization savings shows up in operating margin rather than in guidance alone. On the current revenue base, even a 1.0 percentage point margin lift would add roughly $188M of annual operating profit, which would help justify a higher multiple and show that the merger is creating real operating leverage. If free cash flow margin also moves above 5.0%, meaning cash conversion is clearly improving, I would become more constructive.
I would move from Hold to Sell if integration slips and net debt/EBITDA drifts toward 1.5x while the current ratio stays below 1.0. A move in operating margin from 41.1% into the high 30s would remove hundreds of millions of dollars of annual operating profit and quickly narrow the cushion behind the dividend and the balance sheet. That would tell me the market is paying for a cash engine that is no longer compounding at the pace implied by the current valuation.
For now, I lean to Hold because the bull case needs the merger and synergy plan to work cleanly, while the bear case only needs a modest miss in execution to pressure cash flow and sentiment. The stock is not expensive enough to sell outright, but it is also not cheap enough to ignore the integration risk now sitting at the center of the thesis.
What to Watch Next
- Combined-company synergy delivery — $1B annual target would support a higher rating.
- Remaining optimization savings — the last $150M needs to show up in margins.
- Free cash flow margin above 5.0% — would signal better cash conversion.
- Net debt/EBITDA near 1.5x — would signal rising balance-sheet pressure.
- Current ratio staying below 1.0 — would keep liquidity dependent on cash flow.
What’s your take? I rated Devon Energy (DVN) HOLD above — but the goal here is to get this right, not just to publish an opinion. What would you add to this analysis, or which risk or catalyst do you think I’m under- or over-weighting? Tell me in the comments.
Sources
- SEC 10-K Annual Report — filed 2026-02-18
- SEC 8-K Filing (2026-06-05)
- SEC 8-K Filing (2026-05-22)
- SEC 8-K Filing (2026-05-21)
- SEC 8-K Filing (2026-05-07)
- SEC 8-K Filing (2026-05-05)
- SEC 8-K Filing (2026-05-05)
- SEC Form 4 Insider Transaction (2026-05-19)
- SEC Form 4 Insider Transaction (2026-05-15)
- SEC Form 4 Insider Transaction (2026-05-15)
- SEC 10-K Annual Report — FY2026
- SEC 10-K Annual Report — FY2025
- SEC 10-K Annual Report — FY2024
Data sourced from Yahoo Finance and SEC EDGAR. Not investment advice.
Leave a Comment