| Company | Oct 25 | Nov 25 | Dec 25 | Jan 26 | Feb 26 | Mar 26 | Apr 26 | May 26 | Jun 26 | Jul 26 | Aug 26 | Sep 26 | 12-Mo |
|---|---|---|---|---|---|---|---|---|---|---|---|---|---|
| SMTC | -5% | +9% | -1% | +8% | +13% | -15% | +37% | +45% | +6% | -27% | +13% | +34% | +150% |
| CRDO | +29% | -5% | -19% | -13% | -10% | -16% | +85% | +36% | +15% | -24% | +9% | -14% | +34% |
| AMAT | +14% | +8% | +2% | +25% | +16% | -8% | +15% | +14% | +61% | -30% | -10% | +12% | +151% |
| MRVL | +12% | -5% | -5% | -7% | +4% | +21% | +67% | +24% | +45% | -37% | +13% | +25% | +215% |
| MCHP | -3% | -13% | +19% | +19% | -1% | -13% | +44% | +2% | -4% | -19% | -1% | +6% | +24% |
| SWKS | +1% | -14% | -4% | -12% | +8% | -10% | +31% | +12% | -13% | -8% | +8% | +28% | +15% |
Source: Yahoo Finance monthly adjusted close.
Quick Thesis
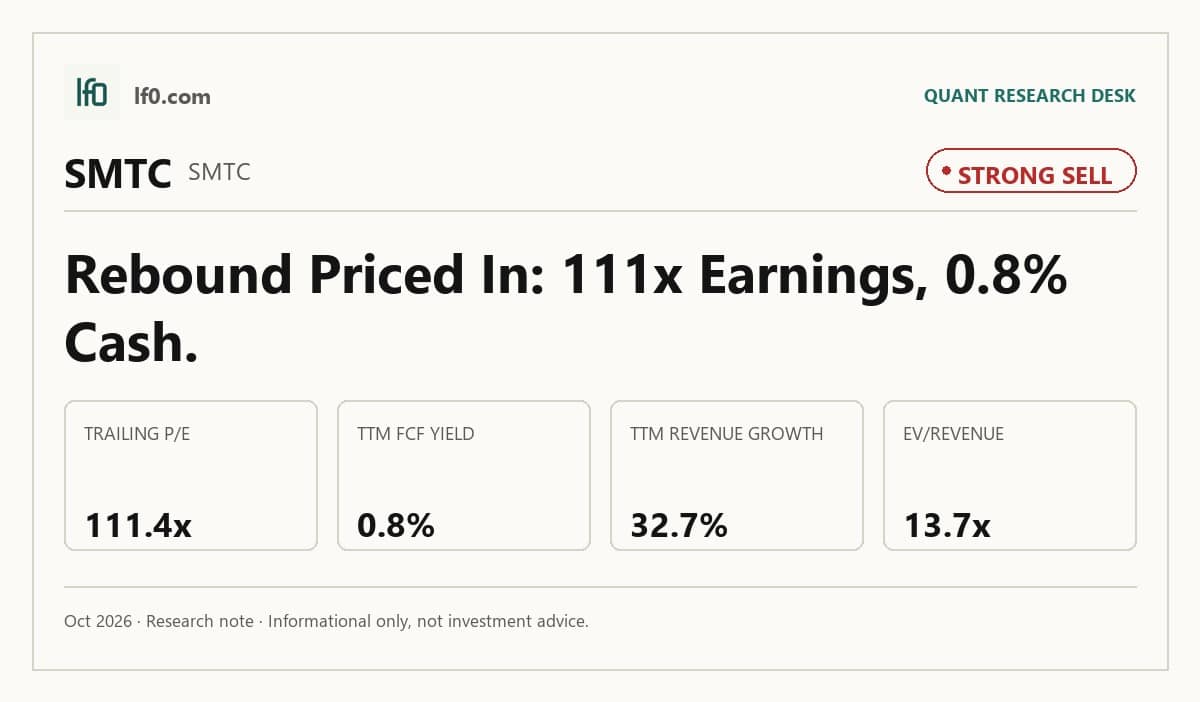
- Rated strong sell — valuation already discounts a recovery that is not yet durable.
- Strongest support: $132.7M of levered free cash flow TTM.
- Biggest risk: 70.1% debt/equity and 47% China revenue concentration.
- Valuation is rich at 111.4x trailing P/E and 13.7x EV/revenue.
- I would improve my view only if operating margin stays above 16.0% and FCF yield rises materially above 0.8%.
Executive Summary
Rating: STRONG SELL | SMTC
Measured from adjusted close on 2026-10-13 to 2026-10-13. Sell ratings are correct when the stock falls; Hold is tracked as a +/-10% range. Daily-close data, not intraday. Calls are tracked for 182 days from publication, then frozen as a final record.
I would put my rating as a strong sell because Semtech’s share price already assumes a sustained earnings recovery, yet the current cash conversion and concentration risk do not give me enough margin of safety. The stock trades at 111.4x trailing P/E, 28.7x forward P/E, and 13.7x EV/revenue, while TTM FCF yield is only 0.8%, so the market is paying a premium for a rebound that still needs to prove itself in cash.
The strongest part of the thesis is that the business is now generating $132.7M of levered free cash flow TTM and $214M of operating cash flow TTM, which tells me the model is not broken. The problem is that 70.1% debt/equity and 47% of fiscal 2026 net sales from China leave the equity exposed if demand softens or if the current margin run rate slips.
I would turn more constructive only if operating margin holds above 16.0% — meaning the business keeps converting sales into operating profit at roughly the current pace — and FCF yield moves materially above 0.8%, which would show that the recovery is turning into real cash rather than just a higher multiple.
Company Profile
Semtech designs and sells high-performance analog and mixed-signal semiconductors, plus IoT modules, routers, gateways, and connected services, to OEMs and solution providers. Revenue is split across Signal Integrity, Analog Mixed Signal and Wireless, and IoT Systems and Connectivity, with fiscal 2026 net sales of $1B.
The company serves infrastructure, high-end consumer, and industrial end markets. It uses a fab-lite model, outsourcing most wafer fabrication and assembly while keeping some internal manufacturing and test capacity in Colorado Springs, and the March 2026 HieFo acquisition added internal foundry capability for data center interconnect devices.
Economic Moat
Business Model
Semtech’s moat is built on design wins, application support, and analog expertise rather than on a single protected product. I view that as harder to copy quickly than a pure digital design business because customers buy performance and technical support, and the company’s 303 U.S. patents and 541 foreign patents add another layer of differentiation even if they do not create a hard wall.
The business has also become broader over time. The Sierra Wireless acquisition expanded the IoT platform, and the HieFo deal pushed the model further toward data center interconnects, which gives Semtech more ways to stay relevant as infrastructure spending shifts.
Business & Operating Risks
The main disclosed risk is concentration. Authorized distributors accounted for about 74% of fiscal 2026 net sales, China was 47% of net sales, and the company says quarterly revenue is highly dependent on turns fill orders, so a single order pushout can hit both revenue and gross margin.
Integration risk is still real as well. The Sierra Wireless separation and related portfolio cleanup could distract management and delay design wins, but I do not think those risks directly break the moat; they test execution more than they erase the company’s design-in advantage.
The Barrick-style moat threat here is concentration, not the product franchise itself: the customer and geography mix can pressure results, but it does not appear to undermine the underlying design-win model.
Management Discussion & Analysis
Management is responding to the concentration and integration issues by extending debt maturities, reviewing non-core assets, and steering capital toward the parts of the portfolio that fit the higher-margin mix. That is the right response to the risks above, although it does not remove them.
The financing actions matter because they bought time. Semtech issued $402.5M of 0% convertible notes due 2030, used part of the proceeds to retire the 2027 and 2028 notes, and ended with $195.2M of cash plus $451.6M of undrawn revolver capacity, so liquidity is not the immediate problem.
Recent Events
The June 2026 severance-plan amendment strengthens retention and reduces key-person risk, but it also raises the cost of future restructuring. That is supportive of continuity, though it is not a major moat enhancer.
Stockholders also approved a 4.3 million share increase to the 2017 Long-Term Equity Incentive Plan, which gives management more room to use stock for compensation and retention. I read that as helpful for execution, but it adds dilution risk.
The first-quarter fiscal 2027 earnings release mainly confirms that the company is still operating on a normal reporting cadence. Taken together, the recent filings leave the moat intact, but they do not yet show a cleaner structural edge than the one already embedded in the business model.
Financial Analysis
Growth
SMTC — Financial Growth (Quarterly, USD Mil)
| Metric | 2025-07-31 | 2025-10-31 | 2026-01-31 | 2026-04-30 | 2026-07-31 |
|---|---|---|---|---|---|
| REVENUE (USD Mil) | 257.6 | 267 | 274.4 | 291 | 341.9 |
| EBIT (USD Mil) | -16.2 | 7.9 | -29.6 | 26.9 | 56.4 |
| EBITDA (USD Mil) | -4.5 | 19.4 | -18 | 37.6 | 67.8 |
| NET INCOME (USD Mil) | -27.1 | -2.9 | -29.8 | 26.6 | 160.1 |
| DILUTED EPS | -0.3 | 0 | -0.3 | 0.3 | 1.6 |
Source: Yahoo Finance — Quarterly Financial Statements
Revenue rose from $257.6M to $341.9M across the five reported quarters, and the latest quarter was the strongest in the set. That is a meaningful step-up, but I do not read it as a clean acceleration story because the table shows sequential improvement rather than a full year-over-year bridge for every period.
EBITDA moved from $-4.5M to $67.8M over the same span, while net income reached $160.0M and diluted EPS rose to 1.59. The key point for me is that earnings are now scaling faster than sales, which is what you want to see if the margin recovery is real rather than purely cyclical.
Profitability
SMTC — Profitability (TTM)
| Metric | TTM |
|---|---|
| Operating Margin (TTM) | 16.2% |
| Net Margin (TTM) | 13.1% |
| Return on Assets (TTM) | 5.8% |
| Return on Equity (TTM) | 23.7% |
| Gross Margin (TTM) | 52.9% |
| EBITDA Margin (TTM) | 15.3% |
Source: Yahoo Finance — Trailing Twelve Months (TTM)
TTM gross margin was 52.9%, operating margin was 16.2%, EBITDA margin was 15.3%, and net margin was 13.1%. That spread tells me the company is already converting a healthy share of revenue into profit, but operating expenses still absorb a meaningful part of the gross margin.
ROE was 23.7% TTM and ROA was 5.79%, so leverage is helping equity returns. That is consistent with the balance-sheet profile above: the business is profitable, but the returns are not coming from a fortress balance sheet.
Valuation
SMTC — Valuation Multiples
| Metric | Value |
|---|---|
| Current Share Price (USD) | 168.3 |
| Market Cap (USD Mil) | 15,705 |
| Enterprise Value (USD Mil) | 16,026 |
| Trailing P/E | 111.4 |
| Forward P/E | 28.7 |
| Price/Sales (TTM) | 13.4 |
| Price/Book (mrq) | 21 |
| EV/Revenue | 13.6 |
| EV/EBITDA | 89.4 |
| Beta (5Y Monthly) | 2.42 |
| FCF Yield % (TTM) | 0.8% |
| Forward EPS (USD) | 5.9 |
| Analyst Target Price – Low (USD) | 155 |
| Analyst Target Price – Mean (USD) | 214.6 |
| Analyst Target Price – High (USD) | 300 |
| # Analyst Opinions | 14 |
Source: Yahoo Finance
Semtech trades at 111.4x trailing P/E, 28.7x forward P/E, 13.4x price/sales, 13.7x EV/revenue, and 89.4x EV/EBITDA. Those are demanding multiples for a company with 0.8% FCF yield, even if the forward EPS of 5.86 shows the earnings base is expected to improve.
On the analysis here, I would put fair value in a wide range of roughly $155-$215. That sits around the analyst mean target of $214.6 and above the $155 low, so my range is not outside consensus, but I weight the concentration risk and the still-modest cash yield more heavily than the average analyst appears to.
The implied earnings power matters more than the headline multiple. Forward EPS of 5.86 is below AMAT’s $18.5 and CRDO’s $9.7, so Semtech is not being valued like the strongest earnings compounder in the peer set; it is being valued like a smaller company with a sharper recovery path, which is a higher bar to clear.
Leverage
SMTC — Leverage & Coverage (Quarterly)
| Metric | Value |
|---|---|
| Total Debt/Equity % (mrq) | 70.1 |
| Current Ratio (mrq) | 1.7 |
| Total Debt (mrq, USD Mil) | 525 |
| Operating Cash Flow (TTM, USD Mil) | 214 |
| Levered Free Cash Flow (TTM, USD Mil) | 132.7 |
| Net Debt/EBITDA (TTM) | 1.8 |
| FCF Margin % (TTM) | 11.3% |
Source: Yahoo Finance — Quarterly Financial Statements
Total debt was $525M and the current ratio was 1.698, so the balance sheet is serviceable but not loose. Net debt/EBITDA was 1.79x, operating cash flow was $214M TTM, and levered free cash flow was $132.7M TTM, which tells me the company can fund itself, but not with much excess room.
That leverage profile links directly to the valuation. A business trading at 13.7x EV/revenue can support that multiple only if cash generation stays steady, because the equity has limited room to absorb a margin reset if revenue slows.
Insider Activity
Insiders were net sellers in the period shown, with 43 open-market sales and 0 open-market purchases from 2025-01-01 to 2026-06-03. The selling was broad enough to include the CEO, COO, and multiple directors, which does not help sentiment.
I do not treat insider selling as a thesis breaker on its own, but it does reinforce the valuation concern. When the stock is already expensive, persistent open-market sales make me less willing to pay up for the recovery.
Comparable Analysis
LF0 has published standalone analyses of these peers: Applied Materials (AMAT) (rated Hold).
Growth
| Company | Revenue TTM (USD Mil) | Revenue Growth YoY % | EBITDA TTM (USD Mil) | Diluted EPS TTM |
|---|---|---|---|---|
| SMTC | 1,174.2 | 32.7% | 179.3 | 1.5 |
| CRDO | 1,591 | 114.7% | 543.2 | 3 |
| AMAT | 30,837 | 24.8% | 10,155 | 11.8 |
| MRVL | 9,450.3 | 36.5% | 2,850.3 | 3.1 |
| MCHP | 5,122.3 | 38.0% | 1,506.1 | 0.7 |
| SWKS | 4,014.1 | -3.1% | 880.2 | 2 |
Source: Yahoo Finance
Semtech’s 32.7% revenue growth TTM is solid, but it trails CRDO’s 114.7% and sits near MRVL’s 36.5% and MCHP’s 38.0%. AMAT grew 24.8% and SWKS declined 3.1%, so Semtech is clearly in the upper half of the group, just not the fastest name.
That matters because the market is not giving Semtech a growth premium for free. It is paying a premium multiple, but the peer set shows faster growers with cleaner earnings momentum.
Valuation
| Company | Current Share Price (USD) | Trailing P/E | Forward P/E | EV/Revenue | EV/EBITDA | Price/Sales (TTM) | Price/Book (mrq) | Market Cap (USD Mil) | Enterprise Value (USD Mil) | Beta (5Y Monthly) | FCF Yield % (TTM) | Forward EPS | Analyst Target Price – Low | Analyst Target Price – Mean | Analyst Target Price – High | # Analyst Opinions |
|---|---|---|---|---|---|---|---|---|---|---|---|---|---|---|---|---|
| SMTC | 168.3 | 111.4 | 28.7 | 13.6 | 89.4 | 13.4 | 21 | 15,705 | 16,026 | 2.42 | 0.8% | 5.9 | 155 | 214.6 | 300 | 14 |
| CRDO | 200.8 | 66.1 | 20.7 | 23.3 | 68.1 | 23.7 | 13.8 | 37,748 | 37,010 | 3.25 | 0.7% | 9.7 | 185 | 279.1 | 315 | 20 |
| AMAT | 497.5 | 42.1 | 26.9 | 12.7 | 38.7 | 12.8 | 15.4 | 394,839 | 392,952 | 1.59 | 0.8% | 18.5 | 358 | 635.3 | 900 | 36 |
| MRVL | 265.9 | 84.4 | 36.5 | 24.8 | 82.3 | 25.3 | 12.6 | 238,930 | 234,486 | 2.26 | 1.0% | 7.3 | 210 | 338 | 450 | 44 |
| MCHP | 73.8 | 108.6 | 16.1 | 8.8 | 30 | 7.8 | 6.2 | 40,090 | 45,217 | 1.76 | 3.4% | 4.6 | 80 | 107.8 | 135 | 25 |
| SWKS | 74.7 | 37.9 | 13.1 | 2.8 | 12.6 | 4.4 | 2 | 17,567 | 11,122 | 1.48 | 2.5% | 5.7 | 61 | 75.6 | 107 | 17 |
Source: Yahoo Finance
Semtech trades at 13.6x EV/revenue and 89.4x EV/EBITDA, which is richer than AMAT at 12.7x and 38.7x, and far above SWKS at 2.8x and 12.6x. CRDO and MRVL also trade at elevated revenue multiples, but Semtech’s 0.8% FCF yield is still weak relative to the group, so the stock is not cheap on cash either.
On a peer-multiple basis, the implied range is wide, but the current price already sits in the upper half of what the group can justify. I think the market is paying for a recovery that still needs to show up in sustained cash flow, not just one strong quarter.
Profitability
| Company | Operating Margin (TTM) | Net Margin (TTM) | Return on Assets (TTM) | Return on Equity (TTM) | Gross Margin (TTM) | EBITDA Margin (TTM) |
|---|---|---|---|---|---|---|
| SMTC | 16.2% | 13.1% | 5.8% | 23.7% | 52.9% | 15.3% |
| CRDO | 25.2% | 33.8% | 16.1% | 30.7% | 67.1% | 34.1% |
| AMAT | 33.7% | 30.1% | 15.5% | 41.1% | 49.4% | 32.9% |
| MRVL | 16.7% | 27.9% | 4.1% | 16.5% | 52.2% | 30.2% |
| MCHP | 24.0% | 9.3% | 3.5% | 7.2% | 60.2% | 29.4% |
| SWKS | 8.8% | 7.2% | 3.4% | 5.1% | 40.7% | 21.9% |
Source: Yahoo Finance
Semtech’s 16.2% operating margin and 13.1% net margin are respectable, but they sit below CRDO’s 25.2% and 33.8%, AMAT’s 33.7% and 30.1%, and MRVL’s 16.7% and 27.9%. Gross margin at 52.9% is decent, yet it still trails CRDO’s 67.1% and MCHP’s 60.2%.
The margin profile is good enough to support the business, but not good enough to justify the richest multiples in the peer group. That is why I see Semtech as a quality recovery, not a clear best-in-class compounder.
Leverage
| Company | Total Debt/Equity % (mrq) | Current Ratio (mrq) | Total Debt (mrq, USD Mil) | Operating Cash Flow TTM (USD Mil) | Free Cash Flow TTM (USD Mil) | Net Debt/EBITDA (TTM) | FCF Margin % (TTM) |
|---|---|---|---|---|---|---|---|
| SMTC | 70.1 | 1.7 | 525 | 214 | 132.7 | 1.8 | 11.3% |
| CRDO | 1 | 7.4 | 26.2 | 500.4 | 248.3 | -1.4 | 15.6% |
| AMAT | 28.7 | 2.4 | 7,346 | 8,396 | 3,075.4 | -0.2 | 10.0% |
| MRVL | 28.5 | 3.2 | 5,286.1 | 2,200.3 | 2,408.1 | 0.5 | 25.5% |
| MCHP | 83.7 | 1.9 | 5,398.7 | 1,198 | 1,364.8 | 3.4 | 26.6% |
| SWKS | 11.9 | 3.1 | 681.1 | 716.2 | 448.8 | -0.1 | 11.2% |
Source: Yahoo Finance
Semtech’s 70.1% debt/equity is higher than CRDO’s 1.0%, AMAT’s 28.7%, MRVL’s 28.5%, and SWKS’s 11.9%, though its 1.8x net debt/EBITDA is much more manageable than MCHP’s 3.4x. Current ratio at 1.698 is adequate, but it is not the kind of liquidity cushion that would make a premium valuation easy to defend.
That leverage gap helps explain why some peers deserve better multiples than Semtech even when growth looks similar. In other words, the market is not just pricing revenue growth; it is also pricing balance-sheet risk.
Conclusion
I would put my rating as a strong sell because the stock already reflects a recovery that still needs to prove itself in cash and margin durability. The latest quarter was strong, but the valuation is already at 111.4x trailing P/E and 13.7x EV/revenue, so the burden of proof is on Semtech to show that the improvement is durable rather than a short-lived spike.
The bull case is straightforward. If quarterly revenue can stay above $340M and operating margin can hold above 16.0% — meaning the business keeps converting sales into operating profit at roughly the current pace — then the current earnings run rate starts to look more credible. If FCF yield also moves materially above 0.8%, that would tell me the recovery is finally showing up in cash, not just in reported EPS.
The bear case is just as clear. If revenue slips back below $300M or operating margin falls under 15.0%, the market will be left with a stock priced for growth that is not converting into enough cash. That would make the current multiple hard to defend, especially with 70.1% debt/equity and 47% China revenue concentration still hanging over the story.
My final view is that the downside case is easier to trigger than the upside case. Semtech needs several clean quarters to justify the current valuation, while a single weak quarter would quickly expose how much optimism is already embedded in the share price.
What to Watch Next
- Quarterly revenue above $340M — would support the recovery thesis.
- Operating margin above 16.0% — would show the earnings step-up is holding.
- FCF yield materially above 0.8% — would confirm cash conversion is improving.
- Net debt/EBITDA staying near 1.8x — would keep leverage from becoming a valuation drag.
- China revenue below 47% — would reduce concentration risk and support a higher multiple.
What’s your take? I rated Semtech (SMTC) STRONG SELL above — but the goal here is to get this right, not just to publish an opinion. What would you add to this analysis, or which risk or catalyst do you think I’m under- or over-weighting? Tell me in the comments.
Sources
- SEC 10-K Annual Report — filed 2026-03-23
- SEC 8-K Filing (2026-06-08)
- SEC 8-K Filing (2026-05-26)
- SEC 8-K Filing (2026-03-16)
- SEC Form 4 Insider Transaction (2026-06-05)
- SEC Form 4 Insider Transaction (2026-06-05)
- SEC Form 4 Insider Transaction (2026-06-05)
- SEC 10-K Annual Report — FY2026
- SEC 10-K Annual Report — FY2025
- SEC 10-K Annual Report — FY2024
- SEC 10-K Annual Report — FY2023
- SEC 10-K Annual Report — FY2022
Data sourced from Yahoo Finance and SEC EDGAR. Not investment advice.
Leave a Comment