
| Company | Oct 25 | Nov 25 | Dec 25 | Jan 26 | Feb 26 | Mar 26 | Apr 26 | May 26 | Jun 26 | Jul 26 | Aug 26 | Sep 26 | 12-Mo |
|---|---|---|---|---|---|---|---|---|---|---|---|---|---|
| STRC | +3% | -2% | +3% | +1% | +2% | +1% | +1% | +0% | -13% | +7% | +10% | +3% | +16% |
| CRWD | +11% | -6% | -8% | -6% | -16% | +5% | +14% | +64% | +4% | +0% | +21% | +15% | +116% |
| DDOG | +14% | -2% | -15% | -5% | -13% | +5% | +12% | +87% | +5% | +3% | -12% | +16% | +92% |
| DT | +4% | -12% | -3% | -12% | -6% | +3% | -2% | +18% | +3% | +1% | +23% | +6% | +19% |
| ESTC | +6% | -21% | +7% | -13% | -21% | -4% | -7% | +39% | -12% | +15% | +48% | -6% | +9% |
| NET | +18% | -21% | -2% | -10% | -3% | +20% | -1% | +18% | +1% | +14% | +9% | +14% | +62% |
Source: Yahoo Finance monthly adjusted close.
Quick Thesis
- Rated strong sell — valuation assumes a much better business than current results justify.
- Most important strength: $2.25B U.S. dollar reserve and $717,131 bitcoins as of February 13, 2026.
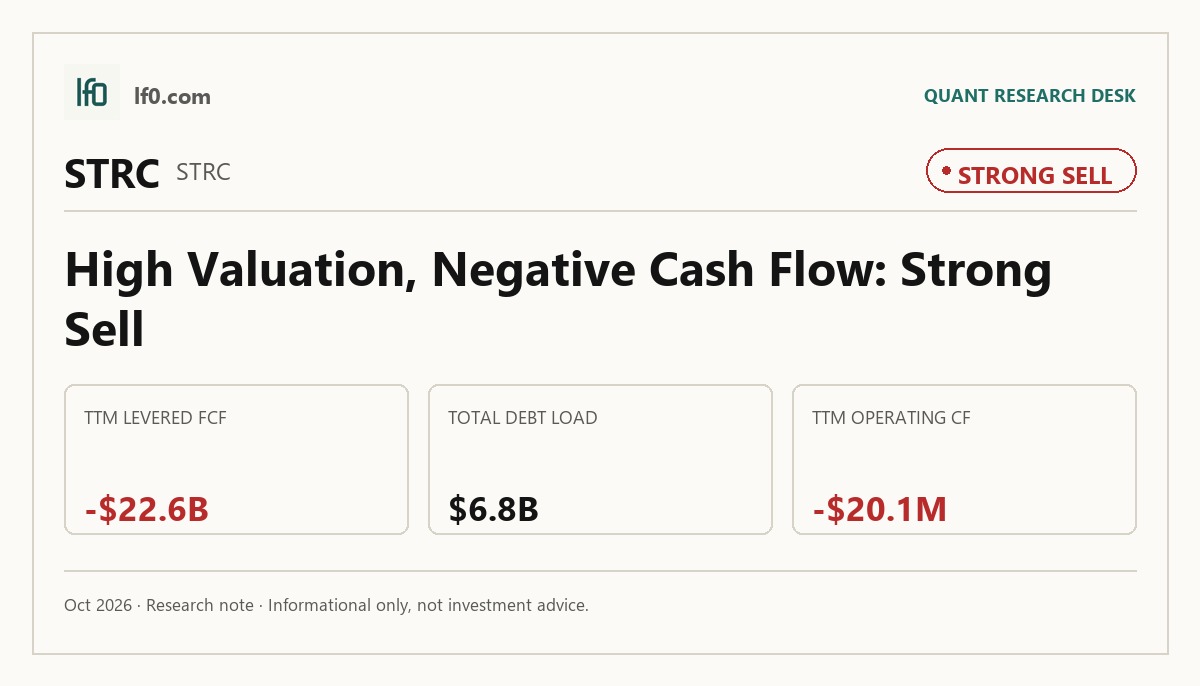
- Most important risk: $6.8B of debt against negative $20.09M TTM operating cash flow.
- Valuation is rich: 114.3x EV/revenue and 0.94x price/book.
- I would turn more constructive only if operating margin turns positive and software covers more funding needs.
Executive Summary
Rating: STRONG SELL | STRC
We’ll begin tracking this call’s performance since publication once sufficient adjusted-close data is available.
I would put my rating as a strong sell because the stock is priced for a bitcoin-treasury premium that is not backed by operating cash flow, and the software business is still not funding the capital structure. The most defensible strength is the $2.25B U.S. dollar reserve as of February 13, 2026, which gives the company a buffer for preferred dividends and interest, but the main risk is still the $6.8B debt load against negative $20.09M operating cash flow TTM, so the model depends on capital markets staying open. In my view, that is a fragile setup when the stock already trades at 114.3x EV/revenue and 0.94x price/book. I would turn more constructive only if operating margin turns positive and the software franchise starts covering a meaningful share of funding needs.
Company Profile
Strategy Inc. runs enterprise analytics software and manages a bitcoin treasury. The software side sells Strategy One, a cloud subscription or on-premises license for business intelligence, reporting, embedded analytics, and AI tools, plus support and consulting; cloud subscriptions typically run 36 months, and on-premises licenses entered end of support in January 2025, with full support ending December 31, 2026. The treasury side buys and holds bitcoin, then funds that position with Class A common stock, preferred stock, convertible notes, senior secured notes, and at-the-market equity offerings.
Founded in 1989, the company changed its name from MicroStrategy Incorporated to Strategy Inc on August 11, 2025. It first bought bitcoin in August 2020 and adopted a Treasury Reserve Policy in September 2020. Strategy is headquartered in Tysons Corner, Virginia, serves customers worldwide through direct sales offices and partners, and had 1,539 employees as of December 31, 2025. It is listed on Nasdaq under MSTR.
Economic Moat
Business Model
The most defensible element is the scale of its bitcoin treasury. According to its SEC filings, Strategy is the world’s first and largest Bitcoin Treasury Company and held approximately 717,131 bitcoins as of February 13, 2026. I feel that a competitor would struggle to replicate that position within 3 years because the edge is not just ownership, but the combination of accumulated bitcoin, a Treasury Reserve Policy that makes bitcoin the primary reserve asset, and a capital-markets machine built to keep adding to that stack.
The financing architecture around the reserve is the second layer of the moat. In 2025 the company structured five classes of preferred stock, and in December 2025 it created a U.S. dollar reserve with a $2.25B balance as of February 13, 2026 to support preferred dividends and interest. That reserve matters because it reduces near-term funding stress and makes the bitcoin-backed capital structure more durable, not just more aggressive.
Business & Operating Risks
The most material disclosed risk is liquidity dependence on bitcoin and external financing. The enterprise analytics software business did not generate positive cash flow from operations in FY2025, and the company does not expect it to fund debt service, preferred dividends, or other liquidity needs over the next twelve months. That leaves the $2.25B USD reserve and at-the-market equity issuance as the bridge, but if the reserve is depleted and financing is unavailable, the company may have to sell bitcoin, possibly below cost basis, or default on obligations.
Bitcoin price volatility is the second major risk because it directly drives reported earnings and balance-sheet value. The company recorded a $5.40B unrealized loss on digital assets in FY2025 after adopting fair-value accounting under Accounting Standards Update 2023-08, and quarterly net income can swing on price moves rather than operating performance. Regulatory and market-structure risk around bitcoin is also more visible now, with explicit discussion of the SEC’s Crypto Task Force, the GENIUS Act, the CLARITY Act, and the possibility that bitcoin could be reclassified as a security.
The disclosed risks do not threaten the moat itself so much as they test whether the reserve-backed capital structure can keep supporting it through a severe bitcoin drawdown.
Management Discussion & Analysis
Management is signaling that the bitcoin treasury model now sits ahead of the software business in capital allocation, and it is still using market access rather than operating cash flow to fund that model. The company ended 2025 with a $2.25B USD reserve, 672,500 bitcoins, and a medium-term capital plan to raise $84B. That tells me the priority is to keep funding preferred dividends, interest expense, and bitcoin purchases through capital markets.
The software business is not carrying the strategy. Software operations used $67.2M of cash in 2025, so the recurring business is not self-funding the treasury build. Cloud subscription revenue grew $68.9M in 2025 while product license revenue and related product support revenue fell $48.5M in aggregate, which shows the mix is shifting but not enough to offset the financing burden. Management is actively responding to the disclosed funding risk through the reserve and capital raises, but the operating business still has not proven to me that it can absorb the fixed cost base.
Recent Events
The most significant development I see is the May 18, 2026 and June 8, 2026 capital raises through Strategy’s at-the-market program, which funded 24,869 bitcoin purchases in the May 11 to May 17, 2026 period and another 1,550 bitcoin in the June 1 to June 7, 2026 period. That pattern strengthens the treasury-accumulation thesis because the company is still converting equity issuance into bitcoin at scale, while the June 8, 2026 filing also shows $1B in the USD reserve, which improves near-term dividend and interest coverage.
The June 1, 2026 filing also matters because Strategy sold 32 bitcoin to help fund preferred dividends and maintained the STRC dividend rate at 11.50% for monthly periods starting June 1, 2026. I read that as tighter cash discipline around the preferred stack, but it also shows the structure is becoming more reliant on reserve management and selective bitcoin sales to support distributions. The recent filings reinforce the moat only if the reserve keeps growing faster than the funding burden.
Financial Analysis
Growth
STRC — Financial Growth (Quarterly, USD Mil)
| Metric | 2025-06-30 | 2025-09-30 | 2025-12-31 | 2026-03-31 | 2026-06-30 |
|---|---|---|---|---|---|
| REVENUE (USD Mil) | 114.5 | 128.7 | 123 | 124.3 | 122.4 |
| EBIT (USD Mil) | 14,023.8 | 3,890.1 | -17,449.5 | -14.9 | -8,202.4 |
| EBITDA (USD Mil) | 14,032.9 | 3,894.3 | -17,443.9 | -6.2 | -8,190.1 |
| NET INCOME (USD Mil) | 10,020.8 | 2,785 | -12,436.7 | -12,542.7 | -8,219.6 |
| DILUTED EPS | — | — | — | — | — |
Source: Yahoo Finance — Quarterly Financial Statements
Revenue was $114.5M in Q2 2025, $128.7M in Q3 2025, $123M in Q4 2025, $124.3M in Q1 2026, and $122.4M in Q2 2026. That is a choppy but broadly flat top line, with the latest quarter down 1.6% sequentially and up 6.9% from Q2 2025, so growth is not compounding. The software base is still there, but the growth profile is too modest to justify the valuation on its own.
EBITDA moved from $14M in Q2 2025 to $3.9M in Q3 2025, then to negative $17.4M in Q4 2025 and negative $8.2M in Q2 2026. That swing is far worse than revenue and, without a cleaner operating explanation, it tells me the business is not yet translating sales into durable earnings power. The moat and the financials are pulling in different directions: the treasury stack is expanding, but the operating engine is not keeping pace.
Profitability
STRC — Profitability (TTM)
| Metric | TTM |
|---|---|
| Operating Margin (TTM) | -6,808.1% |
| Net Margin (TTM) | 0.0% |
| Return on Assets (TTM) | -38.7% |
| Return on Equity (TTM) | -63.6% |
| Gross Margin (TTM) | 67.6% |
| EBITDA Margin (TTM) | -7,295.1% |
Source: Yahoo Finance — Trailing Twelve Months (TTM)
TTM gross margin was 67.6%, but TTM operating margin was negative 6,808.1% and TTM EBITDA margin was negative 7,295.1%, which means the core product economics are positive while overhead and non-operating items overwhelm the income statement. TTM net margin was 0.0%, TTM return on assets was negative 38.7%, and TTM return on equity was negative 63.6%, so the business is still far from durable profitability.
The gap between gross margin and operating or EBITDA margin is extreme, so I would weight the gross margin more than the bottom-line ratios when judging the operating engine. Even so, the current scale of losses shows the company is still a long way from turning the software franchise into a self-funding asset.
Valuation
STRC — Valuation Multiples
| Metric | Value |
|---|---|
| Current Share Price (USD) | 99.5 |
| Market Cap (USD Mil) | — |
| Enterprise Value (USD Mil) | 56,967 |
| Trailing P/E | — |
| Forward P/E | — |
| Price/Sales (TTM) | — |
| Price/Book (mrq) | 0.9 |
| EV/Revenue | 114.3 |
| EV/EBITDA | -1.6 |
| Beta (5Y Monthly) | 3.57 |
| FCF Yield % (TTM) | — |
| Forward EPS (USD) | — |
| Analyst Target Price – Low (USD) | — |
| Analyst Target Price – Mean (USD) | — |
| Analyst Target Price – High (USD) | — |
| # Analyst Opinions | — |
Source: Yahoo Finance
STRC trades at 114.3x EV/revenue and 0.94x price/book, while EV/EBITDA is negative at -1.6x because trailing EBITDA is negative. The current share price is $99.5, and book value per share is $105.95, which means the stock trades slightly below stated book value even though the enterprise value is priced at more than 114x revenue. That combination tells me the market is not valuing STRC on current operating cash generation; it is pricing in either a much larger monetization of the bitcoin treasury or a sharp improvement in software economics that has not yet shown up in reported earnings.
On the analysis here, I would put fair value in a range of roughly $6.6-$66.2 per share using peer EV/revenue as a rough anchor, then adjusting for STRC’s cash and debt profile. I do not think there is a meaningful analyst consensus to compare against because the reference data show no analyst opinions or target prices. The implied range is also not a clean like-for-like software valuation, because STRC’s bitcoin treasury is the real asset base and the software business is still the cash-flow constraint.
Leverage
STRC — Leverage & Coverage (Quarterly)
| Metric | Value |
|---|---|
| Total Debt/Equity % (mrq) | 14.9 |
| Current Ratio (mrq) | 5.4 |
| Total Debt (mrq, USD Mil) | 6,770.8 |
| Operating Cash Flow (TTM, USD Mil) | -20.1 |
| Levered Free Cash Flow (TTM, USD Mil) | -22,587.5 |
| Net Debt/EBITDA (TTM) | -0.1 |
| FCF Margin % (TTM) | -4,532.5% |
Source: Yahoo Finance — Quarterly Financial Statements
Total debt was $6.8B at mrq, with total debt/equity at 14.9% and a current ratio of 5.4x, so near-term liquidity is ample. Operating cash flow TTM was negative $20.1M and levered free cash flow TTM was negative $22.6B, while net debt/EBITDA TTM was negative 0.1x and FCF margin TTM was negative 4,532.5%. The negative cash flow profile means EBITDA is not converting into cash; instead, cash is being absorbed by the business, which leaves flexibility dependent on the $2.4B cash balance rather than recurring generation.
That is why the leverage picture matters more than the headline debt/equity ratio. The balance sheet is not distressed today, but the company is still funding a capital-intensive strategy with external capital and reserve management, not with internally generated cash.
Insider Activity
The insider transaction record I see here is clearly net selling, with 142 open-market sales for $71.3M versus 10 open-market purchases for $2.8M over 2025-03-20 to 2026-06-05. The activity is concentrated, not broad, because the recent selling is dominated by the CEO and CFO in a short window, while the sample is limited to 80 Form 4 filings. In my view, that is a bear signal because the open-market selling is persistent and led by top management, which weakens alignment with outside shareholders.
Comparable Analysis
LF0 has published standalone analyses of these peers: Datadog (DDOG) (rated Hold).
Growth
| Company | Revenue TTM (USD Mil) | Revenue Growth YoY % | Diluted EPS TTM |
|---|---|---|---|
| STRC | 498.4 | 6.9% | — |
| CRWD | 5,396.1 | 25.8% | 0.1 |
| DDOG | 3,966.7 | 35.6% | 0.5 |
| DT | 2,095.6 | 16.2% | 0.5 |
| ESTC | 1,802.2 | 15.1% | 3.5 |
| NET | 2,512.3 | 35.9% | -0.6 |
Source: Yahoo Finance
STRC’s revenue grew 6.9% TTM on $498.4M of sales, which trails CRWD at 25.8%, DDOG at 35.6%, DT at 16.2%, ESTC at 15.1%, and NET at 35.9%. That is a clear growth discount, and it looks justified because STRC’s EBITDA was negative $36.4M TTM and its operating margin was negative 6,808.1%, so the market is paying for a much slower, lower-quality growth profile than the software peers.
Valuation
| Company | Current Share Price (USD) | Trailing P/E | Forward P/E | EV/Revenue | EV/EBITDA | Price/Sales (TTM) | Price/Book (mrq) | Market Cap (USD Mil) | Enterprise Value (USD Mil) | Beta (5Y Monthly) | FCF Yield % (TTM) | Forward EPS | Analyst Target Price – Low | Analyst Target Price – Mean | Analyst Target Price – High | # Analyst Opinions |
|---|---|---|---|---|---|---|---|---|---|---|---|---|---|---|---|---|
| STRC | 99.5 | — | — | 114.3 | -1.6 | — | 0.9 | — | 56,967 | 3.57 | — | — | — | — | — | — |
| CRWD | 270 | 5,398.6 | 168.1 | 49.6 | 2,504.5 | 51.2 | 54.2 | 276,391 | 267,637 | 1.20 | 0.7% | 1.6 | 132 | 237.8 | 325 | 50 |
| DDOG | 277.4 | 554.8 | 93.3 | 23.6 | 1,130.6 | 25.1 | 22.8 | 99,615 | 93,724 | 1.51 | 1.1% | 3 | 158 | 287.1 | 340 | 47 |
| DT | 60.5 | 121 | 26.4 | 7.8 | 56.1 | 8.3 | 7.2 | 17,488 | 16,336 | 0.77 | 3.1% | 2.3 | 42 | 60 | 74 | 34 |
| ESTC | 93.8 | 26.8 | 23.7 | 4.9 | -400.1 | 5.5 | 7.6 | 9,852 | 8,909 | 1.04 | 5.1% | 4 | 75 | 110.7 | 130 | 26 |
| NET | 348.9 | — | 208.2 | 48.4 | -33,654.1 | 49.5 | 76.7 | 124,250 | 121,491 | 1.65 | 0.6% | 1.7 | 160 | 339.7 | 413 | 31 |
Source: Yahoo Finance
STRC trades at 114.3x EV/revenue and 0.94x price/book, versus CRWD at 49.6x EV/revenue, DDOG at 23.6x, DT at 7.8x, ESTC at 4.9x, and NET at 48.4x. On a revenue basis STRC is the most expensive name in the group, and that premium is hard to defend because its growth is only 6.9% TTM while CRWD, DDOG, and NET are growing 25.8%, 35.6%, and 35.9% respectively. The stock’s 13.8% one-year return also looks modest beside CRWD at 119.1%, DDOG at 75.6%, DT at 24.3%, ESTC at 15.8%, and NET at 57.8%, which tells me the market has not rewarded STRC the way it has rewarded faster-growing peers.
Profitability
| Company | Operating Margin (TTM) | Net Margin (TTM) | Return on Assets (TTM) | Return on Equity (TTM) | Gross Margin (TTM) | EBITDA Margin (TTM) |
|---|---|---|---|---|---|---|
| STRC | -6,808.1% | 0.0% | -38.7% | -63.6% | 67.6% | -7,295.1% |
| CRWD | -2.3% | 0.8% | -0.8% | 1.5% | 75.2% | 2.0% |
| DDOG | 0.7% | 4.5% | 0.2% | 4.7% | 79.5% | 2.1% |
| DT | 12.9% | 7.2% | 4.2% | 5.9% | 81.6% | 13.9% |
| ESTC | -0.6% | 20.8% | -0.6% | 33.1% | 75.6% | -1.2% |
| NET | -7.6% | -8.2% | -2.0% | -14.4% | 72.6% | -0.1% |
Source: Yahoo Finance
STRC’s gross margin of 67.6% is below CRWD at 75.2%, DDOG at 79.5%, DT at 81.6%, ESTC at 75.6%, and NET at 72.6%, while its EBITDA margin of negative 7,295.1% is far worse than CRWD’s 2.0%, DDOG’s 2.1%, DT’s 13.9%, ESTC’s negative 1.2%, and NET’s negative 0.1%. The gap is structural and points to a cost base that is still too heavy for the revenue scale, which means STRC is not yet converting sales into operating leverage the way DT, CRWD, or DDOG do.
Leverage
| Company | Total Debt/Equity % (mrq) | Current Ratio (mrq) | Total Debt (mrq, USD Mil) | Operating Cash Flow TTM (USD Mil) | Free Cash Flow TTM (USD Mil) | Net Debt/EBITDA (TTM) | FCF Margin % (TTM) |
|---|---|---|---|---|---|---|---|
| STRC | 14.9 | 5.4 | 6,770.8 | -20.1 | -22,587.5 | -0.1 | -4,532.5% |
| CRWD | 16 | 1.6 | 820.2 | 2,016.6 | 1,995.4 | -39.2 | 37.0% |
| DDOG | 29.3 | 3.2 | 1,277.8 | 1,229 | 1,051.4 | -44.7 | 26.5% |
| DT | 6.5 | 1.2 | 159.3 | 598.4 | 546.5 | -3.3 | 26.1% |
| ESTC | 45.9 | 1.8 | 595.8 | 354.1 | 504.3 | 38.9 | 28.0% |
| NET | 217.9 | 1.8 | 3,529.3 | 633.4 | 692 | 175.5 | 27.5% |
Source: Yahoo Finance
STRC’s debt/equity is 14.9%, lower than CRWD at 16.0%, DDOG at 29.3%, DT at 6.5%, ESTC at 45.9%, and NET at 217.9%, while its net debt/EBITDA is negative 0.1x versus CRWD at negative 39.2x, DDOG at negative 44.7x, DT at negative 3.3x, ESTC at 38.9x, and NET at 175.5x. The raw debt/equity figure looks moderate, but the more important read is that STRC’s $2.4B cash exceeds debt, so the balance sheet is cash-rich rather than levered. That said, the negative $22.6B free cash flow TTM and negative 4,532.5% FCF margin show the cash burn is still a real drag on equity value, even if it is not a near-term solvency problem.
Conclusion
I would put my rating as a strong sell because the stock is priced for a bitcoin-treasury premium that is not backed by operating cash flow, and the software business is still not funding the capital structure. The most defensible strength is the $2.25B U.S. dollar reserve as of February 13, 2026, which gives the company a buffer for preferred dividends and interest, but the main risk is still the $6.8B debt load against negative $20.09M operating cash flow TTM, so the model depends on capital markets staying open. In my view, that is a fragile setup when the stock already trades at 114.3x EV/revenue and 0.94x price/book.
I would raise my rating more towards a hold if operating margin turns positive, meaning the software business is finally covering its fixed cost base, and if revenue growth reaccelerates above the 6.9% TTM pace. A cleaner bull case would also require the bitcoin treasury to keep expanding without forcing more reserve drawdown, because the current $2.25B reserve only buys time; if the company can keep funding preferred dividends and interest while gross margin stays near 67.6% and operating losses narrow, the market could justify a less punitive multiple.
I would move from strong sell to a weaker stance if the current funding structure starts to strain, especially if operating cash flow stays negative and the $2.4B cash balance falls toward the level needed to cover the $6.8B debt stack and preferred obligations. A sharper bear case would be bitcoin weakness that forces reserve use or asset sales, because the company already showed how quickly quarterly earnings can swing from a $14M EBITDA gain in Q2 2025 to an $8.2M EBITDA loss in Q2 2026, and that kind of volatility would make the equity easier to de-rate than to defend.
Weighing both sides, I think the bear case is more likely to show up first because the valuation already assumes a step-up in operating quality that has not appeared in the last two quarters. The cash buffer and bitcoin treasury keep the equity from looking distressed, but they do not make 114.3x revenue look reasonable when the business is still burning cash at this pace.
What to Watch Next
- Operating margin turning positive — would show the software base is covering fixed costs.
- Revenue growth above 6.9% TTM — would support a less punitive multiple.
- USD reserve staying above $2.25B — would reduce forced bitcoin-sale risk.
- Operating cash flow turning positive — would show the strategy is becoming self-funding.
- Bitcoin sales to fund dividends — would signal the capital structure is under more strain.
What’s your take? I rated Strategy (STRC) STRONG SELL above — but the goal here is to get this right, not just to publish an opinion. What would you add to this analysis, or which risk or catalyst do you think I’m under- or over-weighting? Tell me in the comments.
Sources
- SEC 10-K Annual Report — filed 2026-02-19
- SEC 8-K Filing (2026-06-08)
- SEC 8-K Filing (2026-06-08)
- SEC 8-K Filing (2026-06-01)
- SEC 8-K Filing (2026-05-26)
- SEC 8-K Filing (2026-05-18)
- SEC 8-K Filing (2026-05-15)
- SEC Form 4 Insider Transaction (2026-06-05)
- SEC Form 4 Insider Transaction (2026-06-05)
- SEC Form 4 Insider Transaction (2026-06-02)
- SEC 10-K Annual Report — FY2026
- SEC 10-K Annual Report — FY2025
- SEC 10-K Annual Report — FY2024
- SEC 10-K Annual Report — FY2023
- SEC 10-K Annual Report — FY2022
Data sourced from Yahoo Finance and SEC EDGAR. Not investment advice.
Leave a Comment