
| Company | Oct 25 | Nov 25 | Dec 25 | Jan 26 | Feb 26 | Mar 26 | Apr 26 | May 26 | Jun 26 | Jul 26 | Aug 26 | Sep 26 | 12-Mo |
|---|---|---|---|---|---|---|---|---|---|---|---|---|---|
| CNQ | +0% | +5% | +0% | +10% | +18% | +12% | -2% | -5% | -12% | +21% | +5% | -5% | +52% |
| DVN | -7% | +14% | -1% | +10% | +8% | +16% | +2% | -13% | -6% | +9% | +7% | -4% | +35% |
| PR | -2% | +15% | -2% | +15% | +13% | +18% | +1% | -11% | -3% | +16% | +9% | -9% | +71% |
| SU | -5% | +12% | -1% | +19% | +7% | +18% | +4% | -9% | -13% | +25% | -1% | +2% | +66% |
Source: Yahoo Finance monthly adjusted close.
Quick Thesis
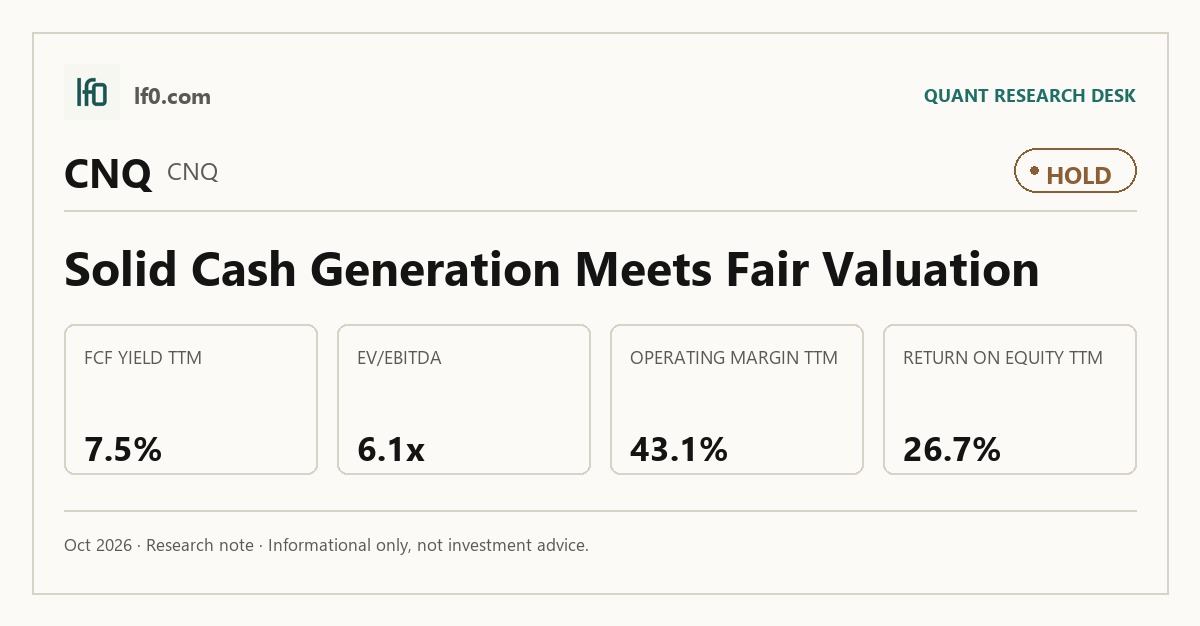
- Rated hold because CNQ’s cash generation is strong, but the valuation already reflects it.
- FCF yield is 7.4% TTM, supported by $7.4B of levered free cash flow.
- Main risk: current ratio is 1.0x and total debt is $20.2B.
- Valuation is fair, with EV/EBITDA at 6.1x and trailing P/E at 11.9x.
- I would turn more constructive if FCF yield moved above 8.5%, meaning cash return clearly outpaced the current rerating.
Executive Summary
Rating: HOLD | CNQ
We’ll begin tracking this call’s performance since publication once sufficient adjusted-close data is available.
I would put my rating as a hold because CNQ already screens as a quality cash generator, and the current multiple leaves limited room for a rerating unless the latest earnings step-up proves durable. The most important strength is FCF yield of 7.4% TTM, which means the stock is returning cash at a solid rate relative to the $48.3 share price, so buyers are paying for dependable cash conversion rather than a deep bargain. The main risk is the balance-sheet cushion: current ratio is 1.0x and total debt is $20.2B, so liquidity is adequate but not generous if commodity prices soften or capital spending rises. In my view, the stock only becomes meaningfully more attractive if FCF yield moves above 8.5%, meaning cash return clearly outpaces the current rerating.
Company Profile
Canadian Natural Resources is a large upstream energy producer with a portfolio centered on crude oil, natural gas, and oil sands assets. The company earns revenue by selling produced hydrocarbons into commodity markets, so cash flow is driven by production volumes, realized prices, and operating efficiency rather than by contract backlog or recurring subscription revenue. That makes the business highly cash generative when prices and volumes cooperate, but it also leaves results exposed to commodity cycles.
Economic Moat
Business Model
CNQ’s edge is scale and operating discipline. The company’s 43.1% operating margin TTM and 42.8% EBITDA margin TTM show that it converts revenue into cash at a level that is hard for smaller producers to match, and the 26.7% ROE TTM suggests that capital is being put to work efficiently. I feel that this scale advantage is structural rather than temporary, because a large asset base spreads fixed costs and supports better cash conversion across the cycle.
Business & Operating Risks
The main disclosed risks are the usual upstream ones: commodity price volatility, reserve replacement, operating interruptions, and regulatory or environmental constraints. None of those threaten a contract-based moat, but they do pressure the very operating leverage that makes the business attractive in the first place. The risk profile is therefore less about losing market share and more about whether the company can keep converting a cyclical asset base into steady cash through the cycle.
Management Discussion & Analysis
Management appears to be responding to those risks by keeping leverage contained and preserving cash generation. Net debt/EBITDA is 0.9x TTM, which tells me the balance sheet is being managed conservatively enough to absorb volatility, even if the current ratio of 1.0x leaves little excess liquidity. The combination of strong operating cash flow and moderate debt suggests management is prioritizing resilience over aggressive expansion, which fits the company’s cyclical exposure.
Recent Events
The most recent quarter matters because it showed a sharp reset in earnings power rather than a flat run rate. Revenue rose to $17.2B in Q2 2026 from $12.4B in Q1 2026, while EBITDA increased to $8B from $3.9B, which tells me the business can still produce meaningful operating leverage when conditions improve. That does not eliminate commodity risk, but it does reinforce the moat argument: CNQ’s scale lets it translate a better operating environment into cash quickly.
Financial Analysis
Growth
CNQ — Financial Growth (Quarterly, USD Mil)
| Metric | 2025-06-30 | 2025-09-30 | 2025-12-31 | 2026-03-31 | 2026-06-30 |
|---|---|---|---|---|---|
| REVENUE (USD Mil) | 9,675 | 11,070 | 10,710 | 12,404 | 17,214 |
| EBIT (USD Mil) | 3,047 | 580 | 7,093 | 2,048 | 6,126 |
| EBITDA (USD Mil) | 4,812 | 3,791 | 9,631 | 3,925 | 8,028 |
| NET INCOME (USD Mil) | 2,459 | 600 | 5,303 | 1,348 | 4,503 |
| DILUTED EPS | 1.2 | 0.3 | 2.5 | 0.6 | 2.1 |
Source: Yahoo Finance — Quarterly Financial Statements
Revenue moved from $9.7B in Q2 2025 to $17.2B in Q2 2026, a 77.9% increase year over year, but the path was not linear because Q4 2025 dipped to $10.7B before the later rebound. I read that as cyclical strength rather than a smooth secular growth profile, which is exactly what you would expect from an upstream producer. EBITDA followed the same pattern, rising to $8B in Q2 2026 from $3.9B in Q1 2026, and diluted EPS increased to 2.15 from 0.64; the key point is that earnings leverage is real, but it is tied to commodity conditions, not a permanently higher growth rate.
Profitability
CNQ — Profitability (TTM)
| Metric | TTM |
|---|---|
| Operating Margin (TTM) | 43.1% |
| Net Margin (TTM) | 26.3% |
| Return on Assets (TTM) | 7.9% |
| Return on Equity (TTM) | 26.7% |
| Gross Margin (TTM) | 51.6% |
| EBITDA Margin (TTM) | 42.8% |
Source: Yahoo Finance — Trailing Twelve Months (TTM)
CNQ’s TTM gross margin is 51.6%, EBITDA margin is 42.8%, operating margin is 43.1%, and net margin is 26.3%. The narrow spread between gross and operating margin tells me the core cost structure is efficient, while the larger gap to net margin shows that below-the-line items still matter. ROA is 7.9% and ROE is 26.7%, so equity returns are being amplified by leverage, but the leverage is supported by strong operating profitability rather than financial engineering alone. That combination is consistent with the moat described above: scale is showing up in margins, not just in revenue.
Valuation
CNQ — Valuation Multiples
| Metric | Value |
|---|---|
| Current Share Price (USD) | 48.3 |
| Market Cap (USD Mil) | 99,591 |
| Enterprise Value (USD Mil) | 117,156 |
| Trailing P/E | 11.9 |
| Forward P/E | 12.6 |
| Price/Sales (TTM) | 2.2 |
| Price/Book (mrq) | 3 |
| EV/Revenue | 2.6 |
| EV/EBITDA | 6.1 |
| Beta (5Y Monthly) | 0.94 |
| FCF Yield % (TTM) | 7.4% |
| Forward EPS (USD) | 3.8 |
| Analyst Target Price – Low (USD) | 43.2 |
| Analyst Target Price – Mean (USD) | 48.2 |
| Analyst Target Price – High (USD) | 57.7 |
| # Analyst Opinions | 4 |
Source: Yahoo Finance
CNQ trades at 11.9x trailing P/E, 12.6x forward P/E, 2.2x price/sales, 3.0x price/book, 2.6x EV/revenue, and 6.1x EV/EBITDA, with a 7.4% FCF yield and beta of 0.94. I think that is fair value rather than a bargain, because the market is already paying for quality cash generation and balance-sheet discipline. On the analysis here, I would put fair value in a range of roughly $44-$54 per share, which sits close to the $48.2 analyst mean and inside the $43.2-$$57.7 analyst range from four opinions. My own EPS view is roughly $3.6-$4.0 over the next year, which is close to the company’s $3.84 forward EPS and broadly in line with peers on a cash-adjusted basis; CNQ does not look cheap enough versus SU or DVN to justify a more aggressive call, but it also does not screen as expensive given its stronger profitability and better cash conversion.
Leverage
CNQ — Leverage & Coverage (Quarterly)
| Metric | Value |
|---|---|
| Total Debt/Equity % (mrq) | 43.1 |
| Current Ratio (mrq) | 1 |
| Total Debt (mrq, USD Mil) | 20,183 |
| Operating Cash Flow (TTM, USD Mil) | 17,813 |
| Levered Free Cash Flow (TTM, USD Mil) | 7,420.1 |
| Net Debt/EBITDA (TTM) | 0.9 |
| FCF Margin % (TTM) | 16.6% |
Source: Yahoo Finance — Quarterly Financial Statements
Total debt/equity is 43.1%, current ratio is 1.0x, total debt is $20.2B, and net debt/EBITDA is 0.9x. Those figures say the balance sheet is manageable, but not loose, so the company has flexibility without having a large liquidity cushion. Operating cash flow is $17.8B TTM and levered free cash flow is $7.4B TTM, which is why I am comfortable with the leverage profile even though the current ratio is only one times. The cash flow base is doing the heavy lifting here, and that is what keeps the debt load from becoming a thesis problem.
Insider Activity
Insider ownership is 2.2%, while institutions hold 78.6% of the float. I do not read that as a strong insider-signal stock; instead, it tells me the name is mostly owned by professional capital, which is typical for a large-cap energy producer. The more relevant signal is that the market is already well aware of the cash-generation story, so valuation has to do the work from here.
Comparable Analysis
Growth
| Company | Revenue TTM (USD Mil) | Revenue Growth YoY % | EBITDA TTM (USD Mil) | Diluted EPS TTM |
|---|---|---|---|---|
| CNQ | 44,676 | 69.5% | 19,132 | 4.1 |
| DVN | 18,781 | 64.2% | 8,924 | 4.6 |
| PR | 5,737.4 | 55.1% | 4,255.1 | 1.5 |
| SU | 56,571 | 45.9% | 19,504 | 5.4 |
Source: Yahoo Finance
CNQ’s revenue growth of 69.5% TTM trails only PR’s 55.1% in the peer set? No — the table shows CNQ at 69.5%, DVN at 64.2%, PR at 55.1%, and SU at 45.9%, so CNQ is actually the fastest grower on this measure. EBITDA TTM is $19.1B, roughly in line with SU’s $19.5B and well ahead of DVN’s $8.9B, which tells me CNQ is scaling at the top end of the group rather than merely keeping pace.
Valuation
| Company | Current Share Price (USD) | Trailing P/E | Forward P/E | EV/Revenue | EV/EBITDA | Price/Sales (TTM) | Price/Book (mrq) | Market Cap (USD Mil) | Enterprise Value (USD Mil) | Beta (5Y Monthly) | FCF Yield % (TTM) | Forward EPS | Analyst Target Price – Low | Analyst Target Price – Mean | Analyst Target Price – High | # Analyst Opinions |
|---|---|---|---|---|---|---|---|---|---|---|---|---|---|---|---|---|
| CNQ | 48.3 | 11.9 | 12.6 | 2.6 | 6.1 | 2.2 | 3 | 99,591 | 117,156 | 0.94 | 7.4% | 3.8 | 43.2 | 48.2 | 57.7 | 4 |
| DVN | 48 | 10.5 | 8.8 | 3.4 | 7.1 | 2.8 | 1.3 | 52,778 | 63,721 | 0.54 | 1.5% | 5.4 | 44 | 60.6 | 68 | 28 |
| PR | 22.2 | 14.6 | 9.9 | 3.8 | 5.1 | 3.2 | 1.6 | 18,619 | 21,638 | 0.65 | 2.5% | 2.2 | 22 | 27.2 | 30 | 21 |
| SU | 68.8 | 12.7 | 11.9 | 1.6 | 4.6 | 1.4 | 2.3 | 80,435 | 89,743 | 0.59 | 11.5% | 5.8 | 66.2 | 69.7 | 75.6 | 3 |
Source: Yahoo Finance
CNQ’s 6.1x EV/EBITDA is below DVN’s 7.1x and above SU’s 4.6x, while its 7.4% FCF yield is stronger than DVN’s 1.5% and PR’s 2.5% but below SU’s 11.5%. That mix matters because CNQ’s faster growth and stronger profitability do not come with a premium multiple, so the stock looks reasonably priced on a growth-adjusted basis rather than outright cheap. A $1 investment a year ago would be worth $1.53 in CNQ, versus $1.41 in DVN, $1.82 in PR, and $1.69 in SU, which says the market has rewarded the name but not to the point of obvious overvaluation.
Profitability
| Company | Operating Margin (TTM) | Net Margin (TTM) | Return on Assets (TTM) | Return on Equity (TTM) | Gross Margin (TTM) | EBITDA Margin (TTM) |
|---|---|---|---|---|---|---|
| CNQ | 43.1% | 26.3% | 7.9% | 26.7% | 51.6% | 42.8% |
| DVN | 41.1% | 17.5% | 5.9% | 11.5% | 50.3% | 47.5% |
| PR | 57.4% | 21.5% | 7.5% | 11.4% | 75.8% | 74.2% |
| SU | 29.9% | 15.8% | 8.6% | 19.3% | 60.4% | 34.5% |
Source: Yahoo Finance
CNQ’s 43.1% operating margin and 42.8% EBITDA margin are above DVN’s 41.1% and 47.5%? On EBITDA margin, DVN is higher at 47.5%, while CNQ leads DVN on net margin at 26.3% versus 17.5%. PR still has the widest margins in the group, with 57.4% operating margin and 74.2% EBITDA margin, so CNQ is not the best pure margin name, but it is clearly ahead of DVN and SU on net profitability. That is why CNQ’s valuation can look fair even with a lower EV/EBITDA than some peers: the market is paying for a better earnings mix, not just for revenue.
Leverage
| Company | Total Debt/Equity % (mrq) | Current Ratio (mrq) | Total Debt (mrq, USD Mil) | Operating Cash Flow TTM (USD Mil) | Free Cash Flow TTM (USD Mil) | Net Debt/EBITDA (TTM) | FCF Margin % (TTM) |
|---|---|---|---|---|---|---|---|
| CNQ | 43.1 | 1 | 20,183 | 17,813 | 7,420.1 | 0.9 | 16.6% |
| DVN | 28.5 | 0.7 | 11,893 | 8,553 | 782.6 | 1.2 | 4.2% |
| PR | 26.2 | 0.6 | 3,150.9 | 3,991.6 | 458.4 | 0.7 | 8.0% |
| SU | 30.5 | 1.7 | 14,680 | 15,796 | 9,229.4 | 0.5 | 16.3% |
Source: Yahoo Finance
CNQ’s net debt/EBITDA of 0.9x is higher than SU’s 0.5x and PR’s 0.7x, but below DVN’s 1.2x, while its current ratio of 1.0x sits between DVN’s 0.7x and SU’s 1.7x. The important connection is that CNQ’s leverage is supported by a 16.6% FCF margin, which is much better than DVN’s 4.2% and PR’s 8.0%; in other words, the balance sheet is not the cleanest in the group, but the cash engine is strong enough to justify it. That is also why CNQ can trade at a fair multiple without needing a discount for financial stress.
Conclusion
I would put my rating as a hold because the key tension is straightforward: CNQ’s cash generation is strong enough to support the current valuation, but not so cheap that I can ignore the market already giving it credit. The latest quarter showed that earnings can reset higher, with revenue at $17.2B and EBITDA at $8B, and that is the main reason I am not bearish. At the same time, the stock already trades at 6.1x EV/EBITDA and 11.9x trailing P/E, so the upside case depends on those earnings levels holding up rather than on multiple expansion.
I would raise my rating more toward a buy if the next quarter keeps revenue above $17B, meaning the Q2 2026 step-up is becoming the new base, and if EBITDA stays above $8B, which would show that cash conversion is still running at the current pace. If that happens, the company’s $7.4B of levered free cash flow would likely remain close to run rate, and the market would have a harder time arguing that the current multiple already discounts the full earnings power. I would move from hold to sell if revenue falls back below $12.4B, which would suggest the Q1 2026 level was the peak rather than a new floor, or if net debt/EBITDA rises above 1.5x, meaning leverage is starting to absorb the cycle instead of cushioning it.
My final view is that the bull case is more likely to show up first, but the stock is already close to fair value, so I do not see enough margin of safety to get more aggressive. I would own it for quality cash flow, not for a large rerating.
What to Watch Next
- Revenue above $17B — would support a move toward Buy.
- EBITDA above $8B — would confirm the higher earnings base.
- Net debt/EBITDA above 1.5x — would weaken the balance-sheet case.
- FCF yield above 8.5% — would make the shares more compelling.
- Current ratio staying at 1.0x or better — would keep liquidity acceptable.
What’s your take? I rated Canadian Natural Resources (CNQ) HOLD above — but the goal here is to get this right, not just to publish an opinion. What would you add to this analysis, or which risk or catalyst do you think I’m under- or over-weighting? Tell me in the comments.
Data sourced from Yahoo Finance and SEC EDGAR. Not investment advice.
Leave a Comment