| Company | Jul 25 | Aug 25 | Sep 25 | Oct 25 | Nov 25 | Dec 25 | Jan 26 | Feb 26 | Mar 26 | Apr 26 | May 26 | Jun 26 | 12-Mo |
|---|---|---|---|---|---|---|---|---|---|---|---|---|---|
| QUBT | -23% | +6% | +17% | -9% | -30% | -12% | -10% | -9% | -19% | +32% | +33% | -19% | -49% |
| IONQ | -7% | +7% | +44% | +1% | -21% | -9% | -11% | -4% | -25% | +57% | +60% | -26% | +24% |
| RGTI | +22% | +12% | +84% | +49% | -42% | -13% | -18% | -4% | -19% | +24% | +46% | -24% | +63% |
| QBTS | +17% | -9% | +58% | +50% | -39% | +15% | -19% | -11% | -23% | +41% | +49% | -20% | +64% |
Source: Yahoo Finance monthly adjusted close.
Executive Summary
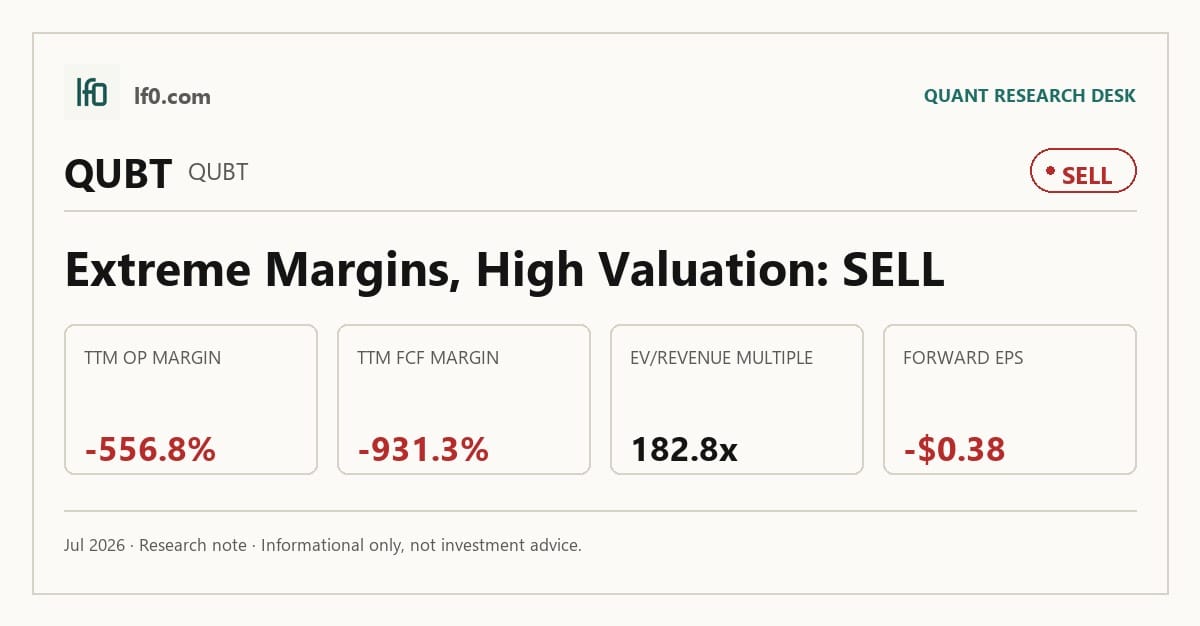
Rating: SELL | QUBT
Measured from adjusted close on 2026-07-24 to 2026-10-22. Sell ratings are correct when the stock falls; Hold is tracked as a +/-10% range. Daily-close data, not intraday. Calls are tracked for 182 days from publication, then frozen as a final record.
I would put my rating as a Sell because QUBT’s latest revenue step-up has not yet translated into durable margins or cash generation, and the stock still prices in a commercialization path that the numbers do not support. Q1 2026 revenue reached $3.7M, but TTM operating margin was -556.8% and TTM free cash flow margin was -931.3%, so the business is still funding growth with cash rather than earnings. In my view, the key question is whether the Luminar Semiconductor acquisition and the AZ Chips Facility can lift revenue above $3M per quarter without widening losses. I would raise my rating more towards a Hold if that happens and gross margin turns positive, because that would show the product layer is finally covering direct costs.
Company Profile
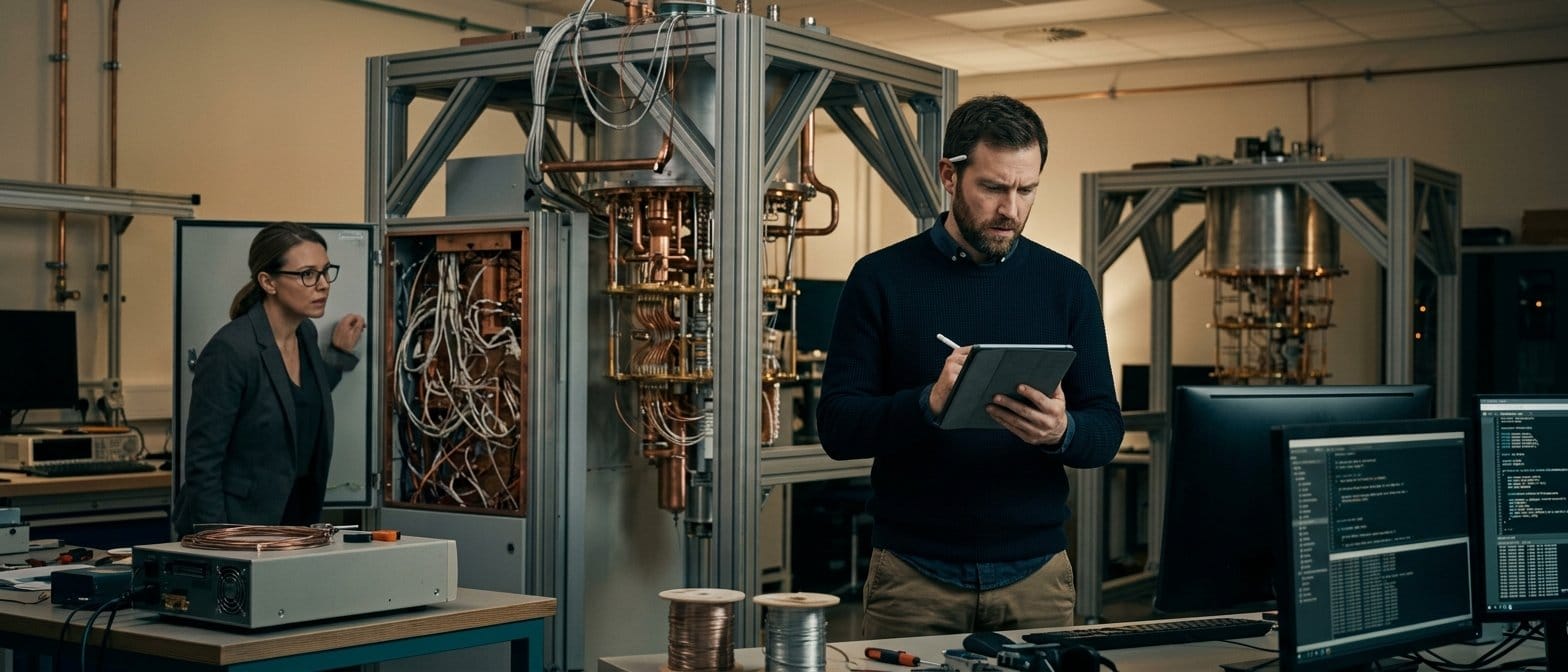
Quantum Computing Inc. is a Delaware-incorporated photonics and quantum technology company based in Hoboken, New Jersey. It develops room-temperature, low-power systems for quantum computing, machine learning, remote sensing, imaging, and cybersecurity. Revenue comes from cloud access, on-premises EQC installations, hardware sales, and foundry services for thin film lithium niobate optical chips. Founded in 2018, the company acquired QPhoton in June 2022, launched Dirac 3 in Q1 2024, completed the AZ Chips Facility in March 2025, and acquired Luminar Semiconductor in February 2026. It listed on Nasdaq under QUBT and had 72 full-time employees and 5 contract staff as of December 31, 2025.
Economic Moat
Business Model
The most defensible part of the model is the room-temperature photonics stack. QUBT’s EQC system is designed to run in a normal server room without cryogenic cooling or specialized shielding, which gives it a practical deployment advantage over superconducting and ion-trap systems that still depend on more demanding infrastructure. I feel that advantage is hard to copy quickly because it rests on integrated photonics, non-linear quantum optics, and thin film lithium niobate optical circuits rather than on software alone. The February 2026 Luminar Semiconductor acquisition added 23 issued patents, 16 pending U.S. patents, and 9 foreign patent publications, while the AZ Chips Facility gives the company a physical path into foundry services and custom chip work. That combination is the core of the moat thesis, but it also makes the business more capital intensive in operations even though financial leverage remains low.
Business & Operating Risks
The main disclosed risk is execution failure across a still-early commercial stack. The company says it has a limited operating history and negative cash flows from operating activities, and the accumulated deficit was $219.2M at December 31, 2025. It also warns that it may need additional capital sooner than planned and that financing could be dilutive, which matters because the current model is still proving whether research can become repeatable revenue. Supply-chain concentration is another real threat: the company sources components from China and other parts of East Asia, so tariffs, export controls, or trade restrictions could interrupt access to key parts with little warning. Commercial adoption and product reliability remain risks as well, since no current quantum computers have reached broad quantum advantage and defects could force redesigns or third-party liability. In my view, these risks do not yet break the moat itself, but they do threaten the company’s ability to monetize it before dilution and burn consume too much of the equity value.
Management Discussion & Analysis
Management is responding to those risks by spending aggressively and by using the balance sheet to extend the runway. The Luminar acquisition, completed for $110M in cash with $11M held in escrow, shows a willingness to buy capability rather than wait for organic scale, and the smaller NuCrypt deal points in the same direction. R&D rose to $20.5M in 2025 from $11.3M in 2024, sales and marketing rose to $3.4M from $1.8M, and G&A rose to $27.2M from $12.9M, so management is clearly building product depth and commercial reach. The problem is that the operating leverage has not shown up yet: gross profit fell to $67K in 2025 from $112K in 2024, and gross margin fell to 10.0% from 30.0%, which tells me the first wave of hardware scaling is still pressuring unit economics. The company ended 2025 with $737.9M of cash and cash equivalents plus $782.5M of short- and long-term investments, so it has time to execute, but that liquidity is also what makes the current burn tolerable rather than solved.
Recent Events
The February 2, 2026 closing of the Luminar Semiconductor acquisition is the most important recent event because it turns the company from a pure development platform into one that is now spending real cash on chip and packaging integration. In my view, that is a test of capital allocation discipline: the deal only strengthens the moat if it shortens the path to commercial products. The March 5, 2026 acquisition of NuCrypt, LLC was smaller, but it reinforces the same strategy of building capability through bolt-ons. The March 2, 2026 full-year 2025 results release and the May 11, 2026 first-quarter 2026 results release were routine disclosures, so the strategic signal from recent 8-Ks is clear: management is still building the stack, and investors now need proof that the stack can convert into revenue.
Financial Analysis
Growth
QUBT — Financial Growth (Quarterly, USD Mil)
| Metric | 2025-03-31 | 2025-06-30 | 2025-09-30 | 2025-12-31 | 2026-03-31 |
|---|---|---|---|---|---|
| REVENUE (USD Mil) | 0 | 0.1 | 0.4 | 0.2 | 3.7 |
| EBIT (USD Mil) | 17 | -36.4 | 2.4 | -1.6 | -3.9 |
| EBITDA (USD Mil) | 18.1 | -35.4 | 3.7 | -0.1 | -1.6 |
| NET INCOME (USD Mil) | 17 | -36.5 | 2.4 | -1.6 | -4 |
| DILUTED EPS | 0.1 | -0.3 | 0 | 0 | 0 |
Source: Yahoo Finance — Quarterly Financial Statements
Revenue jumped to $3.7M in Q1 2026 from $198K in Q4 2025, after $384K in Q3 2025 and $61K in Q2 2025, so the latest quarter was a step change rather than a smooth run rate. Versus $39K in Q1 2025, Q1 2026 revenue was up 9,364.1% year over year, but EBITDA fell to -$1.6M from $18.1M and net income to -$4.1M from $17M, which tells me the top line is improving faster than the earnings base. The jump likely reflects the Luminar acquisition completed on February 2, 2026, so I would treat the growth as real but not yet proven durable enough to justify the current valuation.
Profitability
QUBT — Profitability (TTM)
| Metric | TTM |
|---|---|
| Operating Margin (TTM) | -556.8% |
| Net Margin (TTM) | 0.0% |
| Return on Assets (TTM) | -4.2% |
| Return on Equity (TTM) | -4.4% |
| Gross Margin (TTM) | -15.4% |
| EBITDA Margin (TTM) | -1,336.9% |
Source: Yahoo Finance — Trailing Twelve Months (TTM)
TTM gross margin was -15.4%, operating margin was -556.8%, EBITDA margin was -1,336.9%, and net margin was 0.0%. The gross loss shows the core product layer is still underwater, while the much deeper operating and EBITDA losses show overhead is far too large for the current revenue base. TTM return on assets was -4.3% and return on equity was -4.4%, so capital is not yet earning a return and leverage is not the main driver of the weak returns. I would watch for gross margin to turn positive first, because that would show the product itself can cover direct costs before scale benefits appear in operating profit.
Valuation
QUBT — Valuation Multiples
| Metric | Value |
|---|---|
| Market Cap (USD Mil) | 1,773 |
| Enterprise Value (USD Mil) | 792 |
| Trailing P/E | — |
| Forward P/E | -20.7 |
| Price/Sales (TTM) | 409 |
| Price/Book (mrq) | 1.1 |
| EV/Revenue | 182.8 |
| EV/EBITDA | -13.7 |
| Beta (5Y Monthly) | 3.78 |
| FCF Yield % (TTM) | -2.3% |
| Forward EPS (USD) | -0.4 |
| Analyst Target Price – Low (USD) | 10 |
| Analyst Target Price – Mean (USD) | 18.3 |
| Analyst Target Price – High (USD) | 30 |
| # Analyst Opinions | 6 |
Source: Yahoo Finance
QUBT screens as an extreme multiple case, not a normal earnings valuation. Trailing P/E is unavailable, forward P/E is -20.7x, EV/EBITDA is -13.7x, and EV/Revenue is 182.8x. Those negatives mainly tell me the market is paying for a future inflection that has not shown up in the latest twelve months. Price/Sales is 409x, while Price/Book is 1.1x and FCF yield is -2.3%, so the stock is expensive on sales and still cash consuming even though the balance sheet carries substantial liquidity. On the analysis here, I would put fair value in a wide range of $10–$30, which is the same band as the analyst target range and therefore tells me the market is already debating a very broad set of outcomes. That range sits inside the $10–$30 consensus target range from 6 analyst opinions, so I do not see a strong disagreement with Street expectations; the issue is not the target spread, it is whether the company can earn its way into it. Forward EPS is -$0.4, versus -$1.1 for IONQ, -$0.2 for RGTI, and -$0.4 for QBTS, so QUBT is not obviously cheaper than peers on earnings power even though its revenue base is smaller. In my view, the market is paying for optionality, not demonstrated cash generation.
Leverage
QUBT — Leverage & Coverage (Quarterly)
| Metric | Value |
|---|---|
| Total Debt/Equity % (mrq) | 0.3 |
| Current Ratio (mrq) | 66.7 |
| Total Debt (mrq, USD Mil) | 5.4 |
| Operating Cash Flow (TTM, USD Mil) | -35.3 |
| Levered Free Cash Flow (TTM, USD Mil) | -40.4 |
| Net Debt/EBITDA (TTM) | 16.9 |
| FCF Margin % (TTM) | -931.3% |
Source: Yahoo Finance — Quarterly Financial Statements
QUBT’s balance sheet is liquid, but cash generation is deeply negative. Total debt/equity was 0.3x, current ratio was 66.7x, and total debt was $5.5M, so near-term solvency is not the issue. The problem is cash burn: operating cash flow was -$35.3M TTM, levered free cash flow was -$40.4M, net debt/EBITDA was 16.9x, and FCF margin was -931.3%. That means the company is funding operations and investment with cash on hand rather than internally generated cash, and the cushion will erode unless operating cash flow improves. The balance sheet gives room to absorb a short downturn, but it does not yet make the business self-funding.
Insider Activity
The insider transaction record is one-sided: 6 open-market sales and 0 open-market purchases across the recent Form 4 sample. The largest sale was Huang Yuping’s 500,000-share transaction on 2025-05-19, followed by Christopher Bruce Roberts’ two sales in March 2026. I read that as weak insider alignment with shareholders, even if the sample is limited.
Comparable Analysis
Growth
| Company | Revenue TTM (USD Mil) | Revenue Growth YoY % | EBITDA TTM (USD Mil) | Diluted EPS TTM |
|---|---|---|---|---|
| QUBT | 4.3 | 9,364.1% | -57.9 | -0.3 |
| IONQ | 187.1 | 754.7% | -662.4 | 0.4 |
| RGTI | 10 | 198.9% | -80 | -0.9 |
| QBTS | 12.4 | -80.9% | -138.8 | -1.1 |
Source: Yahoo Finance
QUBT’s TTM revenue was $4.3M, up 9,364.1% year over year, versus IONQ at $187.1M and 754.7%, RGTI at $10M and 198.9%, and QBTS at $12.4M and -80.9%. The percentage growth is the best in the group, but it is coming off the smallest base, so I would not confuse speed with scale.
Valuation
| Company | Forward P/E | EV/Revenue | EV/EBITDA | Price/Sales (TTM) | Price/Book (mrq) | Market Cap (USD Mil) | Enterprise Value (USD Mil) | Beta (5Y Monthly) | Forward EPS | Analyst Target Price – Low | Analyst Target Price – Mean | Analyst Target Price – High | # Analyst Opinions |
|---|---|---|---|---|---|---|---|---|---|---|---|---|---|
| QUBT | -20.7 | 182.8 | -13.7 | 409 | 1.1 | 1,773 | 792 | 3.78 | -0.4 | 10 | 18.3 | 30 | 6 |
| IONQ | -31 | 57.3 | -16.2 | 68 | 2.6 | 12,717 | 10,728 | 3.23 | -1.1 | 44.8 | 69.1 | 100 | 12 |
| RGTI | -73.8 | 451.7 | -56.5 | 492.8 | 8.5 | 4,936 | 4,525 | 1.96 | -0.2 | 20 | 30.1 | 40 | 11 |
| QBTS | -43.2 | 464.8 | -41.7 | 509 | 5.6 | 6,335 | 5,784 | 2.10 | -0.4 | 22 | 37.6 | 45 | 14 |
Source: Yahoo Finance
QUBT trades at 182.8x EV/Revenue and 409x Price/Sales, while IONQ is at 57.3x and 68x, RGTI at 451.7x and 492.8x, and QBTS at 464.8x and 509x. On a peer-multiple basis, QUBT looks cheaper than RGTI and QBTS but far richer than IONQ, and that gap matters because QUBT’s growth is not yet matched by a cleaner earnings or cash-flow profile. Its 1-year total return was -55.0%, so a $1 investment a year ago is worth $0.45 today, versus $1.24 for IONQ, $0.92 for RGTI, and $0.84 for QBTS. I think the market is paying for a commercialization path that still needs to show up in margins, not just in revenue growth.
Profitability
| Company | Operating Margin (TTM) | Net Margin (TTM) | Return on Equity (TTM) | Gross Margin (TTM) | EBITDA Margin (TTM) |
|---|---|---|---|---|---|
| QUBT | -556.8% | 0.0% | -4.4% | -15.4% | -1,336.9% |
| IONQ | -401.8% | 174.9% | 11.3% | 36.1% | -354.0% |
| RGTI | -589.8% | 0.0% | -57.1% | 29.9% | -799.0% |
| QBTS | -1,914.9% | 0.0% | -55.3% | 66.3% | -1,115.5% |
Source: Yahoo Finance
QUBT’s operating margin is -556.8%, gross margin is -15.4%, and EBITDA margin is -1,336.9%, versus IONQ at -401.8%, 36.1%, and -354.0%, RGTI at -589.8%, 29.9%, and -799.0%, and QBTS at -1,914.9%, 66.3%, and -1,115.5%. The gross-margin gap versus IONQ and QBTS points to cost-of-revenue pressure, while the operating-margin gap shows overhead is still too large for the current revenue base. QUBT’s return on equity was -4.4% and return on assets was -4.3%, which is weak but still less distorted than the much deeper negative returns at some peers.
Leverage
| Company | Total Debt/Equity % (mrq) | Current Ratio (mrq) | Total Debt (mrq, USD Mil) | Operating Cash Flow TTM (USD Mil) | Net Debt/EBITDA (TTM) | FCF Margin % (TTM) |
|---|---|---|---|---|---|---|
| QUBT | 0.3 | 66.7 | 5.5 | -35.3 | 16.9 | -931.3% |
| IONQ | 0.6 | 14.1 | 30.4 | -401.2 | 3 | -48.8% |
| RGTI | 1.2 | 7 | 6.8 | -61.1 | 5.1 | -62.0% |
| QBTS | 4.2 | 21.4 | 46.8 | -97.7 | 3.9 | -510.3% |
Source: Yahoo Finance
QUBT’s total debt/equity was 0.3x and current ratio was 66.7x, which is far more liquid than IONQ at 0.6x and 14.1x, RGTI at 1.2x and 7x, and QBTS at 4.2x and 21.4x. That liquidity helps explain why QUBT’s valuation can stay elevated despite negative cash flow, but it is a cushion rather than a structural financing advantage because operating cash flow was still -$35.3M and free cash flow was -$40.4M. In other words, the balance sheet is buying time, not proving the model.
Conclusion
I would put my rating as a Sell because the company’s strongest strategic asset, its room-temperature photonics stack, is still not converting into durable cash generation. Q1 2026 revenue of $3.7M shows the business can step up, but TTM operating margin of -556.8% and TTM free cash flow margin of -931.3% tell me the economics are still far from self-funding. The Luminar acquisition and the AZ Chips Facility could improve the product roadmap, but they also raise the burden of proof: I need to see those assets lift revenue above $3M per quarter without widening losses before I would become more constructive.
I would raise my rating more towards a Hold if revenue stays above $3M in the next two quarters and gross margin turns positive, because that would show the Q1 2026 jump was not just an acquisition effect and that the product layer is covering direct costs. I would also want operating cash flow to improve materially from the current -$35.3M TTM run rate, since that would show the company is moving toward self-funding rather than leaning on its cash balance.
I would move from Sell to Strong Sell if quarterly revenue falls back below $2M, because that would suggest the Q1 step-up was not repeatable and would leave the current 182.8x EV/Revenue multiple even harder to defend. I would also turn more negative if insider selling continues at the current pace and operating cash flow stays deeply negative, because that combination would point to a business that is burning cash while management is still reducing exposure.
Weighing both sides, I think the bear case is more likely to show up first because the company still has to prove that the Luminar acquisition and the AZ Chips Facility can translate into repeatable customer demand. The cash cushion buys time, but it does not change the fact that the latest numbers still look like a development platform, not a scaled earnings engine.
What’s your take? I rated Quantum Computing (QUBT) SELL above — but the goal here is to get this right, not just to publish an opinion. What would you add to this analysis, or which risk or catalyst do you think I’m under- or over-weighting? Tell me in the comments.
Sources
- SEC 10-K Annual Report — filed 2026-03-02
- SEC 8-K Filing (2026-05-18)
- SEC 8-K Filing (2026-05-11)
- SEC 8-K Filing (2026-03-05)
- SEC 8-K Filing (2026-03-02)
- SEC 8-K Filing (2026-02-03)
- SEC 8-K Filing (2026-01-12)
- SEC Form 4 Insider Transaction (2026-06-01)
- SEC Form 4 Insider Transaction (2026-06-01)
- SEC Form 4 Insider Transaction (2026-06-01)
- SEC 10-K Annual Report — FY2026
- SEC 10-K Annual Report — FY2025
- SEC 10-K Annual Report — FY2024
- SEC 10-K Annual Report — FY2023
- SEC 10-K Annual Report — FY2022
Data sourced from Yahoo Finance and SEC EDGAR. Not investment advice.
Leave a Comment