
| Company | Sep 25 | Oct 25 | Nov 25 | Dec 25 | Jan 26 | Feb 26 | Mar 26 | Apr 26 | May 26 | Jun 26 | Jul 26 | Aug 26 | 12-Mo |
|---|---|---|---|---|---|---|---|---|---|---|---|---|---|
| NHC | +8% | -2% | +14% | +1% | +4% | +14% | -2% | +9% | +6% | +15% | +7% | -4% | +94% |
| BKD | +10% | +9% | +20% | -3% | +39% | +2% | -11% | +5% | -10% | +25% | -9% | -19% | +53% |
| OPCH | -3% | -6% | +19% | +2% | +7% | -5% | -17% | -24% | +3% | +0% | +10% | +2% | -18% |
Source: Yahoo Finance monthly adjusted close.
Quick Thesis
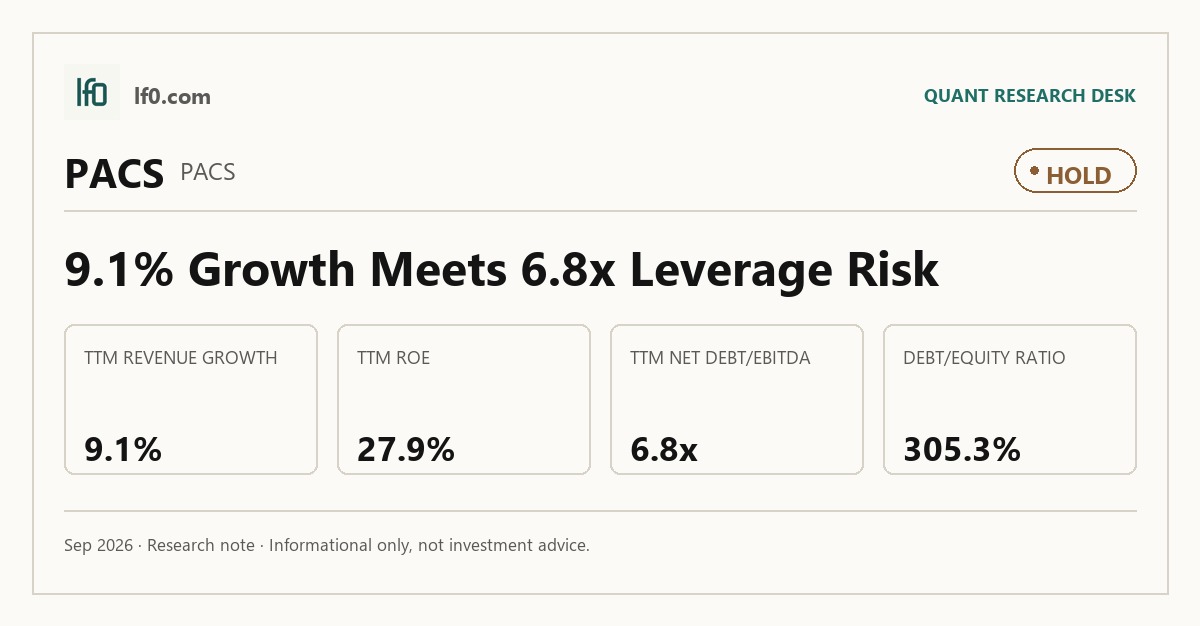
- Rated Hold — growth is real, but 6.8x net debt/EBITDA limits upside.
- TTM revenue growth was 9.1%, with Q2 2026 revenue at $1.4B.
- The main risk is leverage: $3.4B of debt and a 0.9 current ratio.
- Valuation is fair to slightly rich at 20.5x EV/EBITDA.
- I would turn more constructive if net debt/EBITDA falls below 6.0x, meaning leverage is easing.
Executive Summary
Rating: HOLD | PACS
Measured from adjusted close on 2026-10-12 to 2026-10-12. Sell ratings are correct when the stock falls; Hold is tracked as a +/-10% range. Daily-close data, not intraday. Calls are tracked for 182 days from publication, then frozen as a final record.
I would put my rating as a Hold because PACS is still compounding revenue and cash flow, but the balance sheet is too stretched for me to call the equity cheap. The company has a workable operating model, and Q2 2026 revenue of $1.4B and EBITDA of $132M show the core business is still expanding, yet 6.8x net debt/EBITDA and a 0.9 current ratio leave little room for a misstep. In my view, the key question is not whether PACS can grow, but whether it can keep converting that growth into cleaner margins before leverage becomes a harder constraint. I would raise my rating more towards a Buy if net debt/EBITDA falls below 6.0x, meaning the company is starting to de-risk the capital structure rather than simply rolling it forward.
Company Profile
PACS Group Inc. operates post-acute care facilities, with a focus on skilled nursing, assisted living, and independent living communities. It serves patients through a mix of Medicare, Medicaid, managed care, and private pay, and it supports those facilities with a centralized services platform that handles accounting, payroll, compliance, technology, and other back-office functions. The company’s model is built around acquiring underperforming facilities, improving operations, and moving them into a higher-acuity, higher-occupancy profile over time. As of December 31, 2025, PACS operated 321 facilities across 17 states and served more than 31,700 patients daily.
Economic Moat
Business Model
PACS’s moat comes from a locally led, centrally supported operating model that combines facility-level autonomy with a shared services layer. In my view, that is hard to copy quickly because a competitor would need to rebuild both the local management bench and the centralized infrastructure at the same time, while also proving it can run a regulated skilled nursing platform without losing control. The scale matters: 321 facilities, 21 regional vice presidents, and 47,455 employees as of December 31, 2025 give the company enough breadth to spread best practices and absorb acquisitions. The operating data back that up, with mature facilities posting a 4.4 Quality Measures Star rating versus a 3.5 industry average and 95% occupancy versus 79%, which is consistent with a model that is creating real operating leverage rather than just adding volume.
Business & Operating Risks
The main disclosed risk is reimbursement pressure, especially where Medicaid rates lag cost inflation or patient acuity shifts lower. PACS says Medicaid accounted for 40.5% of total revenue in 2025 and Medicare for 33.7%, so the business is exposed to payor mix and state funding decisions. Staffing is the other major pressure point: the company has flagged nurse shortages, higher third-party staffing costs, and staffing-rule changes, all of which can hit margins quickly in a labor-intensive care model. PACS also faces active legal and regulatory scrutiny, including government investigations and internal-control weaknesses tied to prior reporting issues. Taken together, these risks do not break the moat, but they do threaten the operating discipline that the moat depends on, especially if reimbursement and staffing costs move against the company at the same time.
Management Discussion & Analysis
Management is still leaning into acquisitions and integration rather than balance-sheet repair. Cash paid for acquisitions was 143.8M in FY2025, and capital expenditures rose to 105.4M, so capital is still being directed toward growth. That said, the company also disclosed forbearance agreements in 2025 and a later credit amendment, which tells me the financing structure remains tight even as the operating model scales. The key point is that management is responding to the growth opportunity, but not yet to the leverage risk with the same urgency. The acquisition platform is still the strategic priority, while the balance sheet remains the constraint.
Recent Events
The most important recent development is the CFO change: PACS appointed Carey Hendrickson as Chief Financial Officer on April 24, 2026, and Mark Hancock is retiring from executive duties. I read that as a constructive step because a permanent finance lead should improve discipline while the company is still digesting recent growth and control issues. PACS also added Patrick H. Conway, M.D., M.Sc. to the board on March 4, 2026, which strengthens oversight in a regulated care business where reimbursement, staffing, and quality execution matter. These events do not change the operating model, but they do suggest the company is trying to tighten governance around it.
Financial Analysis
Growth
PACS — Financial Growth (Quarterly, USD Mil)
| Metric | 2025-03-31 | 2025-06-30 | 2025-09-30 | 2025-12-31 | 2026-03-31 | 2026-06-30 |
|---|---|---|---|---|---|---|
| REVENUE (USD Mil) | — | 1,309.2 | 1,344.6 | 1,358 | 1,420.5 | 1,428 |
| EBIT (USD Mil) | — | 83 | 84.8 | 95.4 | 120.2 | 111.9 |
| EBITDA (USD Mil) | — | 96.1 | 99.2 | 110.8 | 138.2 | 132 |
| NET INCOME (USD Mil) | — | 51 | 52.4 | 59.7 | 80.7 | 76.4 |
| DILUTED EPS | 0.2 | 0.3 | 0.3 | — | 0.5 | 0.5 |
Source: Yahoo Finance — Quarterly Financial Statements
Revenue rose to $1.4B in Q2 2026 from $1.3B a year earlier, a 9.0% increase, and EBITDA climbed to $132M from $96.1M, which is a 37.4% increase. That spread tells me the business is still getting operating leverage from its facility base, not just adding low-quality revenue. EPS was $0.47 in Q2 2026 versus $0.31 a year earlier, although it slipped from $0.50 in Q1 2026, so the trend is positive but not perfectly linear. The growth profile supports the moat, but it also shows why leverage matters: PACS needs earnings expansion to outrun the debt load, not just to justify it.
Profitability
PACS — Profitability (TTM)
| Metric | TTM |
|---|---|
| Operating Margin (TTM) | 7.7% |
| Net Margin (TTM) | 4.8% |
| Return on Assets (TTM) | 4.6% |
| Return on Equity (TTM) | 27.9% |
| Gross Margin (TTM) | 17.3% |
| EBITDA Margin (TTM) | 8.6% |
Source: Yahoo Finance — Trailing Twelve Months (TTM)
TTM operating margin was 7.7%, gross margin was 17.3%, and EBITDA margin was 8.6%, so PACS is profitable but still early in the margin build-out. Net margin of 4.9% confirms that the company is earning money on a GAAP basis, yet the gap between gross margin and operating margin shows overhead and operating costs are still absorbing a meaningful share of revenue. Return on assets was 4.6% and return on equity was 27.9%, which tells me leverage is amplifying equity returns more than asset productivity alone would suggest. That is acceptable for now, but it also means the margin story and the leverage story have to improve together for the thesis to work cleanly.
Valuation
PACS — Valuation Multiples
| Metric | Value |
|---|---|
| Trailing P/E | 24.3 |
| Forward P/E | 15.2 |
| EV/Revenue | 1.8 |
| EV/EBITDA | 20.5 |
| Analyst Target Price – Low (USD) | 57 |
| Analyst Target Price – Mean (USD) | 59 |
| Analyst Target Price – High (USD) | 62 |
Source: Yahoo Finance
PACS trades at 20.5x EV/EBITDA, 15.2x forward P/E, and 1.8x EV/revenue, which is not cheap for a business still carrying 6.8x net debt/EBITDA. On the analysis here, I would put fair value in a range of about $38–$50 per share, with the lower end reflecting the leverage burden and the upper end assuming margin expansion continues without a reset in growth. That range sits below the $57–$62 analyst target band, and I think the gap reflects my heavier weighting on balance-sheet risk than the consensus appears to be giving it. Forward EPS of 2.7 implies the market is already paying for a meaningful step-up in earnings, so the stock needs execution to keep pace with the multiple. Relative to peers, that makes PACS look fair to slightly rich rather than obviously mispriced.
Leverage
PACS — Leverage & Coverage (Quarterly)
| Metric | Value |
|---|---|
| Total Debt/Equity % (mrq) | 305.3 |
| Current Ratio (mrq) | 0.9 |
| Total Debt (mrq, USD Mil) | 3,404.9 |
| Operating Cash Flow (TTM, USD Mil) | 573.2 |
| Levered Free Cash Flow (TTM, USD Mil) | 378.3 |
| Net Debt/EBITDA (TTM) | 6.8 |
| FCF Margin % (TTM) | 6.8% |
Source: Yahoo Finance — Quarterly Financial Statements
PACS carries $3.4B of total debt and a 305.3% debt-to-equity ratio, while the current ratio is only 0.9. TTM operating cash flow was $573.2M and levered free cash flow was $378.3M, so the company is generating cash, but not with enough cushion to make the balance sheet feel self-healing. Net debt/EBITDA of 6.8x is the clearest warning sign, because it leaves limited room for a slowdown before refinancing pressure becomes more serious. FCF margin of 6.8% is positive, but it is not strong enough on its own to offset the leverage. In my view, this is the main reason the stock stays at Hold rather than moving higher.
Insider Activity
The insider tape is negative. There were 5 open-market sales and no open-market purchases in the period shown, and the activity was concentrated in Mitchell John Todd, which makes the signal narrower but still one-sided. I would not overread a single executive’s selling, but it does not help the case when the balance sheet is already stretched. It is a modest negative, not the core thesis.
Comparable Analysis
Growth
| Company | Revenue TTM (USD Mil) | Revenue Growth YoY % | EBITDA TTM (USD Mil) | Diluted EPS TTM |
|---|---|---|---|---|
| PACS | 5,551 | 9.1% | 478.3 | 1.7 |
| NHC | 1,559 | 8.8% | 190.4 | 8.9 |
| ENSG | 5,486.7 | 17.3% | 582.7 | 6.5 |
| BKD | 2,932.3 | -8.9% | 464.9 | -0.6 |
| ACHC | 3,367.7 | -0.4% | 534.9 | -12.4 |
| OPCH | 5,693.5 | 1.9% | 405.1 | 1.3 |
Source: Yahoo Finance
PACS’s TTM revenue growth of 9.1% is ahead of NHC at 8.8%, OPCH at 1.9%, BKD at -8.9%, and ACHC at -0.4%, though ENSG is still faster at 17.3%. That puts PACS in the upper half of the group on growth, which supports a premium to the slower operators but not to the best grower. The key point is that PACS is growing fast enough to matter, but not so fast that leverage becomes irrelevant.
Valuation
| Company | Trailing P/E | Forward P/E | EV/Revenue | EV/EBITDA | Forward EPS | Analyst Target Price – Low | Analyst Target Price – Mean | Analyst Target Price – High | # Analyst Opinions |
|---|---|---|---|---|---|---|---|---|---|
| PACS | 24.3 | 15.2 | 1.8 | 20.5 | 2.7 | 57 | 59 | 62 | 6 |
| NHC | 25.5 | 528.7 | 2.2 | 17.8 | 0.4 | — | — | — | — |
| ENSG | 27.2 | 20.5 | 2.2 | 20.7 | 8.6 | 207 | 220 | 230 | 5 |
| BKD | — | 92.6 | 2.6 | 16.7 | 0.1 | 17 | 19.2 | 23 | 6 |
| ACHC | — | 15.2 | 1.6 | 9.8 | 1.8 | 17 | 33.8 | 41 | 14 |
| OPCH | 17.5 | 11.1 | 0.8 | 11.2 | 2.1 | 23 | 28.6 | 39 | 12 |
Source: Yahoo Finance
PACS trades at 20.5x EV/EBITDA and 15.2x forward P/E, which is richer than OPCH on earnings and well above BKD on a forward basis, but not as expensive as ENSG on forward P/E. The stock’s 5.8% FCF yield is better than ENSG’s 2.8% and NHC’s 1.8%, yet the yield is still being asked to carry a 6.8x net debt/EBITDA balance sheet, so I do not think the market is offering a clear discount for the leverage risk. On a peer-multiple basis, the implied value range brackets the current price, which is why I see the shares as fairly valued rather than obviously cheap. The market is paying for growth, but not giving PACS a safety premium.
Profitability
| Company | Operating Margin (TTM) | Net Margin (TTM) | Return on Assets (TTM) | Return on Equity (TTM) | Gross Margin (TTM) | EBITDA Margin (TTM) |
|---|---|---|---|---|---|---|
| PACS | 7.7% | 4.8% | 4.6% | 27.9% | 17.3% | 8.6% |
| NHC | 12.0% | 9.0% | 5.8% | 13.3% | 39.5% | 12.2% |
| ENSG | 9.0% | 6.9% | 5.5% | 17.0% | 16.6% | 10.6% |
| BKD | 6.8% | -4.7% | 1.5% | -349.6% | 28.3% | 15.8% |
| ACHC | 10.1% | -33.4% | 3.6% | -41.4% | 41.1% | 15.9% |
| OPCH | 5.9% | 3.7% | 6.2% | 16.0% | 19.1% | 7.1% |
Source: Yahoo Finance
PACS’s 7.7% operating margin and 8.6% EBITDA margin are mid-pack, below NHC and ENSG on operating margin and below NHC on EBITDA margin. Its 27.9% ROE is strong, but ROA of 4.6% is more ordinary, which tells me leverage is doing part of the work. That is important because the company’s valuation is being supported by returns that are not purely driven by asset efficiency. In other words, the profitability profile is good enough to justify the business model, but not strong enough to neutralize the leverage concern.
Leverage
| Company | Total Debt/Equity % (mrq) | Current Ratio (mrq) | Total Debt (mrq, USD Mil) | Operating Cash Flow TTM (USD Mil) | Free Cash Flow TTM (USD Mil) | Net Debt/EBITDA (TTM) | FCF Margin % (TTM) |
|---|---|---|---|---|---|---|---|
| PACS | 305.3 | 0.9 | 3,404.9 | 573.2 | 378.3 | 6.8 | 6.8% |
| NHC | 2.8 | 1.9 | 31.4 | 188.8 | 63.2 | -0.9 | 4.0% |
| ENSG | 92 | 1.2 | 2,250.3 | 608.4 | 280.6 | 3.3 | 5.1% |
| BKD | — | 1.1 | 5,490.9 | 223.9 | 23 | 11 | 0.8% |
| ACHC | 118.1 | 1.6 | 2,587.6 | 210.5 | -105 | 4.5 | -3.1% |
| OPCH | 100.6 | 1.5 | 1,268.1 | 346.8 | 256.1 | 2.6 | 4.5% |
Source: Yahoo Finance
PACS is more levered than most peers, with 305.3% debt-to-equity and 6.8x net debt/EBITDA, versus 92.0% and 3.3x for ENSG and 100.6% and 2.6x for OPCH. NHC is effectively net cash at -0.9x, while BKD is more stretched at 11.0x, so PACS sits in the riskier part of the group without being the most stressed name. The peer comparison matters because PACS’s growth is not enough on its own to justify ignoring the balance sheet. The company needs the operating model to keep compounding faster than leverage can bite.
Conclusion
I would put my rating as a Hold because PACS has a real operating engine, but the leverage profile still dominates the equity story. Revenue growth of 9.1% TTM and Q2 2026 EBITDA growth of 37.4% show that the model is working, and that is the main reason I am not more negative. The problem is that 6.8x net debt/EBITDA and a 0.9 current ratio leave too little margin for error if reimbursement, staffing, or integration costs move the wrong way. In my view, the stock is not broken, but it is not yet clean enough to deserve a more aggressive rating.
I would raise my rating more towards a Buy if PACS can push TTM operating margin above 9.0%, because that would show the acquisition platform is turning revenue into cash at a better rate and would likely add roughly $60M to $70M of annual EBITDA on the current revenue base. If that improvement comes with net debt/EBITDA below 6.0x, meaning leverage is actually easing rather than just being rolled, I would have more confidence that the earnings step-up is durable.
I would move from Hold to Sell if revenue growth falls below 5.0% for two straight quarters, because that would suggest the acquisition engine is slowing before the balance sheet has repaired itself. I would also turn more cautious if net debt/EBITDA rises above 7.0x, since that would mean the company is moving farther from refinancing comfort while still carrying a 305.3% debt-to-equity ratio and a 0.9 current ratio.
The tension I am watching is simple: the operating model is strong enough to support the stock, but not yet strong enough to overpower the debt. Until margin expansion and deleveraging show up together, I think the right call is to stay patient and watch the next few quarters closely.
What to Watch Next
- TTM operating margin above 9.0% — would support a move toward Buy.
- Net debt/EBITDA below 6.0x — would show leverage is easing.
- Revenue growth below 5.0% for two straight quarters — would support a move toward Sell.
- Net debt/EBITDA above 7.0x — would raise refinancing risk further.
- Q2/Q3 margin expansion with stable reimbursement — would confirm the operating model is still compounding.
What’s your take? I rated PACS Group (PACS) HOLD above — but the goal here is to get this right, not just to publish an opinion. What would you add to this analysis, or which risk or catalyst do you think I’m under- or over-weighting? Tell me in the comments.
Sources
- SEC 10-K Annual Report — filed 2026-02-27
- SEC 8-K Filing (2026-05-11)
- SEC 8-K Filing (2026-04-27)
- SEC 8-K Filing (2026-03-05)
- SEC 8-K Filing (2026-02-26)
- SEC Form 4 Insider Transaction (2026-05-19)
- SEC Form 4 Insider Transaction (2026-05-15)
- SEC Form 4 Insider Transaction (2026-04-17)
Data sourced from Yahoo Finance and SEC EDGAR. Not investment advice.
Leave a Comment