
| Company | Oct 25 | Nov 25 | Dec 25 | Jan 26 | Feb 26 | Mar 26 | Apr 26 | May 26 | Jun 26 | Jul 26 | Aug 26 | Sep 26 | 12-Mo |
|---|---|---|---|---|---|---|---|---|---|---|---|---|---|
| KMB | -4% | -9% | -6% | -1% | +11% | -12% | +2% | -1% | +14% | -0% | -1% | -9% | -18% |
| CL | -3% | +4% | -2% | +15% | +10% | -14% | +1% | +6% | +2% | +0% | -2% | -5% | +9% |
| CLX | -8% | -4% | -7% | +13% | +13% | -19% | -6% | -7% | +6% | +0% | +3% | -17% | -31% |
| CHD | +0% | -3% | -2% | +15% | +9% | -11% | +4% | -1% | +1% | +2% | +1% | -6% | +9% |
| KVUE | -11% | +22% | -1% | +1% | +11% | -10% | +2% | -0% | +11% | +1% | -1% | -5% | +15% |
Source: Yahoo Finance monthly adjusted close.
Quick Thesis
- Rated hold because Kenvue adds leverage and dilution before savings are proven.
- Strongest support is $941.1M of levered free cash flow TTM.
- Biggest risk is $6.5B of debt with a 0.9 current ratio.
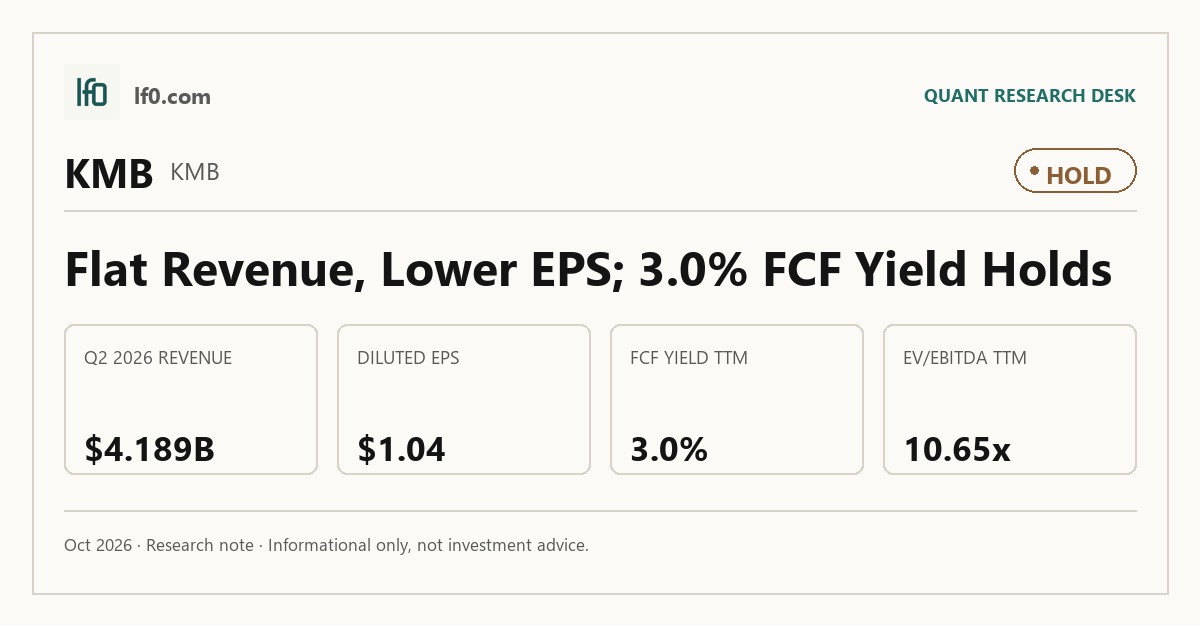
- Valuation looks fair at 10.7x EV/EBITDA and 3.0% FCF yield.
- I would turn more constructive if operating margin expands and merger synergies show up.
Executive Summary
Rating: HOLD | KMB
We’ll begin tracking this call’s performance since publication once sufficient adjusted-close data is available.
I would put my rating as a Hold because Kimberly-Clark’s forward multiple already prices in a steady branded-essentials business, while the company is still only growing revenue 0.6% TTM and carrying a 5.7% TTM FCF margin. The brand portfolio and No. 1 or No. 2 share positions in about 70 countries support resilience, but they do not yet justify a clear re-rating when gross margin is still 37.6% and current ratio is 0.9.
I would raise my rating more towards a Buy if the Kenvue transaction closes on time and the combined company shows that the expected $3B of pre-tax productivity savings is turning into a real margin step-up. On the current $16.6B revenue base, even a 100 basis point lift in operating margin would add about $166M of annual operating profit, which would matter for deleveraging and for proving that the deal is creating more than scale. I would move from Hold to Sell if the merger slips past the November 2, 2026 outside date or if net debt/EBITDA moves materially above 2.0x, meaning leverage is no longer comfortably covered by cash generation.
Company Profile
Kimberly-Clark Corporation was founded in 1872 and incorporated in Delaware in 1928. It makes fiber-based and absorbency products across five daily-need categories: Baby & Child Care, Adult Care, Feminine Care, Family Care, and Professional. Its brands include Huggies, Kleenex, Scott, Kotex, Cottonelle, Poise, Depend, and WypAll.
Revenue comes from household products sold through retailers and e-commerce channels, plus professional products sold to distributors and end users in manufacturing, lodging, offices, food service, and public facilities. The company sells in more than 175 countries and territories, and its brands hold No. 1 or No. 2 share in about 70 countries. As of December 31, 2025, it had about 36,000 employees, with roughly 35% in North America and the rest across about 55 countries. Kimberly-Clark is listed on the NYSE under KMB.
Economic Moat
Business Model
The brand portfolio and category leadership are the most defensible part of Kimberly-Clark’s model. According to its 2025 10-K, the company’s brands hold No. 1 or No. 2 share positions in approximately 70 countries across five daily-need categories. I feel that is hard for a competitor to copy quickly because those positions sit on decades of consumer trust, shelf space, and distribution relationships, not on a single product launch.
The portfolio is also broad enough to reduce dependence on any one category, with Huggies, Kleenex, Scott, Kotex, Cottonelle, Poise, Depend, Andrex, Pull-Ups, GoodNites, Intimus, Plenitud, Sweety, Softex, Viva, and WypAll spanning baby, adult, feminine, family, and professional care. Patents, trademarks, and advanced technologies in fibers, nonwovens, and absorbency reinforce that edge. That matters for the moat because the 19.0% operating margin shows the business still monetizes those brands, even if the gross margin gap versus peers suggests the advantage is not absolute.
Business & Operating Risks
The most material disclosed risk is the Kenvue merger overhang. Kimberly-Clark expects to issue about 280 million shares of common stock, and the combined company will carry substantially greater indebtedness than the standalone business, which can dilute EPS and reduce financial flexibility before any synergy is realized. The first merger must close by November 2, 2026, subject to regulatory approvals and the absence of legal restraint, and either side can terminate if those conditions are not met.
Input-cost inflation is the second major risk. The filing flags significant increases in raw materials, energy, transportation, and other necessary services, including cellulose fiber, kraft pulp, fluff pulp, and petroleum-derived inputs used in diapers, feminine care, incontinence care, and wipes. If selling prices trail those costs, the margin pressure flows quickly through the portfolio because these are core categories, not niche lines.
Cybersecurity, privacy, and ERP migration are the third cluster. The company is upgrading its SAP ERP system, which raises the risk of security breaches, system failures, and disruptions. In my view, these risks do not threaten the brand moat itself, but the merger and cost inflation can erode the cash conversion that supports it if execution slips.
Management Discussion & Analysis
Management is signaling a capital allocation pivot toward portfolio reshaping rather than balance-sheet repair. The pending Kenvue acquisition will require about $6.7B of merger consideration, funded with cash on hand, new debt, and proceeds from the IFP transaction, while the IFP transaction should bring in about $1.7B for a 51% joint-venture stake expected to close in mid-2026. The message is clear: management is willing to add leverage to buy scale in consumer health, not to de-risk the balance sheet.
The 2024 Transformation Initiative is the other major signal. It is expected to deliver $3B of pre-tax gross productivity savings and $200M of SG&A savings, but the company also expects about $1.5B of pre-tax costs and has already taken $808M of cumulative pre-tax charges through December 31, 2025. The operating data partly support the cost story, since adjusted operating profit was $2.7B in 2025, but reported operating profit still fell 12.9% to $2.4B, and adjusted gross margin slipped to 37.3%, so the margin benefit is still ahead of the cash burden.
The divestiture and joint-venture work is addressing portfolio concentration, but the Kenvue process remains unresolved as of the filing date. That is the key management response to the risks above: it is active, but it is not yet complete.
Recent Events
The most significant development is the Kenvue merger moving from announcement to shareholder approval. On January 29, 2026, Kimberly-Clark stockholders approved the share issuance needed for the transaction, which clears a major governance hurdle and strengthens the scale and category breadth thesis.
I also view the January 27, 2026 and April 28, 2026 earnings releases as routine disclosures rather than strategic inflection points. The only operationally meaningful corporate change outside the deal is the May 1, 2026 departure of Vice President and Controller Andrew Scribner, effective May 22, 2026, with CFO Nelson Urdaneta stepping in as interim principal accounting officer. That is manageable, but it adds a small execution test while the merger process is still active.
The May 14, 2026 annual meeting reinforced continuity: all director nominees were elected, Deloitte & Touche LLP was ratified as auditor, and the advisory pay vote passed, while the independent board chair proposal failed. In my view, the recent 8-Ks modestly strengthen the case because the merger approval is the only event here that materially changes the company’s strategic trajectory.
Financial Analysis
Growth
KMB — Financial Growth (Quarterly, USD Mil)
| Metric | 2025-06-30 | 2025-09-30 | 2025-12-31 | 2026-03-31 | 2026-06-30 |
|---|---|---|---|---|---|
| REVENUE (USD Mil) | 4,163 | 4,150 | 4,080 | 4,163 | 4,189 |
| EBIT (USD Mil) | 580 | 611 | 496 | 743 | 625 |
| EBITDA (USD Mil) | 802 | 787 | 685 | 936 | 792 |
| NET INCOME (USD Mil) | 509 | 446 | 499 | 665 | 345 |
| DILUTED EPS | 1.5 | 1.3 | 1.5 | 2 | 1 |
Source: Yahoo Finance — Quarterly Financial Statements
Revenue was essentially flat across the last five quarters: $4.2B in Q2 2025, $4.2B in Q3 2025, $4.1B in Q4 2025, $4.2B in Q1 2026, and $4.2B in Q2 2026. That is only 0.6% growth in Q2 2026 versus Q2 2025, so the top line is stable rather than accelerating. EBITDA moved more than revenue, from $802M in Q2 2025 to $792M in Q2 2026, while net income fell from $509M to $345M and diluted EPS dropped from 1.53 to 1.04, which means earnings are lagging sales.
The flat revenue profile fits a mature consumer staples business, but it also means the thesis depends on margin repair rather than volume acceleration. I do not see a clean growth catalyst yet, and that is why the market is unlikely to pay up for the stock on growth alone.
Profitability
KMB — Profitability (TTM)
| Metric | TTM |
|---|---|
| Operating Margin (TTM) | 19.0% |
| Net Margin (TTM) | 11.8% |
| Return on Assets (TTM) | 10.2% |
| Return on Equity (TTM) | 104.9% |
| Gross Margin (TTM) | 37.6% |
| EBITDA Margin (TTM) | 21.0% |
Source: Yahoo Finance — Trailing Twelve Months (TTM)
TTM operating margin was 19.0%, gross margin was 37.6%, and EBITDA margin was 21.0%, so the 18.6-point gap between gross and operating margin shows Kimberly-Clark is still carrying a heavy opex load even after product costs are covered. That gap is the key signal investors should watch, because further margin gains will come more from scale, automation, and overhead discipline than from raw pricing power.
TTM net margin was 11.8%, while TTM ROA was 10.2% and TTM ROE was 105%. The wide ROE versus ROA gap implies returns are being amplified by leverage rather than by asset-light economics alone, so the equity return figure is less durable if financing conditions tighten. The spread between EBITDA margin and net margin also shows that depreciation, amortization, and other below-EBITDA items still take a meaningful bite out of earnings.
This is a mature, profitable business, not an early-stage one, and the profitability profile is a bull signal because margins are solid and still leave room to improve if operating margin keeps closing toward gross margin.
Valuation
KMB — Valuation Multiples
| Metric | Value |
|---|---|
| Current Share Price (USD) | 94.4 |
| Market Cap (USD Mil) | 31,322 |
| Enterprise Value (USD Mil) | 37,089 |
| Trailing P/E | 18.6 |
| Forward P/E | 12.6 |
| Price/Sales (TTM) | 1.9 |
| Price/Book (mrq) | 17.9 |
| EV/Revenue | 2.2 |
| EV/EBITDA | 10.7 |
| Beta (5Y Monthly) | 0.27 |
| FCF Yield % (TTM) | 3.0% |
| Forward EPS (USD) | 7.5 |
| Analyst Target Price – Low (USD) | 90 |
| Analyst Target Price – Mean (USD) | 116.2 |
| Analyst Target Price – High (USD) | 162 |
| # Analyst Opinions | 15 |
Source: Yahoo Finance
KMB trades at 2.2x EV/Revenue and 1.9x Price/Sales on a current share price of $94.4, which tells me the market is paying for a stable consumer staples cash stream rather than rapid growth. With 15 analyst opinions, the consensus target range of $90 to $162 and mean of $116.2 frames the stock as fairly valued to modestly undervalued, not deeply cheap.
The earnings multiples are more informative than the sales multiple here: trailing P/E is 18.6x, forward P/E is 12.6x, and PEG is 1.9x. That combination implies the market is pricing in mid-single-digit earnings growth with enough durability to keep the forward multiple below the trailing one. EV/EBITDA is 10.7x, which is reasonable for a defensive branded goods business with a 21.0% EBITDA margin and 3.0% FCF yield, but not a bargain. Price/Book is 17.9x, and with book value per share at $5.3, the stock is valued far above accounting equity because investors are paying for brand and cash generation, not liquidation value.
On the analysis here, I would put fair value in a range of about $90–$116, which sits inside the analyst consensus band and close to the current price. I would not stretch that range higher unless the merger closes cleanly and the margin bridge starts to show up in reported results, because leverage and execution risk still cap how much of the peer premium the market should pay. The implied earnings path is roughly 7.5 of forward EPS, which is rich enough to support the current multiple but not rich enough to justify a much higher one unless peers also re-rate.
Leverage
KMB — Leverage & Coverage (Quarterly)
| Metric | Value |
|---|---|
| Total Debt/Equity % (mrq) | 348.9 |
| Current Ratio (mrq) | 0.9 |
| Total Debt (mrq, USD Mil) | 6,539 |
| Operating Cash Flow (TTM, USD Mil) | 3,333 |
| Levered Free Cash Flow (TTM, USD Mil) | 941.1 |
| Net Debt/EBITDA (TTM) | 1.6 |
| FCF Margin % (TTM) | 5.7% |
Source: Yahoo Finance — Quarterly Financial Statements
KMB’s leverage is manageable but not a competitive advantage. Total debt/equity was 348.9%, current ratio was 0.9, and total debt was $6.5B mrq, so the balance sheet is meaningfully levered and near-term liquidity is tight. Against that, operating cash flow was $3.3B TTM and levered free cash flow was $941.1M TTM, which shows the business still throws off cash after interest and capital spending.
Net debt/EBITDA was 1.6x TTM and FCF margin was 5.7% TTM, so debt is not at a distress level, but cash conversion is only moderate relative to the size of the debt load. In my view, this is medium refinancing risk because the company has cash generation to service obligations, yet the sub-1.0 current ratio leaves less room if working capital tightens or rates stay elevated. The leverage profile is a neutral signal: it supports flexibility today, but a weaker operating quarter or a refinancing date would make it a nearer-term concern.
Insider Activity
The insider transaction record I see here is net selling, with 8 open-market sales totaling $3.2M versus 2 purchases totaling $1.1M over the 2025-01-31 to 2026-05-06 window. The activity is broad rather than concentrated, since multiple insiders sold and the sample spans 86 Form 4 filings, which suggests alignment is present but not being reinforced by insider buying. That does not change the thesis by itself, but it does mean insiders are not signaling urgency to add at current levels.
Comparable Analysis
Growth
| Company | Revenue TTM (USD Mil) | Revenue Growth YoY % | EBITDA TTM (USD Mil) | Diluted EPS TTM |
|---|---|---|---|---|
| KMB | 16,582 | 0.6% | 3,481 | 5.1 |
| CL | 21,047 | 4.9% | 4,983 | 2.5 |
| CLX | 6,720 | -2.0% | 1,140 | 4.8 |
| CHD | 6,229.1 | 1.6% | 1,354.8 | 3.1 |
| KVUE | 15,408 | 3.0% | 3,481 | 0.9 |
Source: Yahoo Finance
KMB’s revenue growth of 0.6% TTM trails CL’s 4.9% and KVUE’s 3.0%, while it is only modestly ahead of CLX’s -2.0% and below CHD’s 1.6%. That gap says KMB is the slowest top-line compounder in this group, so its valuation needs to be justified by cash conversion and margin quality rather than growth leadership.
Valuation
| Company | Current Share Price (USD) | Trailing P/E | Forward P/E | EV/Revenue | EV/EBITDA | Price/Sales (TTM) | Price/Book (mrq) | Market Cap (USD Mil) | Enterprise Value (USD Mil) | Beta (5Y Monthly) | FCF Yield % (TTM) | Forward EPS | Analyst Target Price – Low | Analyst Target Price – Mean | Analyst Target Price – High | # Analyst Opinions |
|---|---|---|---|---|---|---|---|---|---|---|---|---|---|---|---|---|
| KMB | 94.4 | 18.6 | 12.6 | 2.2 | 10.7 | 1.9 | 17.9 | 31,322 | 37,089 | 0.27 | 3.0% | 7.5 | 90 | 116.2 | 162 | 15 |
| CL | 84.3 | 33.2 | 20.5 | 3.5 | 14.8 | 3.2 | 284.7 | 67,170 | 73,904 | 0.32 | 5.1% | 4.1 | 87 | 98.6 | 110 | 20 |
| CLX | 80.4 | 16.7 | 12.9 | 2.3 | 13.5 | 1.4 | 108.1 | 9,724 | 15,341 | 0.54 | 1.1% | 6.3 | 77 | 100.1 | 154 | 17 |
| CHD | 94.3 | 30.2 | 23.4 | 3.9 | 18.1 | 3.6 | 5.1 | 22,371 | 24,544 | 0.47 | 4.2% | 4 | 78 | 105.1 | 115 | 19 |
| KVUE | 17.2 | 20 | 13.9 | 2.6 | 11.6 | 2.1 | 3.1 | 33,037 | 40,540 | 0.43 | 5.8% | 1.2 | 18 | 19.5 | 23 | 12 |
Source: Yahoo Finance
KMB trades at a 3.0% FCF yield TTM, which is below CL’s 5.1%, KVUE’s 5.8%, and CHD’s 4.2%, while its EV/Revenue of 2.2x is cheaper than CL’s 3.5x and CHD’s 3.9x but close to CLX’s 2.3x and KVUE’s 2.6x. On forward earnings, KMB’s 12.6x P/E and 7.5 forward EPS sit below CL’s 20.5x and 4.1, CHD’s 23.4x and 4.0, and KVUE’s 13.9x and 1.2, which tells me the market is paying less for KMB’s earnings stream even though its FCF yield is not best in class. That discount is partly explained by KMB’s slower growth and higher leverage, so the stock looks cheaper on earnings than on cash yield.
Profitability
| Company | Operating Margin (TTM) | Net Margin (TTM) | Return on Assets (TTM) | Return on Equity (TTM) | Gross Margin (TTM) | EBITDA Margin (TTM) |
|---|---|---|---|---|---|---|
| KMB | 19.0% | 11.8% | 10.2% | 104.9% | 37.6% | 21.0% |
| CL | 21.0% | 9.7% | 15.8% | 267.4% | 60.4% | 23.7% |
| CLX | 12.9% | 8.7% | 8.3% | 163.8% | 42.3% | 17.0% |
| CHD | 18.1% | 12.0% | 7.9% | 17.0% | 45.6% | 21.8% |
| KVUE | 19.4% | 10.8% | 7.0% | 15.6% | 58.4% | 22.6% |
Source: Yahoo Finance
KMB’s 19.0% operating margin and 21.0% EBITDA margin are below CL’s 21.0% and 23.7%, roughly in line with CHD’s 18.1% and 21.8%, and above CLX’s 12.9% and 17.0%. Gross margin is the weak spot at 37.6% versus CL’s 60.4%, CHD’s 45.6%, and CLX’s 42.3%, which points to a cost-of-revenue disadvantage rather than just a scale issue. The narrower gross margin then flows through to a lower net margin of 11.8% versus CHD’s 12.0%, so KMB’s operating profile looks solid but not superior.
Leverage
| Company | Total Debt/Equity % (mrq) | Current Ratio (mrq) | Total Debt (mrq, USD Mil) | Operating Cash Flow TTM (USD Mil) | Free Cash Flow TTM (USD Mil) | Net Debt/EBITDA (TTM) | FCF Margin % (TTM) |
|---|---|---|---|---|---|---|---|
| KMB | 348.9 | 0.9 | 6,539 | 3,333 | 941.1 | 1.6 | 5.7% |
| CL | 1,388.2 | 1 | 7,857 | 4,456 | 3,458.4 | 1.3 | 16.4% |
| CLX | 2,221.4 | 0.7 | 5,598 | 612 | 110.4 | 4.8 | 1.6% |
| CHD | 55.9 | 1.1 | 2,428.3 | 1,260.5 | 939.3 | 1.6 | 15.1% |
| KVUE | 81.6 | 1 | 8,613 | 2,325 | 1,907.5 | 2.2 | 12.4% |
Source: Yahoo Finance
KMB’s 348.9% debt/equity and 1.6x net debt/EBITDA are manageable next to CLX’s 2,221.4% and 4.8x, but more levered than CL’s 1.3x and CHD’s 1.6x, while its 5.7% FCF margin trails CL’s 16.4%, CHD’s 15.1%, and KVUE’s 12.4%. The balance sheet is not stretched, yet the lower FCF margin means KMB has less room to absorb a margin slip, so leverage is a mild constraint rather than a thesis driver.
Conclusion
I would put my rating as a Hold because Kimberly-Clark’s valuation already reflects a defensive branded-essentials business, while the operating data still show only 0.6% TTM revenue growth and a 5.7% TTM FCF margin. The brand portfolio and No. 1 or No. 2 share positions in about 70 countries support resilience, but they do not yet justify a clear re-rating when gross margin is still 37.6% and current ratio is 0.9.
The upside case is straightforward: if the Kenvue transaction closes on time and the combined company shows that the expected $3B of pre-tax productivity savings is translating into a real margin step-up, I would move more towards a Buy. On the current $16.6B revenue base, even a 100 basis point lift in operating margin would add about $166M of annual operating profit, which is enough to matter for deleveraging and for proving that the deal is creating more than scale. I would also want to see quarterly revenue growth hold above 3.0%, meaning the portfolio is gaining some pricing and mix traction rather than just defending share.
The downside case is just as clear. I would move from Hold to Sell if the merger slips past the November 2, 2026 outside date or if net debt/EBITDA moves materially above 2.0x, because then the equity would be carrying dilution risk without the offset of visible synergy capture. A cleaner bear trigger would be gross margin falling below 36.0%, which would show that raw-material inflation is outrunning pricing before the deal benefits arrive.
Weighing both paths, I lean to Hold because the downside is real but not yet dominant, while the upside still depends on execution that has not been fully proven. The next few quarters should tell us whether Kenvue and the transformation program are creating a larger, more efficient consumer staples platform or simply adding leverage to a slow-growing base.
What to Watch Next
- Kenvue close by November 2, 2026 — would support a move more towards Buy.
- Operating margin above 20.0% — would show the transformation is lifting earnings.
- Net debt/EBITDA above 2.0x — would make leverage a more serious constraint.
- Gross margin below 36.0% — would signal cost pressure is outrunning pricing.
- Quarterly revenue growth above 3.0% — would show better pricing and mix.
What’s your take? I rated Kimberly-Clark (KMB) HOLD above — but the goal here is to get this right, not just to publish an opinion. What would you add to this analysis, or which risk or catalyst do you think I’m under- or over-weighting? Tell me in the comments.
Sources
- SEC 10-K Annual Report — filed 2026-02-12
- SEC 8-K Filing (2026-05-14)
- SEC 8-K Filing (2026-05-05)
- SEC 8-K Filing (2026-04-28)
- SEC 8-K Filing (2026-01-29)
- SEC 8-K Filing (2026-01-27)
- SEC 8-K Filing (2026-01-16)
- SEC Form 4 Insider Transaction (2026-05-06)
- SEC Form 4 Insider Transaction (2026-05-04)
- SEC Form 4 Insider Transaction (2026-05-04)
- SEC 10-K Annual Report — FY2026
- SEC 10-K Annual Report — FY2025
- SEC 10-K Annual Report — FY2024
- SEC 10-K Annual Report — FY2023
- SEC 10-K Annual Report — FY2022
Data sourced from Yahoo Finance and SEC EDGAR. Not investment advice.
Leave a Comment