| Company | Jul 25 | Aug 25 | Sep 25 | Oct 25 | Nov 25 | Dec 25 | Jan 26 | Feb 26 | Mar 26 | Apr 26 | May 26 | Jun 26 | 12-Mo |
|---|---|---|---|---|---|---|---|---|---|---|---|---|---|
| SMR | +27% | -31% | +4% | +25% | -55% | -29% | +23% | -26% | -16% | +15% | +2% | -21% | -75% |
| OKLO | +37% | -4% | +52% | +19% | -31% | -21% | +11% | -21% | -21% | +46% | -8% | -22% | -7% |
| NNE | +3% | -8% | +19% | +23% | -31% | -27% | +22% | -10% | -23% | +14% | +24% | -27% | -39% |
| LEU | +18% | -6% | +54% | +19% | -29% | -6% | +15% | -27% | -14% | +22% | -14% | -8% | -8% |
| BWXT | +5% | +7% | +14% | +16% | -16% | -3% | +19% | +0% | -1% | +6% | -9% | -1% | +36% |
Source: Yahoo Finance monthly adjusted close.
Quick Thesis
This NuScale Power stock analysis reviews SMR valuation, cash burn, backlog, commercialization risk, customer concentration, dilution risk, and the long-term outlook.
Quick thesis: SMR has a compelling nuclear commercialization story, but the stock depends on backlog conversion, funding needs, project execution, and whether valuation already prices in too much success.
| Factor | Why it matters |
|---|---|
| Valuation | Shows how much future commercialization is already priced in. |
| Cash burn | Measures funding and dilution pressure. |
| Backlog | Indicates potential demand conversion. |
| Commercialization risk | Determines whether projects can scale economically. |
| Customer concentration | Frames dependence on a narrow buyer base. |
Executive Summary
Rating: STRONG SELL | SMR
Measured from adjusted close on 2026-07-23 to 2026-10-21. Sell ratings are correct when the stock falls; Hold is tracked as a +/-10% range. Daily-close data, not intraday. Calls are tracked for 182 days from publication, then frozen as a final record.
Same call, re-affirmed: we have tracked this STRONG SELL since 2026-07-23, and the entry price above is that day’s close, not today’s price. This article re-affirms the call on 2026-10-07; the tracking window runs 182 days from then.
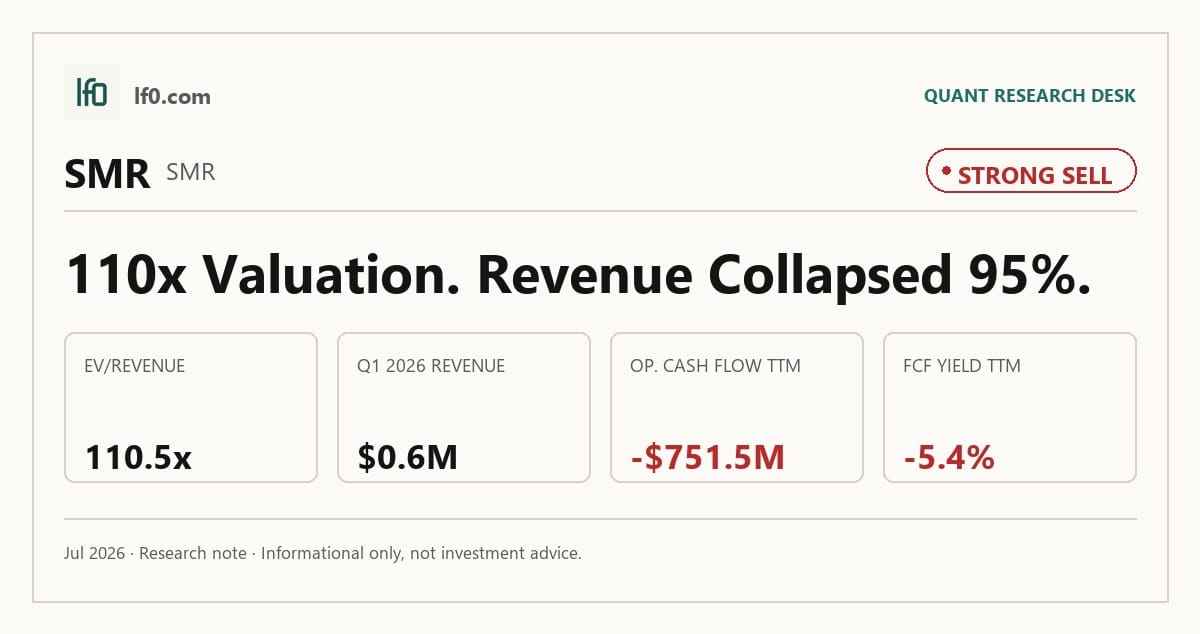
I would put my rating as a Strong Sell because NuScale is still burning cash at a scale that the current revenue base cannot support, while the stock already prices in a very large commercialization success. Revenue fell from $13.4M in Q1 2025 to $0.6M in Q1 2026, and TTM operating cash flow was -$751.5M, so the business is moving in the wrong direction even before you get to valuation. In my view, the key tension is that the technology moat is real, but the market is paying for a commercial ramp that has not yet shown up in the numbers. I would raise my rating more towards a Sell if NuScale signs a binding RoPower EPC contract or an ENTRA1 PPA and OEM agreement that converts the current pipeline into revenue visibility.
Company Profile
NuScale Power Corp. develops small modular reactor technology through NuScale LLC and earns revenue from licensing, engineering support, module sales, and plant-life services such as testing, training, fuel supply, and program management. Its core product is the NuScale Power Module, a light water reactor that generates 77 MWe and can be deployed in 1 to 12 module configurations. The company was founded in 2007, went public via a merger in 2022, and in September 2020 became the first SMR to receive a Standard Design Approval from the U.S. Nuclear Regulatory Commission. In May 2025, the NRC approved a second standard design approval for the 6-module, 77 MWe design. NuScale is headquartered in Corvallis, Oregon, with operations concentrated in Houston and Corvallis and employees in 42 states plus Washington, D.C. It had 428 employees at December 31, 2025. NuScale Corp. is listed on the NYSE under SMR and is a holding company whose only material asset is its interest in NuScale LLC.
Economic Moat
Business Model
The NRC-approved 77 MWe NuScale Power Module and the 513 global patents are the clearest structural defenses in the current 10-K, and I feel that a well-funded competitor would struggle to replicate that combination within 3 years. The design approval matters because it lets U.S. customers reference an approved standard design and safety case for expedited licensing under 10 CFR Part 52, while the patent estate, with 268 applications pending, raises the cost and time needed to copy the module architecture, safety systems, and control logic. A secondary moat sits in the passive safety package: the unlimited coping period, the site-boundary emergency planning zone methodology approved by the NRC, and the no-backup-power requirement together make the plant easier to site near data centers, industrial users, and coal repowering sites than a conventional large reactor.
The business has moved from a pre-commercial development platform in 2022 to a licensing and commercialization platform in 2026, but I would still call that a prospective commercialization model rather than a proven one. In 2023, the company was still describing itself as a developer with a first delivery target of 2028 and a 12-module VOYGR design; today it has a second NRC standard design approval for the 6-module, 77 MWe design, plus a licensing pathway that U.S. customers can now reference. The patent base also expanded from 469 global patents and 186 pending applications in FY2023 to 513 issued and 268 pending in FY2025, which tells me the technology stack is still being fortified rather than commoditized. The commercial footprint has also become more concrete: RoPower moved from a teaming agreement in 2021 to a technology licensing agreement in July 2024, and in February 2026 its shareholders approved the investment decision for the Doicesti project, while ENTRA1 now holds the exclusive global commercialization rights and is negotiating with the Tennessee Valley Authority on up to six 12-module plants. In my view, the business is structurally stronger than 5 years ago because the regulatory basis is much more advanced, but it is still not yet de-risked because no binding customer delivery contract has been signed.
Business & Operating Risks
The most material risk is that NuScale has not yet secured a binding customer contract for its NuScale Power Module, and the current path to first deployment still depends on either a binding scope of supply and engineering, procurement, and construction contract with RoPower Nuclear S.A. or an ENTRA1 purchase power agreement and original equipment manufacturing agreement. According to the risk factors in their SEC 10-K, if neither route closes, initial deployment of the NPM, power plants, and ongoing services could be significantly delayed, which is not a theoretical issue for a pre-revenue developer. The financial data already shows the risk is materializing: the company has not generated meaningful revenue, so every slip in contract timing extends the cash burn period and pushes out the point at which the business can fund itself. I also read the MD&A and risk language as consistent here, because the filing’s emphasis on Milestone Contributions and partner-led commercialization matches a business that still lacks direct customer conversion.
A second risk is the ENTRA1 partnership structure, which can require NuScale to fund Milestone Contributions without any guarantee of revenue. The filing says the 2025 non-binding Tennessee Valley Authority agreement triggered Milestone Contribution 1 for 72 NPMs at an approximate cost of $507M, while Milestone 2 is about $16M per NPM once a binding third-party agreement is signed. That creates a clear cash-outflow risk before revenue arrives, and the sensitivity is large: if the project path advances but no revenue-generating contract follows, NuScale can be paying ENTRA1 for optionality rather than for sales. The financial data supports that this is already affecting the economics of the model, because the company is still loss-making and the filing itself warns that these payments could be unrecoverable if ENTRA1 does not generate future projects.
The third risk is funding and the Tax Receivable Agreement, which can drain liquidity even if operations improve. The 10-K discloses that an early termination payment under the TRA could be approximately $365M as of December 31, 2025, and that NuScale must pay 85% of certain tax benefits, or 42.5% for Fluor after the November 6, 2025 amendment. That is a direct claim on future cash that can crowd out reinvestment or dividends, and it also raises change-of-control friction because the obligation accelerates in certain events. The current financial profile makes this more than boilerplate: a company with no material revenue and continuing losses has little room to absorb a $365M lump sum without external financing.
The disclosed risks do not threaten the regulatory moat itself, but they do threaten the company’s ability to turn that moat into contracted revenue before cash burn and partner obligations consume the balance sheet.
Management Discussion & Analysis
Management is clearly responding to the commercialization and funding risks, but it is doing so with equity and partner structures rather than with self-funding operations. NuScale sold 57,112,216 shares in 2025 for gross proceeds of $1.3B and net proceeds of $1.3B, and it opened a new at-the-market equity program with an aggregate sales price of up to $750.0M in November 2025 after a prior $500.0M program in August 2025. That tells me management is funding long-lead materials, PMA milestone payments, and supply-chain readiness with equity rather than debt, which protects near-term solvency but also tells investors dilution remains the main financing tool. The balance sheet at December 31, 2025 shows $836.4M of cash and cash equivalents, $450.8M of liquid investments, and $5.7M of debt, so the company has runway, but the $259.9M PMA contribution payable in 2026 and the $48.9M of long-lead material commitments show that cash will keep leaving before commercial revenue arrives. The strategic signal is clearer on demand: the NRC approved the 6-unit 77 MWe standard design in May 2025, the Romanian Government approved the Doicesti SMR plant investment decision on February 12, 2026, and the PMA with ENTRA1 names NuScale as the key supplier to future ENTRA1 Energy Projects, which supports the commercialization narrative, but the 2025 results still show only $31.5M of revenue against $689.6M of operating loss, so investors should treat the pipeline as real but not yet earnings-accretive.
Claims in prior filings were partly confirmed and partly stretched. In 2024, management said it was transitioning from an R&D-based company to a commercial company and that cost optimization had produced $8.4M of personnel savings and $50.4M of professional fee savings; 2025 did show a much larger revenue base from RoPower-related work, but operating loss still widened to $689.6M, so the commercial pivot has not yet translated into operating leverage. In 2025, management expected operating losses and negative operating cash flow to grow until commercialization, and 2025 results confirmed that view with $459.6M of cash used in operations and an accumulated deficit of $732.9M, so that guidance was directionally accurate even if the scale of spending remained heavy. Tone and numbers have been broadly aligned since 2023, because management has consistently framed the business as pre-commercial while the financials have remained loss-making; that consistency supports credibility, but the repeated reliance on equity issuance and milestone-driven spending means execution is still ahead of proof. Management’s overall signal is constructive on funding and project readiness, but the numbers still show a business that is not yet converting regulatory progress into operating leverage.
Recent Events
The most significant development I see here is the February 26, 2026 at-the-market offering program, which gives NuScale Power access to up to $1B of equity capital through UBS, B. Riley, Canaccord, and Tuohy Brothers. In my view, that strengthens near-term funding flexibility but also weakens the equity case because it creates a clear dilution overhang, which matters for a company still dependent on external capital to execute its commercialization plan.
The second material event is the same-day termination of the prior at-the-market program on February 26, 2026, which tells me management is actively resetting its financing channel rather than relying on a stale structure. That looks like a practical step to keep the balance sheet funded, but it also reinforces that capital raising remains central to the thesis rather than a side issue.
NuScale also filed its Q4 and FY2025 results on February 26, 2026, its Q1 2026 results on May 7, 2026, and held an update call on April 8, 2026. Those disclosures keep the market focused on execution, but they do not change the core message from the financing actions: recent 8-Ks leave the investment case under pressure because dilution risk is now more explicit.
Financial Analysis
Growth
SMR — Financial Growth (Quarterly, USD Mil)
| Metric | 2025-03-31 | 2025-06-30 | 2025-09-30 | 2025-12-31 | 2026-03-31 |
|---|---|---|---|---|---|
| REVENUE (USD Mil) | 13.4 | 8.1 | 8.2 | 1.8 | 0.6 |
| EBIT (USD Mil) | -35.3 | -43.1 | -538.4 | -72.7 | -57.5 |
| EBITDA (USD Mil) | -35 | -42.8 | -538.1 | -72.5 | -57.2 |
| NET INCOME (USD Mil) | -14 | -17.6 | -273.3 | -50.8 | -44 |
| DILUTED EPS | -0.1 | -0.1 | -1.9 | — | -0.1 |
Source: Yahoo Finance — Quarterly Financial Statements
Revenue fell from $13.4M in Q1 2025 to $0.6M in Q1 2026, after $8.1M in Q2 2025, $8.2M in Q3 2025, and $1.8M in Q4 2025. That is a sharp step down, and EBITDA moved the same way, from -$35M in Q1 2025 to -$57.2M in Q1 2026 after a -$538.1M trough in Q3 2025, so losses are still widening relative to revenue rather than scaling down. The Q3 2025 collapse is not explained in the MD&A context provided, so I would flag it as an unexplained swing. This is a bear signal because the revenue base is shrinking faster than the business is proving repeatable earnings power.
Profitability
SMR — Profitability (TTM)
| Metric | TTM |
|---|---|
| Operating Margin (TTM) | -10,181.2% |
| Net Margin (TTM) | 0.0% |
| Return on Assets (TTM) | -14.5% |
| Return on Equity (TTM) | -83.0% |
| Gross Margin (TTM) | 23.8% |
| EBITDA Margin (TTM) | -1,088.4% |
Source: Yahoo Finance — Trailing Twelve Months (TTM)
TTM gross margin was 23.8%, which shows the reactor design itself still leaves room after direct costs, but the TTM operating margin of -10,181.2% and EBITDA margin of -1,088.4% show that overhead, development spend, and commercialization costs are overwhelming the gross profit base. The gap between gross margin and operating margin is so wide that investors should weight scale and cost absorption far more than product-level economics at this stage. TTM net margin was 0.0%, so the business is still not converting that gross profit into bottom-line earnings. TTM return on assets was -14.5% and TTM return on equity was -83.0%, which means capital is not yet earning a return and equity value is being diluted by losses rather than compounded by profits. The ROE gap versus ROA also suggests returns are being distorted by the capital structure rather than driven by durable operating profitability. I would watch for operating margin moving toward a positive level and net margin closing the gap to gross margin, because that would show commercialization costs are finally being absorbed. This is a bear signal because the current margin profile still looks like an early-stage platform that has not reached earnings scale.
Valuation
SMR — Valuation Multiples
| Metric | Value |
|---|---|
| Market Cap (USD Mil) | 3,004 |
| Enterprise Value (USD Mil) | 2,063 |
| Trailing P/E | — |
| Forward P/E | -12.1 |
| Price/Sales (TTM) | 160.9 |
| Price/Book (mrq) | 2.4 |
| EV/Revenue | 110.5 |
| EV/EBITDA | -10.2 |
| Beta (5Y Monthly) | 2.25 |
| FCF Yield % (TTM) | -5.4% |
| Forward EPS (USD) | -0.7 |
| Analyst Target Price – Low (USD) | 6 |
| Analyst Target Price – Mean (USD) | 14.8 |
| Analyst Target Price – High (USD) | 25 |
| # Analyst Opinions | 15 |
Source: Yahoo Finance
NuScale trades on a valuation that is driven almost entirely by sales, not earnings. The primary anchor is EV/Revenue at 110.5x, while Price/Sales is 160.9x and FCF Yield is -5.4%, which means the market is paying a very large equity value for a business that is still burning cash. With trailing P/E absent and Forward P/E at -12.1x, the earnings base is still negative, so those multiples are not useful as cheap or expensive signals yet.
EV/EBITDA is -10.2x because EBITDA is negative, so that multiple is mechanically distorted by losses and does not give a clean valuation read. The same is true for the negative Forward EPS of -$0.7 in FY2026, which tells me the market is not pricing near-term profitability. On a per-share basis, book value is $3.7 mrq and cash is $2.6 mrq, versus a derived share price of about $8.7 from $3,004.2M market cap and 346.1M shares, so investors are paying well above net assets for future commercialization optionality. On the analysis here, I would put fair value in a range of roughly $6-$15, which sits around the low end of the analyst target range and below the $14.8 mean because I give more weight to the current cash burn and the lack of a binding customer contract than to the longer-dated commercialization case. That range also implies an EPS path that remains negative near term, roughly around the current -$0.7 forward EPS, while peers such as BWXT at $5.2 forward EPS and LEU at $3.9 forward EPS already have positive earnings power to support their multiples. The valuation picture is a bear signal because the stock already discounts a very large execution success that is not yet visible in earnings or cash flow.
Leverage
SMR — Leverage & Coverage (Quarterly)
| Metric | Value |
|---|---|
| Total Debt/Equity % (mrq) | 0.5 |
| Current Ratio (mrq) | 29.4 |
| Total Debt (mrq, USD Mil) | 5.7 |
| Operating Cash Flow (TTM, USD Mil) | -751.5 |
| Levered Free Cash Flow (TTM, USD Mil) | -162 |
| Net Debt/EBITDA (TTM) | 4.4 |
| FCF Margin % (TTM) | -867.6% |
Source: Yahoo Finance — Quarterly Financial Statements
NuScale’s leverage is manageable on paper but weak in cash terms. Total Debt/Equity was 0.5%, Current Ratio was 29.4, and Total Debt was $5.7M, so the balance sheet has ample near-term liquidity and almost no funded debt. The problem is cash generation: Operating Cash Flow was -$751.5M, Levered Free Cash Flow was -$162M, Net Debt/EBITDA was 4.4x, and FCF Margin was -867.6%. In my opinion, this is medium refinancing risk because the current ratio gives runway, but negative operating cash flow means that runway is being consumed rather than replenished. EBITDA is not converting into cash, which points to heavy development spending and leaves the company dependent on external funding if project timing slips or capital markets tighten. The leverage profile is a bear signal because liquidity is strong today, but cash burn limits financial flexibility.
Insider Activity
The insider transaction record I see here is one-sided: 35 open-market sales and 0 open-market purchases, with $1.9B of selling and no buying in the 2024-12-31 to 2026-05-29 window. The pattern is concentrated around FLUOR CORP and a handful of senior executives, which suggests broad insider distribution rather than one isolated seller. In my view, that is a bear signal for alignment between insiders and shareholders.
Comparable Analysis
Growth
| Company | Revenue TTM (USD Mil) | Revenue Growth YoY % | EBITDA TTM (USD Mil) | Diluted EPS TTM |
|---|---|---|---|---|
| SMR | 18.7 | -95.8% | -203.2 | -2.2 |
| OKLO | — | — | -172.1 | -0.8 |
| NNE | — | — | -45 | -0.7 |
| LEU | 452.3 | 4.9% | 34.2 | 2.8 |
| BWXT | 3,376.4 | 26.1% | 464.6 | 3.8 |
Source: Yahoo Finance
SMR’s revenue fell 95.8% TTM, while BWXT grew 26.1% TTM and LEU grew 4.9% TTM, so SMR is not being rewarded for operating scale or earnings expansion. OKLO and NNE do not have positive revenue in the dataset, but their negative EBITDA of -$172.1M TTM and -$45M TTM still leave them ahead of SMR’s -$203.2M TTM EBITDA, which means SMR’s growth discount is not just a nuclear sector issue, it is a company-specific collapse in the top line.
Valuation
| Company | Trailing P/E | Forward P/E | EV/Revenue | EV/EBITDA | Price/Sales (TTM) | Price/Book (mrq) | Market Cap (USD Mil) | Enterprise Value (USD Mil) | Beta (5Y Monthly) | FCF Yield % (TTM) | Forward EPS | Analyst Target Price – Low | Analyst Target Price – Mean | Analyst Target Price – High | # Analyst Opinions |
|---|---|---|---|---|---|---|---|---|---|---|---|---|---|---|---|
| SMR | — | -12.1 | 110.5 | -10.2 | 160.9 | 2.4 | 3,004 | 2,063 | 2.25 | -5.4% | -0.7 | 6 | 14.8 | 25 | 15 |
| OKLO | — | -52.7 | — | -32.2 | — | 2.9 | 7,743 | 5,537 | 1.16 | -1.3% | -0.8 | 14 | 86.2 | 140 | 20 |
| NNE | — | -15.3 | — | -7.4 | — | 1.5 | 903 | 334 | 5.27 | -3.7% | -1.1 | 22 | 41.4 | 50 | 5 |
| LEU | 62 | 44.2 | 6.1 | 80.1 | 7.6 | 4.4 | 3,429 | 2,739 | 1.36 | -0.3% | 3.9 | 170 | 264.7 | 390 | 15 |
| BWXT | 46.1 | 33.7 | 5.2 | 37.8 | 4.8 | 12.5 | 16,048 | 17,554 | 0.74 | 1.0% | 5.2 | 200 | 238.8 | 290 | 13 |
Source: Yahoo Finance
SMR trades at 110.5x EV/Revenue and 160.9x price/sales, versus BWXT at 5.2x EV/Revenue and 4.8x price/sales, and LEU at 6.1x EV/Revenue and 7.6x price/sales. On a forward basis, SMR’s -$0.7 Forward EPS sits below OKLO’s -$0.8 and NNE’s -$1.1, yet SMR still carries a $3B market cap and $2.1B enterprise value, which tells me the stock is priced for a recovery that has not shown up in earnings. That premium is harder to justify when I line it up against the leverage table: BWXT’s 4.9% FCF margin and 3.2x net debt/EBITDA show a business that can support a richer multiple, while SMR’s negative cash flow leaves little room for execution error. A $1 investment one year ago would be worth $0.3 in SMR, versus $1.3 in BWXT, $0.9 in LEU, $0.5 in NNE, and $0.9 in OKLO, so the market has already punished SMR’s weak operating profile even though the headline multiple still looks extreme.
Profitability
| Company | Operating Margin (TTM) | Net Margin (TTM) | Return on Assets (TTM) | Return on Equity (TTM) | Gross Margin (TTM) | EBITDA Margin (TTM) |
|---|---|---|---|---|---|---|
| SMR | -10,181.2% | 0.0% | -14.5% | -83.0% | 23.8% | -1,088.4% |
| OKLO | 0.0% | 0.0% | -7.2% | -8.9% | — | — |
| NNE | 0.0% | 0.0% | -7.7% | -8.6% | — | — |
| LEU | -0.3% | 13.4% | 0.8% | 12.3% | 25.7% | 7.6% |
| BWXT | 10.4% | 10.2% | 6.0% | 29.0% | 22.7% | 13.8% |
Source: Yahoo Finance
SMR’s gross margin is 23.8%, which is close to LEU’s 25.7% and BWXT’s 22.7%, but its operating margin of -10,181.2% and EBITDA margin of -1,088.4% are far worse than BWXT’s 10.4% operating margin and 13.8% EBITDA margin, so the problem is not cost of revenue alone. The gap points to opex and project execution, not just product economics, because SMR is converting a similar gross margin base into deeply negative operating profit while BWXT is turning a comparable gross margin into positive earnings. On returns, SMR’s ROE of -83.0% and ROA of -14.5% trail BWXT’s 29.0% ROE and 6.0% ROA by a wide margin, which tells me the company is still destroying capital rather than compounding it.
Leverage
| Company | Total Debt/Equity % (mrq) | Current Ratio (mrq) | Total Debt (mrq, USD Mil) | Operating Cash Flow TTM (USD Mil) | Free Cash Flow TTM (USD Mil) | Net Debt/EBITDA (TTM) | FCF Margin % (TTM) |
|---|---|---|---|---|---|---|---|
| SMR | 0.5 | 29.4 | 5.7 | -751.5 | -162 | 4.4 | -867.6% |
| OKLO | 0.1 | 59.9 | 2.6 | -87.8 | -100 | 12.8 | — |
| NNE | 0.4 | 95.7 | 2.6 | -23.3 | -33.3 | 12.6 | — |
| LEU | 152 | 5.7 | 1,178.6 | -20.6 | -10.9 | -20.2 | -2.4% |
| BWXT | 157.6 | 2.4 | 2,018 | 521.8 | 165.5 | 3.2 | 4.9% |
Source: Yahoo Finance
SMR’s net debt/EBITDA is 4.4x and free cash flow margin is -867.6%, versus BWXT at 3.2x net debt/EBITDA and 4.9% FCF margin, while LEU has negative net debt/EBITDA because cash exceeds debt. The raw debt load is only $5.7M, but the cash burn of -$162M means the balance sheet is being funded by equity value, not operations, which is a much weaker setup than BWXT’s cash-generative model. That gap matters for valuation too: BWXT’s stronger leverage profile helps explain why it can trade at a much healthier multiple than SMR, while SMR’s funding dependence keeps the equity discount in place.
Conclusion
I would put my rating as a Strong Sell because NuScale is still burning cash at a scale that the current revenue base cannot support, while the stock already prices in a very large commercialization success. TTM operating cash flow was -$751.5M and levered free cash flow was -$162.0M, so the business is not yet self-funding, and the 110.5x EV/Revenue multiple leaves little room for execution slippage.
I would move this more towards a Sell if NuScale signs a binding RoPower EPC contract or an ENTRA1 PPA and OEM agreement that converts the current pipeline into revenue visibility, because that would reduce the risk that commercialization stays purely aspirational. If the company can also narrow the TTM operating loss from -$689.6M toward roughly -$400M, that would imply about $290M of annual expense absorption on the current cost base, which would materially shorten the cash burn runway and make dilution less frequent.
The bear case is more concrete today: if no binding customer contract lands before the next financing step, the $507M Milestone Contribution tied to the TVA non-binding agreement and the $365M TRA termination exposure can keep consuming cash before revenue arrives. In that scenario, the company would likely need to lean harder on the new $1.0B at-the-market program, and each additional equity raise would dilute per-share value before the first commercial plant contributes meaningful earnings.
Weighing both paths, I think the bear case is more likely to show up first because the financing needs are immediate while the revenue conversion is still conditional. The stock can work only if contract signing starts to outrun cash burn, and I do not see that inflection in the current numbers.
What’s your take? I rated NuScale Power (SMR) STRONG SELL above — but the goal here is to get this right, not just to publish an opinion. What would you add to this analysis, or which risk or catalyst do you think I’m under- or over-weighting? Tell me in the comments.
Sources
- SEC 10-K Annual Report — filed 2026-02-26
- SEC 8-K Filing (2026-06-02)
- SEC 8-K Filing (2026-05-07)
- SEC 8-K Filing (2026-04-08)
- SEC 8-K Filing (2026-02-26)
- SEC 8-K Filing (2026-02-26)
- SEC 8-K Filing (2026-01-27)
- SEC Form 4 Insider Transaction (2026-06-02)
- SEC Form 4 Insider Transaction (2026-06-02)
- SEC Form 4 Insider Transaction (2026-06-02)
- SEC 10-K Annual Report — FY2026
- SEC 10-K Annual Report — FY2025
- SEC 10-K Annual Report — FY2024
- SEC 10-K Annual Report — FY2023
- SEC 10-K Annual Report — FY2022
Data sourced from Yahoo Finance and SEC EDGAR. Not investment advice.
Leave a Comment