
| Company | Jul 25 | Aug 25 | Sep 25 | Oct 25 | Nov 25 | Dec 25 | Jan 26 | Feb 26 | Mar 26 | Apr 26 | May 26 | Jun 26 | 12-Mo |
|---|---|---|---|---|---|---|---|---|---|---|---|---|---|
| BMNR | +2% | +26% | +19% | -10% | -29% | -18% | -8% | -24% | +4% | +8% | -10% | -31% | -61% |
| MARA | +3% | -1% | +14% | +0% | -35% | -24% | +6% | -6% | -9% | +47% | +20% | -3% | -11% |
| RIOT | +19% | +3% | +38% | +4% | -18% | -21% | +22% | +5% | -24% | +39% | +57% | +1% | +142% |
| MSTR | -1% | -17% | -4% | -16% | -34% | -14% | -1% | -13% | -4% | +33% | -4% | -45% | -78% |
| CLSK | +3% | -17% | +53% | +23% | -15% | -33% | +17% | -16% | -14% | +47% | +46% | -20% | +32% |
Source: Yahoo Finance monthly adjusted close.
Executive Summary
Rating: SELL | BMNR
Measured from adjusted close on 2026-07-22 to 2026-10-21. Sell ratings are correct when the stock falls; Hold is tracked as a +/-10% range. Daily-close data, not intraday. Calls are tracked for 182 days from publication, then frozen as a final record.
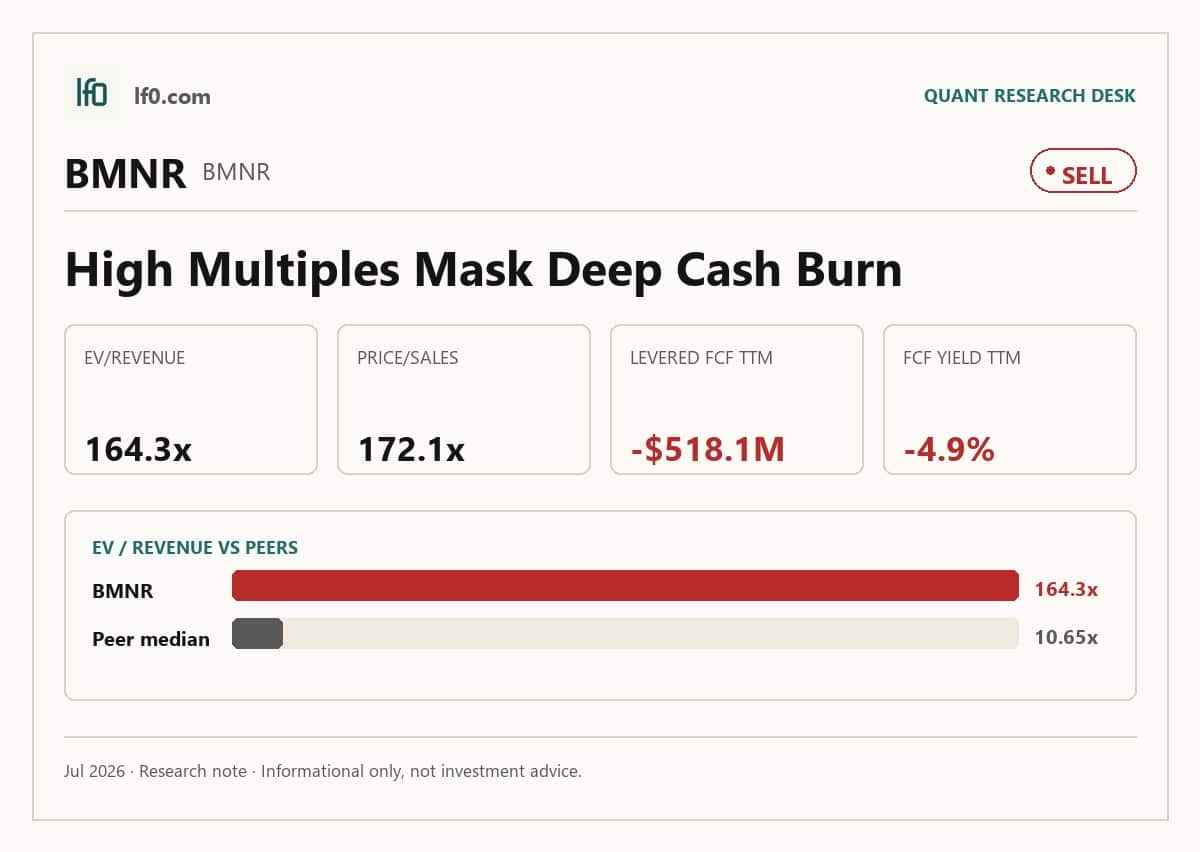
I would put my rating as a Sell because BitMine Immersion Technologies is priced for a scale-up that has not yet translated into durable cash generation, with EV/Revenue at 164.3x, FCF Yield (TTM) at -4.9%, and levered free cash flow (TTM) at $518.1M. The business does have a real operating asset in immersion cooling and a gross margin of 84.4% in TTM, but that gross profit is still being absorbed by a deeply negative EBITDA margin of -480.5%, so the equity is paying a premium for economics that have not reached the bottom line. I would raise my rating more towards a Hold if quarterly revenue stays above $40M for two consecutive quarters, because that would show the latest step-up is not just a one-off spike from a tiny base.
Company Profile
BitMine Immersion Technologies is a blockchain infrastructure company that self-mines bitcoin, hosts third-party miners, and sells digital asset mining equipment. Revenue comes mainly from bitcoin mined by its own fleet, then from hosting fees and equipment sales; hosting contracts typically run 1 to 3 years and often reimburse electricity plus a negotiated share of mined bitcoin. The company traces back to a Nevada predecessor incorporated in 1995, redomiciled to Delaware in April 2020, and completed a holding company reorganization in July 2020 before pivoting into immersion-cooled bitcoin mining. It is listed on OTCQX under BMNR. As of December 5, 2024, it operated in Trinidad, Pecos, Texas, and Murray, Kentucky, with about 4,725 miners owned and roughly 85% of mining capacity at third-party hosting sites. Financing includes a $2.3M insider-controlled line of credit secured by assets, plus common stock and two preferred series outstanding.
Economic Moat
Business Model
The immersion cooling data center is the most defensible part of the model, because the company ties its hosting and self-mining economics to proprietary thermodynamic management, redundant connectivity, 24/7 security, and immersion cooling that it says can be up to 95% more efficient than standard air cooling and can extend machine life by 30% or longer. I feel that a competitor could copy the concept, but not replicate a live, power-secured deployment with the same operating know-how in under 3 years, especially when the company is already using Full Pay Per Share (FPPS) mining pools, BitGo Trust custody, and Gemini Trust Company, LLC as a liquidation venue to keep the operating chain tight. The secondary edge is access to low-cost power and equipment sourcing: the Trinidad agreement with Telecommunications Services of Trinidad & Tobago Limited (TSTT) gives it up to 125,800 kW containers across 93 potential locations, while the company also says its supplier relationships let it buy desirable mining equipment at attractive prices.
Business & Operating Risks
The biggest disclosed risk is dependence on third-party hosting, because BitMine relies on outside operators for approximately 4,000 miners, or more than 85% of operational hash rate capacity, and about 95% of its third-party hosting is operated by Soluna Holdings, Inc. according to its SEC risk factors. That concentration means a Soluna outage, bankruptcy, or contract dispute could interrupt revenue, force repossession costs, and leave miners idle while the company looks for replacement capacity; the filing also notes that hosting contracts often give the host a first lien on the miners, which weakens BitMine’s recovery position if a counterparty fails. Bitcoin price volatility is the second major risk, and the filing is explicit that the price of bitcoin is extremely volatile, with a 2024 range of approximately $40,000 to $103,000 through December 5, 2024. Capital access and dilution risk are also material, because the company says it currently lacks the capital to open material additional facilities and will need to raise additional funds through equity or debt financings. In my view, these risks do not break the moat itself, but they do make the moat fragile because the operating edge only matters if power, hosting, and financing stay in place.
Management Discussion & Analysis
Management is responding to those risks with more financing and more capacity, not with balance-sheet repair. The company had only $499,270 of cash on hand as of August 31, 2024, while the IDI line of credit was expanded to $2.3M on November 4, 2024 and $1.9M was outstanding as of December 5, 2024, which tells me the business is still funding growth with related-party leverage rather than internally generated cash. The operating emphasis is on adding miners and capacity, and management says it is pursuing a private placement, convertible notes or preferred stock, and even a firm commitment offering to list on a national exchange. That reads as a financing-first strategy, but it also keeps dilution risk front and center. Trinidad and Pecos are being positioned as low-cost anchors, yet the filing also shows execution friction there, including the July 2024 repossession of the Trinidad containers and the fact that the Pecos joint venture’s clients mostly terminated in April 2024. The company’s own numbers show why that matters: self-mining cost to mine one bitcoin at owned facilities was $74,559.1 in FY2024 versus average revenue of $50,911.2, so the model still needs better power economics and higher utilization to become self-funding.
Recent Events
The most significant development was the November 4, 2024 financing package: BitMine amended its line of credit with Innovative Digital Investors Emerging Technology, L.P. and raised the maximum borrowing capacity from $1.75M to $2.3M, while also adding six monthly extension options at a $25,000 fee each. In the same filing, the company created Series B Convertible Preferred Stock with a $1,000 liquidation preference per share and a $0.20 conversion price, which gives the lender seniority and adds another layer of dilution risk for common holders. The November 14, 2024 miner purchase also matters. BitMine agreed to buy 3,000 S-19j Pro bitcoin miners for $1M, funding most of the upfront payment with proceeds from a Master Hashrate Purchase and Sale Agreement, under which it sold 90 PH per day for 365 days. I read that as a mixed signal: it expands mining capacity, but it also monetizes future hashrate today, which suggests liquidity remains tight. The May 3, 2024 auditor change, triggered by BF Borgers’ SEC ban and replacement with Bush & Associates CPA, is a governance cleanup, but it does not offset the heavier financing and dilution signals.
Financial Analysis
Growth
BMNR — Financial Growth (Quarterly, USD Mil)
| Metric | 2025-02-28 | 2025-05-31 | 2025-08-31 | 2025-11-30 | 2026-02-28 | 2026-05-31 |
|---|---|---|---|---|---|---|
| REVENUE (USD Mil) | — | 2.1 | 1.3 | 2.3 | 11 | 46.5 |
| EBIT (USD Mil) | — | -0.5 | 443.7 | -5,296.2 | -3,862.1 | -11.9 |
| EBITDA (USD Mil) | — | -0.3 | 443.9 | -5,296.1 | -3,862 | -11.5 |
| NET INCOME (USD Mil) | — | -0.6 | 351.3 | -5,204.1 | -3,818.4 | -83.6 |
| DILUTED EPS | -0.6 | -0.3 | — | -16 | -8.4 | -0.1 |
Source: Yahoo Finance — Quarterly Financial Statements
Revenue moved from $2.1M in 2025-05-31 to $46.5M in 2026-05-31, but the path was uneven: $1.3M in 2025-08-31, $2.3M in 2025-11-30, and $11M in 2026-02-28 before the latest jump. EBITDA followed the same pattern, moving from -$0.3M to -$11.5M over the same span after a brief spike to $443.9M that is not consistent with the rest of the series and should be read cautiously. The only clean year-over-year read is the latest quarter, where revenue rose from $11M to $46.5M, up 1,930%, while EBITDA improved from -$5.3M to -$11.9M. That looks like a step-change in operating scale rather than steady compounding, and it is consistent with the prior-year disclosure that low-cost sites would be the main growth lever.
Profitability
BMNR — Profitability (TTM)
| Metric | TTM |
|---|---|
| Operating Margin (TTM) | 8.4% |
| Net Margin (TTM) | 0.0% |
| Return on Assets (TTM) | -3.2% |
| Return on Equity (TTM) | -150.9% |
| Gross Margin (TTM) | 84.4% |
| EBITDA Margin (TTM) | -480.5% |
Source: Yahoo Finance — Trailing Twelve Months (TTM)
TTM gross margin was 84.4%, which shows the core hosting and mining economics still clear a high revenue-to-direct-cost spread. The problem is the rest of the income statement: TTM operating margin was 8.4%, while TTM EBITDA margin was -480.5%, so overhead, non-cash charges, and other below-gross-line items are overwhelming the business before it reaches durable scale. TTM net margin was 0.0%, which means the company is not yet converting that gross profit into shareholder earnings. TTM return on assets was -3.2% and TTM return on equity was -150.9%, a gap that points to returns being distorted by the capital structure rather than by stable operating profitability. Investors should watch for EBITDA margin moving toward positive territory and net margin staying positive, because that would show the model is finally absorbing fixed costs instead of relying on gross profit alone. The moat only starts to matter for equity holders when those gross economics reach the bottom line.
Valuation
BMNR — Valuation Multiples
| Metric | Value |
|---|---|
| Market Cap (USD Mil) | 10,532 |
| Enterprise Value (USD Mil) | 10,055 |
| Forward P/E | 18.6 |
| Price/Sales (TTM) | 172.1 |
| Price/Book (mrq) | 0.9 |
| EV/Revenue | 164.3 |
| EV/EBITDA | -34.2 |
| Beta (5Y Monthly) | 1.67 |
| FCF Yield % (TTM) | -4.9% |
| Forward EPS (USD) | 0.9 |
| Analyst Target Price – Low (USD) | 25 |
| Analyst Target Price – Mean (USD) | 31.9 |
| Analyst Target Price – High (USD) | 40 |
| # Analyst Opinions | 3 |
Source: Yahoo Finance
BitMine is priced as a very expensive asset on revenue, not as a profitable miner. EV/Revenue is 164.3x and Price/Sales (TTM) is 172.1x, which implies the market is paying for a large step-up in monetization and a sustained move from today’s negative cash generation to durable profitability. That is a demanding setup for a business with FCF Yield (TTM) of -4.9%, because the equity is not yet funding itself. Forward P/E is 18.6x on Forward EPS of $0.94, so the market is also assuming earnings can normalize quickly enough to make the current enterprise value look less extreme. Price/Book is 0.9x, and with Book Value Per Share of $20.01 versus a market price implied by the valuation table, the stock trades below book, but that book value is not enough to offset the revenue multiple. Beta is 1.67, so the shares also carry above-market volatility. On the analysis here, I would put fair value in a range of roughly $1.2–$10.4 per share, based on a peer-multiple framework that already assumes the company can keep scaling. That range sits well below the $25–$40 analyst target band from three opinions, which tells me the sell-side consensus is giving more credit to execution than I am. My EPS view is roughly $0.50–$1.00 over the next year if the latest revenue step-up holds, which is close to the company’s own $0.94 forward EPS but still looks rich relative to peers that are either losing money or trading on much lower revenue multiples. In my view, the market is paying for a growth profile that still has to prove it can convert into cash, not just into reported revenue.
Leverage
BMNR — Leverage & Coverage (Quarterly)
| Metric | Value |
|---|---|
| Total Debt/Equity % (mrq) | 0 |
| Current Ratio (mrq) | 36.7 |
| Total Debt (mrq, USD Mil) | 1.3 |
| Operating Cash Flow (TTM, USD Mil) | -293.1 |
| Levered Free Cash Flow (TTM, USD Mil) | -518.1 |
| Net Debt/EBITDA (TTM) | 1.2 |
| FCF Margin % (TTM) | -846.6% |
Source: Yahoo Finance — Quarterly Financial Statements
BitMine’s leverage profile is weak on every cash metric that matters. Total Debt/Equity % (mrq) is 1.0%, Current Ratio (mrq) is 36.68, and Total Debt (mrq) is $1.3M, so the balance sheet itself is not the problem. The problem is cash generation: Operating Cash Flow (TTM) was -$293.1M, Levered Free Cash Flow (TTM) was -$518.1M, Net Debt/EBITDA (TTM) was 1.15x, and FCF Margin % (TTM) was -846.6%. In my opinion, this is a cash-burn risk rather than a refinancing risk, because the company has ample near-term liquidity but is still consuming it through operations. EBITDA is not converting into cash, so the business needs a sustained improvement in operating cash flow before leverage stops being a drag on the equity case.
Insider Activity
The insider transaction record I see here is buying only, with 3 open-market purchases and 0 open-market sales in the 2026-01-23 to 2026-04-23 window. Activity is concentrated, led by one very large 10%+ owner purchase on 2026-03-12, while the only other open-market buys are two small director purchases by Lori Love. I view that as a bullish alignment signal, although the sample is limited to 16 Form 4 filings over just 3 months.
Comparable Analysis
Growth
| Company | Revenue TTM (USD Mil) | Revenue Growth YoY % | Diluted EPS TTM |
|---|---|---|---|
| BMNR | 61.2 | 2,167.8% | -4.5 |
| MARA | 867.8 | -18.4% | -5.5 |
| RIOT | 653.3 | 3.6% | -2.5 |
| MSTR | 490.5 | 11.9% | -37 |
| CLSK | 739.9 | -24.9% | -2.1 |
Source: Yahoo Finance
BMNR’s revenue growth was 2,167.8% in TTM on $61.2M of revenue, while MARA was down 18.4% on $867.8M, RIOT was up 3.6% on $653.3M, MSTR was up 11.9% on $490.5M, and CLSK was down 24.9% on $739.9M. That kind of top-line surge is real, but it is also coming off a very small base, so I feel the market is already paying for a scale-up that still has to prove it can hold once the base gets larger.
Valuation
| Company | Forward P/E | EV/Revenue | EV/EBITDA | Price/Sales (TTM) | Price/Book (mrq) | Market Cap (USD Mil) | Enterprise Value (USD Mil) | Beta (5Y Monthly) | FCF Yield % (TTM) | Forward EPS | Analyst Target Price – Low | Analyst Target Price – Mean | Analyst Target Price – High | # Analyst Opinions |
|---|---|---|---|---|---|---|---|---|---|---|---|---|---|---|
| BMNR | 18.6 | 164.3 | -34.2 | 172.1 | 0.9 | 10,532 | 10,055 | 1.67 | -4.9% | 0.9 | 25 | 31.9 | 40 | 3 |
| MARA | -18.3 | 7.7 | -9 | 5.5 | 2.1 | 4,747 | 6,722 | 5.37 | -11.2% | -0.7 | 5.5 | 18.1 | 30 | 11 |
| RIOT | -33.4 | 13.5 | -26.9 | 13.5 | 3.7 | 8,826 | 8,798 | 3.81 | -5.1% | -0.7 | 20 | 29.4 | 45 | 20 |
| MSTR | 22.4 | 103.5 | -3.6 | 74.5 | 0.9 | 36,543 | 50,763 | 3.54 | -23.8% | 4.5 | 130 | 303.6 | 570 | 14 |
| CLSK | -21.1 | 7.4 | -14.1 | 5.3 | 4 | 3,929 | 5,477 | 3.84 | -7.6% | -0.7 | 16 | 22.3 | 27 | 13 |
Source: Yahoo Finance
Valuation is extreme even against this growth set: BMNR trades at 164.3x EV/Revenue and 172.1x Price/Sales, versus MARA at 7.7x and 5.5x, RIOT at 13.5x and 13.5x, MSTR at 103.5x and 74.5x, and CLSK at 7.4x and 5.3x. BMNR’s FCF Yield (TTM) is -4.9%, which is weaker than every peer here except MSTR at -23.8%, so the multiple is not backed by cash generation. With $61.2M of TTM revenue and 603.2M shares outstanding, an illustrative peer EV/Revenue range of 7.4x to 103.5x implies about $0.7B to $6.3B of equity value, or roughly $1.2 to $10.4 per share after netting BMNR’s $340.3M cash and $1.3M debt. That range is far below the current setup implied by the stock’s own 164.3x revenue multiple, so the valuation looks ahead of fundamentals.
Profitability
| Company | Operating Margin (TTM) | Net Margin (TTM) | Return on Assets (TTM) | Return on Equity (TTM) | Gross Margin (TTM) | EBITDA Margin (TTM) |
|---|---|---|---|---|---|---|
| BMNR | 8.4% | 0.0% | -3.2% | -150.9% | 84.4% | -480.5% |
| MARA | -558.1% | -234.8% | -15.6% | -67.3% | 45.3% | -85.9% |
| RIOT | -280.5% | -132.8% | -12.1% | -32.5% | 32.4% | -50.0% |
| MSTR | -11,641.5% | 0.0% | -17.8% | -30.8% | 68.1% | -2,852.4% |
| CLSK | -246.3% | -67.7% | -18.2% | -34.8% | 50.7% | -52.4% |
Source: Yahoo Finance
Profitability is mixed but still far below what BMNR’s gross margin suggests: gross margin is 84.4%, better than MSTR at 68.1%, MARA at 45.3%, RIOT at 32.4%, and CLSK at 50.7%, yet operating margin is 8.4% while EBITDA margin is -480.5%, versus MSTR at -11,641.5% and RIOT at -280.5%. The gap between a very high gross margin and a deeply negative EBITDA margin points to a heavy operating expense load, not a cost-of-revenue problem, which means the business still needs scale discipline before those gross profits can reach equity holders.
Leverage
| Company | Total Debt/Equity % (mrq) | Current Ratio (mrq) | Total Debt (mrq, USD Mil) | Free Cash Flow TTM (USD Mil) | Net Debt/EBITDA (TTM) | FCF Margin % (TTM) |
|---|---|---|---|---|---|---|
| BMNR | 0 | 36.7 | 1.3 | -518.1 | 1.2 | -846.6% |
| MARA | 105.6 | 1.8 | 2,464 | -531.1 | -2.6 | -61.2% |
| RIOT | 36.6 | 1.1 | 877.2 | -445.9 | -2.1 | -68.2% |
| MSTR | 18.1 | 6.1 | 8,257.4 | -8,699.5 | -0.4 | -1,773.7% |
| CLSK | 181.6 | 8.3 | 1,790.7 | -300.7 | -3.9 | -40.6% |
Source: Yahoo Finance
Leverage looks conservative on raw debt but weak on cash conversion: BMNR’s total debt/equity is 1.0% and net debt/EBITDA is 1.15x, both far cleaner than MARA’s 105.6% debt/equity and RIOT’s 36.6%, yet BMNR’s FCF margin is -846.6% versus MARA at -61.2%, RIOT at -68.2%, MSTR at -1,773.7%, and CLSK at -40.6%. The balance sheet is not the issue; the issue is that BMNR is burning $518.1M of free cash flow TTM, or about $0.86 per share, so the low debt load is a financing choice, not proof of self-funding economics. R’s lower leverage explains some of its valuation premium over BMNR in the broader peer set, but BMNR’s own cash burn is the more important issue here.
Conclusion
I would put my rating as a Sell because the company still needs to prove that the recent revenue jump can survive beyond a few quarters and turn into cash. The market is already giving credit for a much better operating model than the cash flow statement supports, and until that gap closes, I would stay cautious.
I would raise my rating more towards a Hold if quarterly revenue stays above $40M for two consecutive quarters and EBITDA margin moves toward positive territory, because that would show the business is finally converting scale into operating leverage rather than just into reported sales. A more convincing bull case would also require free cash flow turning positive, since that would mean the company is funding growth internally instead of leaning on dilution and related-party borrowing. If that happened while the current ratio stayed above 10x, meaning the company still had a wide short-term liquidity cushion, the balance sheet would stop being a distraction and the market could start valuing the business on earnings instead of hope.
I would move from Sell to Strong Sell if quarterly revenue falls back below $10M while operating cash flow stays negative, because that would show the recent growth burst was not durable and the cash burn is still widening. The bigger downside trigger is another financing round that leans on preferred stock or insider-linked debt, since the company already has -$293.1M of operating cash flow TTM and -846.6% FCF margin TTM, which means any new capital raise would likely be dilutive rather than accretive. If EBITDA stays negative and the company cannot fund expansion internally, the equity remains exposed to repeated capital calls.
Weighing both paths, I think the bear case is more likely to show up first because the company still has to prove that its revenue step-up can hold and convert into cash. The market is already paying for a growth profile that has not yet reached self-funding status, so I would stay cautious until the cash flow line starts to confirm the top line.
What’s your take? I rated BitMine Immersion Technologies (BMNR) SELL above — but the goal here is to get this right, not just to publish an opinion. What would you add to this analysis, or which risk or catalyst do you think I’m under- or over-weighting? Tell me in the comments.
Sources
- SEC 10-K Annual Report — filed 2024-12-09
- SEC 8-K Filing (2024-12-11)
- SEC 8-K Filing (2024-11-20)
- SEC 8-K Filing (2024-11-07)
- SEC 8-K Filing (2024-07-18)
- SEC 8-K Filing (2024-05-07)
- SEC 8-K Filing (2024-02-28)
- SEC Form 4 Insider Transaction (2026-04-23)
- SEC Form 4 Insider Transaction (2026-04-23)
- SEC Form 4 Insider Transaction (2026-04-23)
- SEC 10-K Annual Report — FY2024
- SEC 10-K Annual Report — FY2023
- SEC 10-K Annual Report — FY2022
- SEC 10-K Annual Report — FY2021
Data sourced from Yahoo Finance and SEC EDGAR. Not investment advice.
Leave a Comment