
| Company | Jul 25 | Aug 25 | Sep 25 | Oct 25 | Nov 25 | Dec 25 | Jan 26 | Feb 26 | Mar 26 | Apr 26 | May 26 | Jun 26 | 12-Mo |
|---|---|---|---|---|---|---|---|---|---|---|---|---|---|
| RDW | -12% | -38% | +1% | -12% | -30% | +38% | +55% | -23% | -6% | +8% | +167% | -50% | -25% |
| AVAV | -6% | -10% | +30% | +17% | -24% | -13% | +15% | -9% | -27% | +7% | +6% | -20% | -42% |
| KTOS | +26% | +12% | +39% | -1% | -16% | -0% | +36% | -16% | -18% | -11% | +2% | -22% | +7% |
| RKLB | +28% | +6% | -1% | +31% | -33% | +66% | +15% | -14% | -7% | +28% | +74% | -29% | +184% |
| PL | +2% | +13% | +83% | +4% | -12% | +66% | +27% | -3% | +16% | +32% | +38% | -35% | +443% |
| LUNR | +3% | -21% | +20% | +13% | -20% | +71% | +17% | -13% | +13% | +37% | +73% | -51% | +97% |
Source: Yahoo Finance monthly adjusted close.
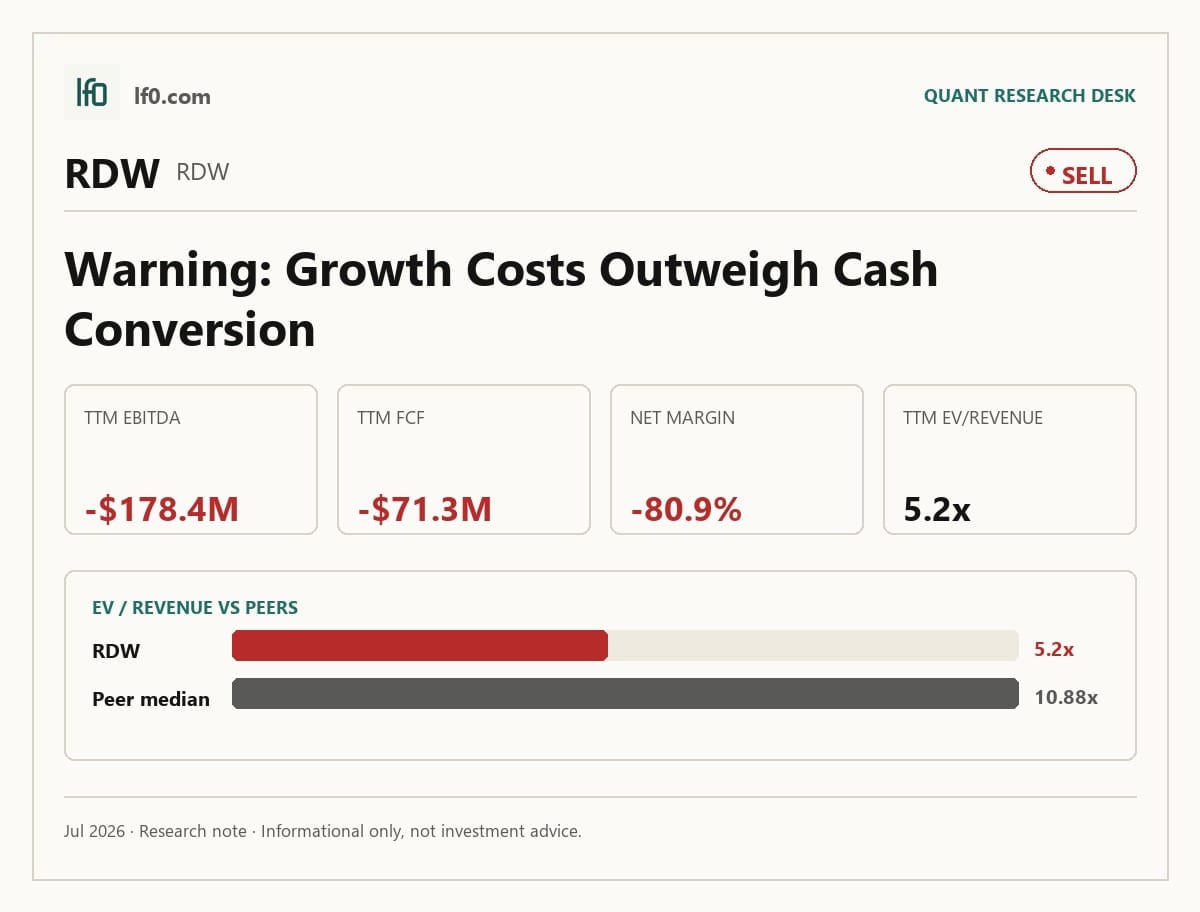
Executive Summary
Rating: SELL | RDW
Measured from adjusted close on 2026-07-22 to 2026-10-21. Sell ratings are correct when the stock falls; Hold is tracked as a +/-10% range. Daily-close data, not intraday. Calls are tracked for 182 days from publication, then frozen as a final record.
I would put my rating as a Sell because Redwire is still asking the market to pay a 5.2x EV/revenue multiple for a business with a -48.1% EBITDA margin and -19.2% free cash flow margin, so the valuation already assumes a recovery that the operating data has not yet earned. The company does have real assets behind it: $411.2M of contracted backlog, flight heritage, and a broader defense-and-space platform after Edge Autonomy. But that strength is being offset by persistent cash burn and a capital structure that still needs careful management. I would move from Sell toward Hold only if quarterly revenue stays above $100M and EBITDA margin moves toward a positive operating margin, because that would show the platform is starting to convert scale into cash rather than just adding complexity.
Company Profile
Redwire Corp. is an integrated space and defense technology company that sells spacecraft, solar arrays, docking systems, microgravity payloads, uncrewed aerial systems, sensors, and radio frequency payloads to civil, national security, and commercial customers. It earns revenue from firm-funded contracts, bundled system sales, and mission solutions across space and airborne platforms. Founded in 2020 by AE Industrial Partners Fund II, LP, it went public in 2021 through a reverse recapitalization with Genesis Park Acquisition Corp. and has completed 11 acquisitions since March 2020, including Edge Autonomy in 2025. The company operates from 28 locations in North America and Europe and serves customers in about 80 countries. Redwire is listed on the New York Stock Exchange under RDW.
Economic Moat
Business Model
The clearest part of Redwire’s moat is its installed base of flight-proven hardware and software, which I think is hard for a rival to replicate quickly because space customers buy mission assurance, not just parts. That shows up in products and programs such as the Roll Out Solar Array, a patented deployable solar array system, the International Berthing and Docking Mechanism, a computer-controlled docking system, and the SabreSat, Phantom, Hammerhead, Thresher, and Mako spacecraft platforms. Heritage on the International Space Station, ESA PROBA missions, NASA DART, Artemis I, and Space Force GPS gives Redwire credibility that new entrants cannot shortcut. The digital engineering suite and the 42 PIL BOXes launched through December 31, 2025 also deepen customer integration, especially in microgravity payloads.
The business has broadened materially over time. In 2022, Redwire still looked mainly like a space infrastructure supplier, but by 2025 it had moved into a wider mix of avionics, sensors, RF systems, platforms, payloads, and microgravity. Today it operates two reportable segments, Space and Defense Tech, so the company is no longer just a space components supplier but a multi-domain technology platform. In my view, that wider footprint is strategically better than the old model because it gives Redwire more end markets and more bundled offerings, even if it also raises integration risk.
Business & Operating Risks
The most material disclosed risk is Redwire’s dependence on U.S. government contracts that are often only partially funded, can be terminated, and are heavily regulated and audited. That can turn a delayed appropriation or a negative audit into lost revenue, refunded costs, or a stop-work order. The company also needs facility security clearance under NISPOM to do classified work, and losing that clearance would block new classified contracts. With $411.2M of contracted backlog as of December 31, 2025, those risks would show up quickly in revenue timing and cash flow if funding or clearance were disrupted.
Fixed-price contract exposure is the other major pressure point. Redwire says cost overruns, inflation, and technical problems can make firm fixed-price work unprofitable, and it may spend before final contract receipt. That matters because the company is still burning cash, so a bad program can hit both margin and working capital at the same time. Integration risk around Edge Autonomy is also real, especially given the material weaknesses in internal control over financial reporting and the adverse internal-control opinion as of December 31, 2025. Taken together, these risks do not break the moat itself, but they do threaten the company’s ability to turn that moat into reliable cash generation.
Management Discussion & Analysis
Management is clearly trying to respond to the integration and funding strain by using equity, refinancing, and backlog growth to buy time. The 2025 financing activity included net proceeds from common stock, equity offerings, and warrant exercises of $518.4M, while debt actions were net repayments of $43M. That tells me management is protecting liquidity rather than leaning on leverage, which is sensible for a business still working through acquisition costs and control issues. The company also ended 2025 with $411.2M of contracted backlog and a 1.32 book-to-bill ratio for the LTM ended December 31, 2025, so the order book is moving in the right direction even though the income statement has not yet caught up.
The problem is that the operating data still looks expensive to execute. Gross margin fell to 5.0% in 2025 from 15.0% in 2024, operating loss widened, and the company recorded $54.5M of net unfavorable EAC adjustments, $34.7M of impairment expense, and $47.1M of equity-based compensation. I read that as management trying to scale a broader platform while still absorbing acquisition and accounting noise. The strategy is coherent, but the numbers show it is not yet self-funding.
Recent Events
The February 20, 2026 Amended and Restated Credit Agreement is the most important recent event because it replaced the prior Adams Street facility with a new JPMorgan Credit Agreement and a revolving credit facility maturing May 31, 2029. That pushes out the refinancing wall and gives Redwire more time to integrate Edge Autonomy without a near-term maturity overhang. The company also repaid the Adams Street Credit Agreement in full on the same date, which is a clean de-risking step.
Board changes on March 12, 2026 also matter. Frank Calvelli joined the board, Dorothy D. Hayes became chair of the Audit Committee, and General James McConville joined that committee. Calvelli’s background in U.S. Space Force acquisition and the National Reconnaissance Office should help with defense procurement credibility, so I see the change as supportive of the moat rather than cosmetic. On May 20, 2026, AE Industrial Partners converted its remaining preferred stock into 15.2M common shares, which simplified the capital structure and removed a legacy overhang.
Financial Analysis
Growth
RDW — Financial Growth (Quarterly, USD Mil)
| Metric | 2025-03-31 | 2025-06-30 | 2025-09-30 | 2025-12-31 | 2026-03-31 |
|---|---|---|---|---|---|
| REVENUE (USD Mil) | 61.4 | 61.8 | 103.4 | 108.8 | 97 |
| EBIT (USD Mil) | 0.5 | -105.8 | -28 | -78.5 | -73.4 |
| EBITDA (USD Mil) | 3.5 | -100.8 | -15.9 | -66.1 | -62.1 |
| NET INCOME (USD Mil) | -2.9 | -97 | -41.2 | -85.5 | -76.5 |
| DILUTED EPS | -0.1 | -1.4 | -0.3 | -0.6 | -0.4 |
Source: Yahoo Finance — Quarterly Financial Statements
Revenue rose to $97M in Q1 2026 from $61.4M in Q1 2025, which is a strong top-line step-up and consistent with the broader platform Redwire has been building. The second half of 2025 was even stronger, with revenue moving from $61.8M in Q2 to $103M in Q3 and $109M in Q4, so I would not read the Q1 2026 pullback as a thesis break. What matters is that the growth is now large enough to matter, but not yet stable enough to prove operating leverage.
EBITDA, however, moved in the wrong direction. It went from $3.51M in Q1 2025 to -$62.1M in Q1 2026, which tells me the company is still absorbing acquisition costs, program mix pressure, and overhead faster than revenue is scaling. That is the key cross-check against the moat: Redwire has the commercial reach to grow, but it has not yet shown that the broader platform can grow without dragging margins down.
Profitability
RDW — Profitability (TTM)
| Metric | TTM |
|---|---|
| Operating Margin (TTM) | -71.8% |
| Net Margin (TTM) | -80.9% |
| Return on Assets (TTM) | -15.0% |
| Return on Equity (TTM) | -48.7% |
| Gross Margin (TTM) | 12.9% |
| EBITDA Margin (TTM) | -48.1% |
Source: Yahoo Finance — Trailing Twelve Months (TTM)
Gross margin was 12.9% TTM, but operating margin was -71.8% and EBITDA margin was -48.1%, so overhead and execution costs are still overwhelming the gross profit layer. Net margin was -80.9%, which means the losses are not just an operating issue; they are still flowing all the way through the income statement. I would focus on operating margin first, because a move toward a positive operating margin would tell me the company is finally absorbing fixed costs rather than adding them.
Returns remain weak. Return on assets was -15% TTM and return on equity was -48.7% TTM, so the asset base is not yet producing acceptable returns. That gap is important because the company has already built scale; the next step is proving that scale can earn a return rather than simply supporting more revenue.
Valuation
RDW — Valuation Multiples
| Metric | Value |
|---|---|
| Market Cap (USD Mil) | 2,250 |
| Enterprise Value (USD Mil) | 1,928 |
| Forward P/E | -23 |
| Price/Sales (TTM) | 6.1 |
| Price/Book (mrq) | 1.7 |
| EV/Revenue | 5.2 |
| EV/EBITDA | -10.8 |
| Beta (5Y Monthly) | 3.02 |
| FCF Yield % (TTM) | -3.2% |
| Forward EPS (USD) | -0.4 |
| Analyst Target Price – Low (USD) | 7 |
| Analyst Target Price – Mean (USD) | 14.9 |
| Analyst Target Price – High (USD) | 24 |
| # Analyst Opinions | 8 |
Source: Yahoo Finance
Redwire trades on sales, not earnings, because trailing earnings are negative and forward EPS is still -0.41. The stock is valued at 5.2x EV/revenue, 6.06x price/sales, and -10.8x EV/EBITDA, so investors are paying for a recovery that has not yet shown up in profitability. With beta at 3.02 and FCF yield at -3.17%, the market is also charging a high volatility premium for a business that is still burning cash.
On the analysis here, I would put fair value in a range of roughly $8–$16 per share. That sits inside the analyst target range of $7–$24 and a little below the $14.9 mean, which makes sense to me because I weight the negative cash conversion and leverage profile more heavily than the consensus appears to. The implied EPS range is still negative, roughly around -0.5 to -0.3, which is in line with the company’s own forward EPS of -0.41 and weaker than the positive forward EPS profile of better-positioned peers. In other words, the market is already paying for a cleaner earnings path than Redwire has yet delivered.
Leverage
RDW — Leverage & Coverage (Quarterly)
| Metric | Value |
|---|---|
| Total Debt/Equity % (mrq) | 11.3 |
| Current Ratio (mrq) | 1.8 |
| Total Debt (mrq, USD Mil) | 131.9 |
| Levered Free Cash Flow (TTM, USD Mil) | -71.3 |
| Net Debt/EBITDA (TTM) | 0.1 |
| FCF Margin % (TTM) | -19.2% |
Source: Yahoo Finance — Quarterly Financial Statements
Redwire’s balance sheet is not stretched, but cash generation is still the weak link. Total debt/equity was 11.32% mrq, current ratio was 1.752x, and total debt was $131.9M, so near-term liquidity is adequate. The problem is that operating cash flow was -$138.9M TTM and levered free cash flow was -$71.32M TTM, which means the business is still consuming cash even with modest leverage.
Net debt/EBITDA was 0.071x TTM, so the company is not carrying a heavy debt burden relative to EBITDA, but that ratio is only comfortable because EBITDA is still negative. FCF margin was -19.23% TTM, which tells me the company is not yet converting revenue into cash at a rate that would support a higher valuation. The balance sheet gives Redwire time, but it does not solve the operating problem.
Insider Activity
The insider transaction record is net negative. AE RED HOLDINGS, LLC accounted for the bulk of the open-market activity, with 55 sales versus 3 purchases and about $1.2B of sales against $175127 of buying over the period shown. That concentration matters because it is not broad-based insider support; it is one dominant seller reducing exposure while outside shareholders remain fully exposed. I see that as a bearish signal on alignment.
Comparable Analysis
Growth
| Company | Revenue TTM (USD Mil) | Revenue Growth YoY % | Diluted EPS TTM |
|---|---|---|---|
| RDW | 371 | 57.9% | -2.8 |
| AVAV | 1,976.8 | 133.3% | -5.6 |
| KTOS | 1,415.2 | 22.6% | 0.2 |
| RKLB | 679.6 | 63.5% | -0.3 |
| PL | 335.6 | 42.1% | -1.2 |
| LUNR | 334.3 | 198.7% | -0.9 |
Source: Yahoo Finance
Redwire’s TTM revenue growth of 57.9% is solid, but it is not the best in the group. AVAV grew revenue 133.3%, LUNR grew 198.7%, and RKLB grew 63.5%, while KTOS was slower at 22.6% and PL at 42.1%. The key point is that Redwire is growing fast enough to matter, but not fast enough to justify a premium on growth alone.
Valuation
| Company | Forward P/E | EV/Revenue | EV/EBITDA | Price/Sales (TTM) | Price/Book (mrq) | Market Cap (USD Mil) | Enterprise Value (USD Mil) | Beta (5Y Monthly) | FCF Yield % (TTM) | Forward EPS | Analyst Target Price – Low | Analyst Target Price – Mean | Analyst Target Price – High | # Analyst Opinions |
|---|---|---|---|---|---|---|---|---|---|---|---|---|---|---|
| RDW | -23 | 5.2 | -10.8 | 6.1 | 1.7 | 2,250 | 1,928 | 3.02 | -3.2% | -0.4 | 7 | 14.9 | 24 | 8 |
| AVAV | 32.8 | 3.9 | 39.6 | 3.8 | 1.7 | 7,532 | 7,707 | 1.40 | -3.3% | 4.5 | 166 | 231.7 | 326 | 19 |
| KTOS | 44.2 | 5.5 | 95.6 | 6.4 | 2.6 | 9,040 | 7,761 | 1.07 | -1.2% | 1.1 | 60 | 109.3 | 150 | 21 |
| RKLB | 2,304 | 57 | -235.1 | 63.6 | 17.6 | 43,187 | 38,759 | 2.55 | -0.5% | 0 | 77 | 114.3 | 150 | 15 |
| PL | 6,936.9 | 23.8 | -154.5 | 24.5 | 18.6 | 8,233 | 7,990 | 2.07 | 1.0% | 0 | 25 | 40.1 | 53 | 10 |
| LUNR | -292.8 | 10.9 | -45.1 | 7 | -7 | 2,349 | 3,638 | 1.78 | -1.4% | -0.1 | 11 | 40.8 | 75 | 9 |
Source: Yahoo Finance
Redwire trades at 5.2x EV/revenue and 6.06x price/sales, which is below RKLB’s 57.0x and 63.6x but above AVAV’s 3.9x and 3.8x. KTOS is close at 5.5x EV/revenue and 6.4x price/sales, but KTOS also has positive net income and positive operating margin, so the comparison is not flattering for Redwire. The market is paying Redwire more like a profitable defense name than a cash-burning one, which is why I think the current multiple already discounts a lot of future improvement.
Profitability
| Company | Operating Margin (TTM) | Net Margin (TTM) | Return on Assets (TTM) | Return on Equity (TTM) | Gross Margin (TTM) | EBITDA Margin (TTM) |
|---|---|---|---|---|---|---|
| RDW | -71.8% | -80.9% | -15.0% | -48.7% | 12.9% | -48.1% |
| AVAV | 2.8% | -13.4% | -1.3% | -10.0% | 25.3% | 9.8% |
| KTOS | 1.8% | 2.1% | 0.6% | 1.2% | 22.9% | 5.7% |
| RKLB | -22.4% | -26.9% | -6.6% | -13.5% | 36.6% | -24.2% |
| PL | -30.5% | -111.2% | -5.9% | -84.0% | 55.6% | -15.4% |
| LUNR | -10.3% | -32.7% | -5.4% | -30.3% | 9.7% | -24.1% |
Source: Yahoo Finance
Redwire’s gross margin of 12.9%, EBITDA margin of -48.1%, operating margin of -71.8%, and net margin of -80.9% are all well below AVAV and KTOS. KTOS, for example, has a 22.9% gross margin, 5.7% EBITDA margin, 1.8% operating margin, and 2.1% net margin, which shows what a more mature defense platform can look like. Redwire’s margin profile is closer to the weaker space names than to the profitable defense peers, so the earnings gap is still wide.
Leverage
| Company | Total Debt/Equity % (mrq) | Current Ratio (mrq) | Total Debt (mrq, USD Mil) | Free Cash Flow TTM (USD Mil) | Net Debt/EBITDA (TTM) | FCF Margin % (TTM) |
|---|---|---|---|---|---|---|
| RDW | 11.3 | 1.8 | 131.9 | -71.3 | 0.1 | -19.2% |
| AVAV | 19 | 4.3 | 834.8 | -251.4 | 1 | -12.7% |
| KTOS | 5.4 | 5.6 | 185.4 | -106.7 | -15.8 | -7.5% |
| RKLB | 6.1 | 4.5 | 138.7 | -215 | 7.6 | -31.6% |
| PL | 110 | 2.8 | 488 | 84.8 | 4.7 | 25.3% |
| LUNR | 62.3 | 1.2 | 455.2 | -32.1 | -2.8 | -9.6% |
Source: Yahoo Finance
Redwire’s debt/equity of 11.32% is modest versus AVAV at 19.0% and far below PL at 110.0% or LUNR at 62.3%, and its current ratio of 1.752x is also acceptable. The catch is cash flow: Redwire’s FCF margin is -19.23%, while PL is positive at 25.3% and KTOS is less negative at -7.5%. That is the connection that matters to me: Redwire’s leverage looks manageable only because the balance sheet is still relatively clean, not because the business is generating enough cash to support a higher valuation.
Conclusion
I would put my rating as a Sell because the core tension in this name is still unresolved: Redwire has enough backlog, revenue scale, and strategic breadth to look interesting, but the company is not yet turning that scale into positive operating cash flow. The latest numbers show why I am cautious. Revenue reached $97M in Q1 2026 and backlog stood at $411.2M, yet EBITDA margin remained deeply negative and free cash flow stayed negative, so the market is still paying for a turnaround that has not shown up in the cash metrics.
I would raise my rating more toward a Buy if Redwire can hold quarterly revenue above $100M for two straight quarters and push EBITDA toward a positive operating margin, because that would tell me the broader platform is finally absorbing fixed costs and converting backlog into earnings. If that happened, the current 5.2x EV/revenue multiple would look much more defensible. I would also want to see free cash flow move toward positive territory, because that is the cleanest proof that the business can fund itself rather than rely on financing.
I would move from Sell to Hold if the company keeps revenue above $100M but still cannot get operating margin close to breakeven, because that would at least show the top line is durable even if the margin recovery is slower than I want. I would move lower again if quarterly revenue slips below $80M for two straight quarters or backlog falls under $350M, since that would tell me the order book is no longer offsetting the integration burden. A fresh equity raise before operating cash flow turns positive would also be a negative signal, because it would confirm that the business still needs outside capital to bridge the gap.
Weighing both sides, I think the bear case is more likely to show up first because the company still has to prove that backlog converts into cash before the market gives it credit for the broader platform. The balance sheet is not broken, but until Redwire shows a sustained move toward positive operating margin and free cash flow, I do not think the stock deserves a higher rung than Sell.
What’s your take? I rated Redwire (RDW) SELL above — but the goal here is to get this right, not just to publish an opinion. What would you add to this analysis, or which risk or catalyst do you think I’m under- or over-weighting? Tell me in the comments.
Sources
- SEC 10-K Annual Report — filed 2026-02-27
- SEC 8-K Filing (2026-05-20)
- SEC 8-K Filing (2026-05-06)
- SEC 8-K Filing (2026-05-05)
- SEC 8-K Filing (2026-03-17)
- SEC 8-K Filing (2026-02-25)
- SEC 8-K Filing (2026-02-17)
- SEC Form 4 Insider Transaction (2026-05-26)
- SEC Form 4 Insider Transaction (2026-05-26)
- SEC Form 4 Insider Transaction (2026-05-26)
- SEC 10-K Annual Report — FY2026
- SEC 10-K Annual Report — FY2025
- SEC 10-K Annual Report — FY2024
- SEC 10-K Annual Report — FY2023
- SEC 10-K Annual Report — FY2022
Data sourced from Yahoo Finance and SEC EDGAR. Not investment advice.
Leave a Comment