
| Company | Sep 25 | Oct 25 | Nov 25 | Dec 25 | Jan 26 | Feb 26 | Mar 26 | Apr 26 | May 26 | Jun 26 | Jul 26 | Aug 26 | 12-Mo |
|---|---|---|---|---|---|---|---|---|---|---|---|---|---|
| OSCR | +14% | -5% | -0% | -20% | -0% | -5% | -16% | +61% | +20% | +28% | +9% | -4% | +80% |
| ELV | +2% | -2% | +7% | +4% | -1% | -7% | -8% | +29% | +4% | -1% | -3% | +4% | +26% |
| CI | -4% | -15% | +13% | -0% | -0% | +6% | -7% | +9% | -5% | -0% | +1% | -1% | -6% |
| CVS | +3% | +5% | +3% | -1% | -5% | +7% | -10% | +17% | +9% | +14% | +2% | -10% | +32% |
| UNH | +12% | -1% | -3% | +1% | -13% | +2% | -7% | +37% | +3% | +10% | -0% | -6% | +29% |
| HUM | -14% | +7% | -12% | +5% | -24% | -2% | -9% | +36% | +29% | +30% | -8% | +5% | +28% |
Source: Yahoo Finance monthly adjusted close.
Quick Thesis
- Rated Hold — fast growth and cash generation, but margins still need proof.
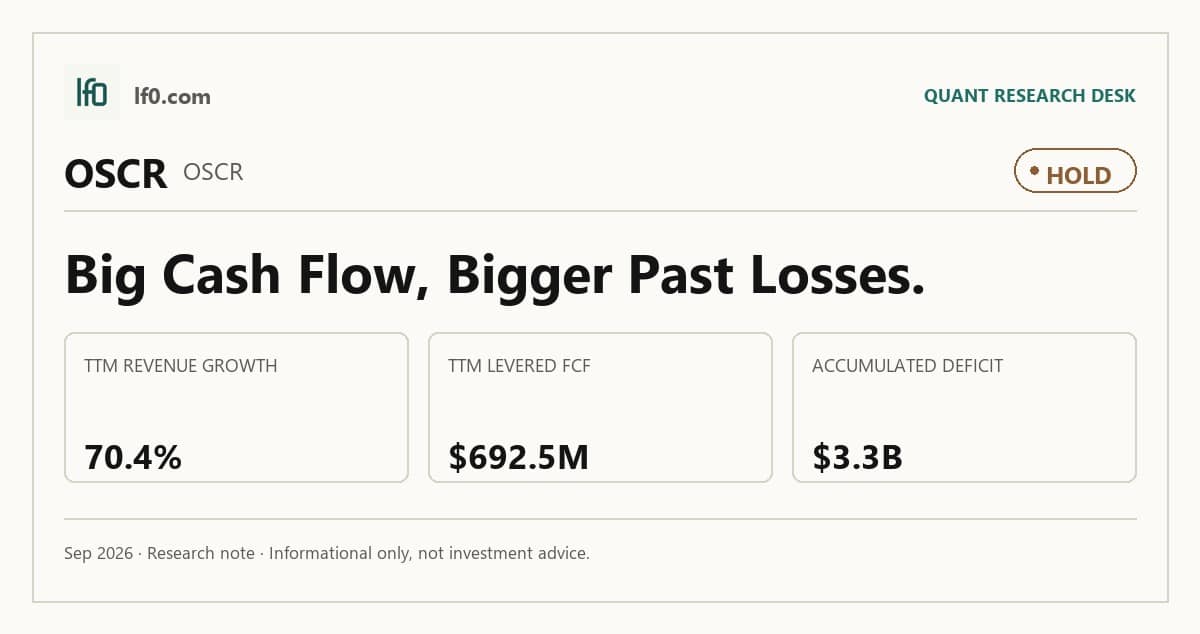
- Strongest financial point: 70.4% TTM revenue growth and $692.5M of levered free cash flow.
- Biggest risk: $482.1M of debt against a business still working through margin volatility.
- Valuation is mixed: 2.8x EV/EBITDA and 0.6x price/sales look reasonable, not cheap enough for a Buy.
- I would turn more constructive if operating margin stays above 8.0% for two more quarters.
Executive Summary
Rating: HOLD | OSCR
We’ll begin tracking this call’s performance since publication once sufficient adjusted-close data is available.
I would put my rating as a Hold because Oscar Health is growing quickly, but the market has already priced in a good part of that improvement and the margin profile still looks too uneven for a more aggressive call. The company’s 70.4% TTM revenue growth, 7.3% FCF yield, and $8.6B of cash against $482.1M of debt show real financial strength, yet the 4.3% EBITDA margin and 3.6% net margin tell me the earnings base is not fully durable.
I feel the key question is not whether the platform is scaling — it clearly is — but whether that scale turns into repeatable operating leverage rather than one strong period. I would move more toward a Buy if Oscar can hold revenue growth above 50.0% for two more quarters and keep EBITDA margin in the high single digits, because that would show the current earnings step-up is becoming structural rather than temporary.
Company Profile
Oscar Health Inc. was founded in 2012 and is listed on the New York Stock Exchange under OSCR. It sells Affordable Care Act individual and family health plans, plus employer coverage through Individual Coverage Health Reimbursement Arrangements, and it earns most of its revenue from policy premiums. As of December 31, 2025, it had 2.0 million effectuated members across 18 states for the 2025 policy year, expanding to 20 states for 2026. In 2025, it added Lucie, Inc., IHC Specialty Benefits, Inc., and Healthinsurance.org, LLC to support enrollment and brokerage, while its regulated insurance subsidiaries remain subject to state capital rules.
Economic Moat
Business Model
The cloud-native, end-to-end technology stack is the part of Oscar Health’s model I think is hardest for a well-funded competitor to copy within three years, because it links member data, provider data, utilization management, claims, billing, and benefits in one system. That platform supports approximately 2.0 million effectuated members and nearly 0.6 million client lives on Campaign Builder, so the edge is not just software code but operating data, workflow integration, and a live feedback loop that improves engagement and care routing. I also see a secondary edge in selective provider contracting, since Oscar works with technology-forward, high-brand-recognition health systems and uses exclusive provider organization plans in most markets, which helps steer members toward lower-cost, higher-quality care. The 2025 acquisitions of Lucie, IHC Specialty Benefits, and Healthinsurance.org extend that model into direct enrollment, brokerage, and consumer education, which broadens the funnel into the individual market.
The business has shifted materially since 2022. Back then, Oscar was still a smaller insurer with more than one million members, 607 counties, and 22 states, and it was only beginning to monetize +Oscar as a business process service and software as a service offering. By 2024, it had exited Medicare Advantage for plan year 2024, and by 2025 it had become a scaled individual-market platform with approximately 1.68 million effectuated members and a clearer focus on the ACA and +Oscar. That evolution strengthens the moat because the model is now concentrated where its technology, data, and member-engagement engine matter most, although the lack of patent protection means the edge still depends on execution rather than legal exclusivity.
Business & Operating Risks
The most material risk is that Oscar may not keep membership growth, pricing, and medical costs aligned while the ACA market itself is being reshaped by regulation. The risk factors in their SEC 10-K say 2025 direct policy premiums were about 97.0% subsidized by APTCs, and the eAPTCs expired at the end of 2025, so a subsidy rollback would hit enrollment and affordability at the same time. The filing also says the 2026 Revolving Credit Facility requires at least $200M of liquidity plus undrawn commitments through Q4 2026 and a maximum total net leverage ratio of 3.50:1.00 from Q1 2027, which means a membership or morbidity miss can quickly become a capital issue rather than just a P&L issue. New CMS Program Integrity Rules and the OBBBA are not generic policy noise either; the filing says they could reduce Marketplace participation, and if the stayed provisions are reinstated for the 2027 open enrollment period, Oscar may face a smaller, more volatile member pool with higher administrative friction.
A second risk is pricing and morbidity mismatch, which is more than a theoretical underwriting issue because the filing says Oscar sets premiums in advance and then relies on risk adjustment transfers that can move materially when market morbidity changes. The 10-K notes that in Q2 2025 and Q3 2025 Oscar received third-party reports showing higher-than-expected market risk scores, which forced it to increase its estimated risk adjustment transfer payable, and then did so again at December 31, 2025 when relative risk scores came in lower than expected. That is already materializing in the numbers here because the company’s profitability has not stabilized despite reaching profitability in 2024, and the filing itself says 2025 was not profitable on a consolidated net income or Adjusted EBITDA basis.
Provider and vendor concentration is the third clear pressure point. Oscar says its arrangements with CVS/Caremark for pharmacy claims and Optum for behavioral health are central to service delivery, and it also relies on AWS and Google Cloud Platform for its online app and core systems. If a vendor underperforms, terminates, or suffers a data incident, Oscar can face service disruption, higher costs, and member attrition. I do not think that risk directly threatens the technology moat itself, but it does threaten the operating reliability that moat depends on, so execution quality matters as much as the software stack.
Management Discussion & Analysis
Management is signaling a capital-light but balance-sheet-intensive pivot: it issued $410M of 2030 Convertible Senior Notes due 2030 at 2.25% and $305M of 2031 Convertible Senior Notes due 2031 at 7.25%, then replaced the old $115M revolving facility with a $475M secured three-year revolving credit facility on February 6, 2026. That mix pushes out near-term refinancing risk and gives Oscar more liquidity for growth, but it also tells me management is still using the capital structure to support expansion and regulatory capital needs. The November 2025 exchange of $250M of 2031 Notes into about 30.1M shares, plus the October 2025 conversion of $20M into about 2.4M shares, shows management is willing to use equity to reduce note overhang, which helps the balance sheet but also confirms dilution remains part of the financing toolkit.
Management is responding to the risks, but not all of them are solved. On operations, it is leaning on scale and cost discipline: total revenue rose to $11.7B in 2025 from $9.2B in 2024, while the SG&A expense ratio fell to 17.5% from 19.1%, which supports the claim that fixed-cost leverage is improving; the problem is that the Medical Loss Ratio rose to 87.4% from 81.7%, so revenue growth is still being absorbed by higher claims. The 2025 acquisitions of Lucie, IHC Specialty Benefits, and Healthinsurance.org are a sensible diversification step toward Individual Coverage Health Reimbursement Arrangements, but I view them as option value rather than a near-term earnings driver.
Management’s track record is mixed, which keeps the credibility score below the top tier. In 2024’s 10-K, management framed the business as a scaled insurance platform with technology leverage, and in 2025 it delivered membership growth to 2.0 million effectuated members and a lower SG&A ratio, so that part of the narrative matched results. However, the same filings also leaned on improving economics while 2025 ended with a $443.2M net loss, which means the operating leverage story has not yet translated into bottom-line durability. Tone versus numbers is the bigger issue: management has stayed constructive about scale, capital efficiency, and technology, but the 2025 results showed an 87.4% MLR, a $1.6B risk adjustment payment in the third quarter of 2025, and a net loss, so I do not yet think the execution record fully matches the optimism.
Recent Events
The most significant development I see is the May 29, 2026 transition of Mario Schlosser from President of Technology and Chief Technology Officer to Co-Founder & Advisor to the CEO, disclosed on June 2, 2026. He remains on the board, and the new role is explicitly tied to accelerating artificial intelligence and digital health, so I read this as a controlled handoff rather than a break with the company’s product strategy. It supports continuity in the technology agenda, but it also removes a day-to-day operating leader, which means execution now depends more heavily on the next layer of management.
The other material item is the April 21, 2026 board leadership update, disclosed the same day, which the company paired with a reaffirmation of full-year 2026 guidance ahead of the Medicarians conference. That combination matters because it signals stability at the governance level and no change in the near-term operating plan. The June 8, 2026 conference filing repeated the same message, with management planning a business update and another guidance reaffirmation, so I see a consistent attempt to keep the market anchored to the existing outlook rather than reset expectations.
Taken together, these 8-Ks leave the investment case materially unchanged: the technology transition is slightly supportive of the long-term digital-health thesis, while the repeated guidance reaffirmations reduce near-term uncertainty.
Financial Analysis
Growth
OSCR — Financial Growth (Quarterly, USD Mil)
| Metric | 2025-06-30 | 2025-09-30 | 2025-12-31 | 2026-03-31 | 2026-06-30 |
|---|---|---|---|---|---|
| REVENUE (USD Mil) | 2,863.9 | 2,986 | 2,805.2 | 4,647.2 | 4,880.2 |
| NET INCOME (USD Mil) | -228.4 | -137.4 | -352.6 | 679 | 361.8 |
| DILUTED EPS | -0.9 | -0.5 | -1.2 | 2.1 | 1.1 |
Source: Yahoo Finance — Quarterly Financial Statements
Oscar’s revenue accelerated sharply in Q1 2026: revenue was $4.6B in Q1 2026 versus $2.9B in Q2 2025 and $2.8B in Q4 2025, after the prior quarter’s weaker base. The year-over-year growth rate was 62.9% in Q1 2026, and that is the key signal for me because it shows the platform is still scaling fast rather than settling into a mature run rate. EBIT and net income also stepped up, with EBIT at $704.2M and net income at $679M in Q1 2026, but I would want one more quarter before treating that jump as fully durable.
Profitability
OSCR — Profitability (TTM)
| Metric | TTM |
|---|---|
| Operating Margin (TTM) | 8.0% |
| Net Margin (TTM) | 3.6% |
| Return on Assets (TTM) | 4.5% |
| Return on Equity (TTM) | 34.3% |
| Gross Margin (TTM) | 20.2% |
| EBITDA Margin (TTM) | 4.3% |
Source: Yahoo Finance — Trailing Twelve Months (TTM)
TTM operating margin was 8.0%, gross margin was 20.2%, EBITDA margin was 4.3%, net margin was 3.6%, return on assets was 4.5%, and return on equity was 34.3%. The spread from gross margin to operating margin is wide, which tells me Oscar is still carrying heavy operating expense relative to revenue, so the main issue is scale and overhead absorption rather than a broken cost of services model. The positive net margin and operating margin do show the company is now profitable, but the gap between gross profit and bottom-line earnings says profitability is still fragile and depends on continued expense discipline.
The ROE of 34.3% versus ROA of 4.5% shows returns are being amplified by leverage and a thin equity base rather than by broad asset productivity, so I do not treat the headline ROE as a clean measure of operating quality. The key threshold to watch is whether operating margin keeps widening while net margin stays positive, because that would show the business is moving from accounting profitability toward more durable earnings power. That is also the bridge back to the moat: the technology stack only matters financially if it keeps pushing operating leverage in the right direction.
Valuation
OSCR — Valuation Multiples
| Metric | Value |
|---|---|
| Current Share Price (USD) | 30.8 |
| Market Cap (USD Mil) | 9,503 |
| Enterprise Value (USD Mil) | 1,836 |
| Trailing P/E | 23.7 |
| Forward P/E | 14.2 |
| Price/Sales (TTM) | 0.6 |
| Price/Book (mrq) | 4.6 |
| EV/Revenue | 0.1 |
| EV/EBITDA | 2.8 |
| Beta (5Y Monthly) | 2.37 |
| FCF Yield % (TTM) | 7.3% |
| Forward EPS (USD) | 2.2 |
| Analyst Target Price – Low (USD) | 26 |
| Analyst Target Price – Mean (USD) | 35.4 |
| Analyst Target Price – High (USD) | 49 |
| # Analyst Opinions | 10 |
Source: Yahoo Finance
Oscar Health trades at 0.12x EV/Revenue and 0.62x price/sales on a current share price of $30.8, which is the right anchor here because trailing earnings are not the main valuation driver. That multiple tells me the market is pricing in only modest monetization of the platform, not a clean path to high-margin scale, even though the stock already sits 73.7% above its 52-week low of $10.69 and above both its $30.73 50-day moving average and $21.25 200-day moving average.
The rest of the stack is mixed. Trailing P/E is 23.7x and forward P/E is 14.2x, so the market is paying 14.2x next year’s earnings for a business that still has to prove durability. EV/EBITDA is 2.8x, but EBITDA margin is only 4.3% TTM, so that multiple is not yet a clean signal of mature cash generation. FCF yield is 7.3%, which is the strongest value marker here and suggests the equity is not priced for distress. Price/book is 4.6x, with book value per share of $6.66 and total cash per share of $27.75, so buyers today are paying well above net asset value for growth optionality. Beta is 2.4x, which means the stock should be treated as a high-volatility valuation bet.
On my read, fair value sits in a broad $26–$49 range, with the low end reflecting the current earnings multiple and the high end reflecting what the stock could deserve if margin expansion proves durable. That range sits around the analyst consensus band of $26–$49, with a $35.4 mean, so I do not think the market is wildly off; it is mostly debating how much of the growth and cash flow is sustainable. Forward EPS of 2.17 also sits below the peer group’s larger absolute earnings bases, which is another reason I think the stock should be valued on execution quality rather than on a simple size comparison.
Leverage
OSCR — Leverage & Coverage (Quarterly)
| Metric | Value |
|---|---|
| Total Debt/Equity % (mrq) | 23.5 |
| Current Ratio (mrq) | 1.1 |
| Total Debt (mrq, USD Mil) | 482.1 |
| Operating Cash Flow (TTM, USD Mil) | 4,418.6 |
| Levered Free Cash Flow (TTM, USD Mil) | 692.5 |
| Net Debt/EBITDA (TTM) | -12.3 |
| FCF Margin % (TTM) | 4.5% |
Source: Yahoo Finance — Quarterly Financial Statements
Oscar’s leverage is modest and the cash flow profile is supportive. Total debt/equity was 23.5%, current ratio was 1.1, and total debt was $482.1M, so the balance sheet is not stretched and near-term liquidity is adequate rather than tight. Operating cash flow was $4.4B and levered free cash flow was $692.5M, which shows the business is converting earnings into cash well enough to fund operations and still leave room after capital needs. Net debt/EBITDA was -12.3, meaning cash exceeds debt by a wide margin and refinancing risk is low in the near term. FCF margin was 4.5%, which is positive but not so high that I would call cash generation a structural advantage.
Insider Activity
The insider transaction record I see here is net selling, with 23 open-market sales versus 1 open-market purchase over the 2025-02-07 to 2026-06-04 window. The activity is broad rather than concentrated: the selling spans the CFO, chief legal officer, a director, and the president of Oscar Insurance, while the only buy is Mark Bertolini’s 1,000,000-share purchase on 2026-04-06. In my view, that is a bear signal because the open-market selling is widespread and the lone buy does not offset the heavier pattern of insider distribution.
Comparable Analysis
Growth
| Company | Revenue TTM (USD Mil) | Revenue Growth YoY % | Diluted EPS TTM |
|---|---|---|---|
| OSCR | 15,318.6 | 70.4% | 1.3 |
| ELV | 201,114 | 1.4% | 22.6 |
| CI | 282,382 | 6.7% | 24.2 |
| CVS | 412,645 | 7.1% | 3.8 |
| UNH | 450,526 | 0.4% | 15.6 |
| HUM | 145,679 | 26.2% | 10.6 |
Source: Yahoo Finance
Oscar’s revenue grew 70.4% TTM versus HUM at 26.2%, CVS at 7.1%, CI at 6.7%, ELV at 1.4%, and UNH at 0.4%, so the market is paying for a much faster top line than the managed-care incumbents deliver. I think that premium is partly justified because OSCR’s diluted EPS was 1.3 TTM and forward EPS is 2.2, which implies the growth is still converting into earnings rather than just scale for its own sake.
Valuation
| Company | Current Share Price (USD) | Trailing P/E | Forward P/E | EV/Revenue | EV/EBITDA | Price/Sales (TTM) | Price/Book (mrq) | Market Cap (USD Mil) | Enterprise Value (USD Mil) | Beta (5Y Monthly) | FCF Yield % (TTM) | Forward EPS | Analyst Target Price – Low | Analyst Target Price – Mean | Analyst Target Price – High | # Analyst Opinions |
|---|---|---|---|---|---|---|---|---|---|---|---|---|---|---|---|---|
| OSCR | 30.8 | 23.7 | 14.2 | 0.1 | 2.8 | 0.6 | 4.6 | 9,503 | 1,836 | 2.37 | 7.3% | 2.2 | 26 | 35.4 | 49 | 10 |
| ELV | 410.1 | 18.1 | 13.9 | 0.4 | 9.9 | 0.4 | 2 | 88,941 | 82,791 | 0.70 | 4.8% | 29.5 | 393 | 451.4 | 492 | 21 |
| CI | 275.2 | 11.4 | 8.2 | 0.3 | 7.7 | 0.3 | 1.7 | 72,714 | 97,651 | 0.32 | 11.0% | 33.5 | 290 | 339.4 | 400 | 25 |
| CVS | 88.5 | 23.4 | 10.4 | 0.4 | 10.6 | 0.3 | 1.4 | 113,185 | 176,169 | 0.58 | 7.1% | 8.5 | 103 | 116.3 | 148 | 25 |
| UNH | 377.6 | 24.3 | 16.7 | 0.9 | 14.5 | 0.8 | 3.5 | 338,977 | 387,665 | 0.62 | 7.2% | 22.6 | 380 | 481.7 | 529 | 25 |
| HUM | 383 | 36.2 | 23.1 | 0.3 | 10.4 | 0.3 | 2.4 | 45,991 | 37,314 | 0.74 | 4.2% | 16.6 | 280 | 419 | 513 | 23 |
Source: Yahoo Finance
Oscar’s 7.3% FCF yield sits above ELV at 4.8% and HUM at 4.2%, but below CI at 11.0%, CVS at 7.1%, and UNH at 7.2%, while its forward P/E of 14.2x is cheaper than HUM at 23.1x and UNH at 16.7x, but richer than CI at 8.2x and CVS at 10.4x. On a peer EV/Revenue range of 0.26x to 0.86x, OSCR’s 0.12x is far below the group, which is why I think the market is still discounting a lot of execution risk. A $1 investment a year ago would be worth $1.74 in OSCR versus $1.52 in HUM, $1.32 in CVS, $1.30 in UNH, $1.26 in ELV, and $0.98 in CI, so the stock has already rerated hard; that makes the current multiple look less like a bargain and more like a market that has started to price in the recovery.
Profitability
| Company | Operating Margin (TTM) | Net Margin (TTM) | Return on Assets (TTM) | Return on Equity (TTM) | Gross Margin (TTM) | EBITDA Margin (TTM) |
|---|---|---|---|---|---|---|
| OSCR | 8.0% | 3.6% | 4.5% | 34.3% | 20.2% | 4.3% |
| ELV | 4.6% | 2.5% | 3.8% | 11.1% | 26.0% | 4.1% |
| CI | 4.0% | 2.3% | 4.5% | 16.8% | 9.1% | 4.5% |
| CVS | 3.9% | 1.2% | 3.0% | 6.2% | 13.6% | 4.0% |
| UNH | 7.1% | 3.1% | 4.9% | 14.2% | 19.7% | 5.9% |
| HUM | 3.5% | 0.9% | 3.9% | 6.9% | 13.7% | 2.5% |
Source: Yahoo Finance
OSCR’s gross margin of 20.2% is above CVS at 13.6%, HUM at 13.7%, and CI at 9.1%, but its operating margin of 8.0% and EBITDA margin of 4.3% trail UNH at 7.1% and 5.9%, ELV at 4.6% and 4.1%, and CI at 4.0% and 4.5%. That pattern points more to scale and operating expense absorption than to a bad cost structure, which means the margin gap could narrow if OSCR keeps growing without a proportional jump in overhead. ROE of 34.3% is far above ELV at 11.1%, CI at 16.8%, CVS at 6.2%, UNH at 14.2%, and HUM at 6.9%, while ROA of 4.5% is broadly in line with ELV and CI, so the return profile is strong but amplified by a lightly levered capital structure.
Leverage
| Company | Total Debt/Equity % (mrq) | Current Ratio (mrq) | Total Debt (mrq, USD Mil) | Operating Cash Flow TTM (USD Mil) | Free Cash Flow TTM (USD Mil) | Net Debt/EBITDA (TTM) | FCF Margin % (TTM) |
|---|---|---|---|---|---|---|---|
| OSCR | 23.5 | 1.1 | 482.1 | 4,418.6 | 692.5 | -12.3 | 4.5% |
| ELV | 69 | 1.5 | 31,044 | 7,464 | 4,306.4 | -0.8 | 2.1% |
| CI | 74.3 | 0.8 | 31,878 | 10,277 | 7,980.1 | 1.9 | 2.8% |
| CVS | 95.5 | 0.9 | 76,306 | 14,780 | 8,076 | 3.7 | 2.0% |
| UNH | 69.2 | 0.8 | 73,328 | 27,017 | 24,272.2 | 1.6 | 5.4% |
| HUM | 76.5 | 1.7 | 14,744 | 2,539 | 1,941 | -2.5 | 1.3% |
Source: Yahoo Finance
Total debt/equity is 23.5% versus ELV at 69.0%, CI at 74.3%, CVS at 95.5%, UNH at 69.2%, and HUM at 76.5%, while net debt/EBITDA is -12.3x because cash exceeds debt by a wide margin. FCF margin is 4.5%, above ELV at 2.1%, CI at 2.8%, CVS at 2.0%, and HUM at 1.3%, so OSCR is funding growth from internally generated cash rather than balance-sheet strain. That lower leverage also helps explain why the stock can trade at a premium to some peers on forward earnings without needing a much higher multiple to justify it.
Conclusion
I would put my rating as a Hold because Oscar Health has already shown the two things I wanted to see most — fast revenue growth and positive free cash flow — but the margin profile is still not stable enough for me to call the earnings base durable. The tension in the story is that the moat looks real, the balance sheet is strong, and the platform is scaling, yet the market has already rewarded the stock with a 73.7% one-year gain, so the easy part of the rerating may already be behind it.
I would raise my rating more toward a Buy if Oscar can keep revenue growth above 50.0% for another two quarters and push EBITDA margin into the high single digits, because that would show the current scale-up is turning into operating leverage rather than just top-line expansion. On the current $15.3B revenue base, a move from 4.3% EBITDA margin to 8.0% would add roughly $550M of annual EBITDA, which would materially improve the case for a higher multiple and make the current valuation look conservative.
I would move from Hold to Sell if the next two quarters show revenue growth falling below 30.0% while EBITDA margin slips back under 3.0%, because that would tell me the platform is losing operating leverage just as the market is paying for it. A second warning sign would be a rise in net debt from its current negative 12.3x EBITDA position toward positive leverage, since that would mean the cash cushion is shrinking before the business has proven it can self-fund growth.
Weighing both sides, I think the bull case is more likely to show up first, but the stock has already captured a lot of that optimism. I am not bearish enough to sell because the balance sheet is strong and the growth engine is real, yet I am not ready to buy after a 73.7% one-year move until the margin profile catches up with the revenue line.
What to Watch Next
- Revenue growth above 50.0% for two more quarters — would support a move toward Buy.
- EBITDA margin in the high single digits — would show operating leverage is becoming durable.
- Net debt staying negative — would confirm the balance sheet remains a cushion, not a constraint.
- Operating margin holding above 8.0% — would support the case that profitability is repeatable.
- Revenue growth below 30.0% with EBITDA margin under 3.0% — would argue for a downgrade toward Sell.
What’s your take? I rated Oscar Health (OSCR) HOLD above — but the goal here is to get this right, not just to publish an opinion. What would you add to this analysis, or which risk or catalyst do you think I’m under- or over-weighting? Tell me in the comments.
Sources
- SEC 10-K Annual Report — filed 2026-02-13
- SEC 8-K Filing (2026-06-08)
- SEC 8-K Filing (2026-06-02)
- SEC 8-K Filing (2026-05-06)
- SEC 8-K Filing (2026-04-21)
- SEC 8-K Filing (2026-03-02)
- SEC 8-K Filing (2026-02-10)
- SEC Form 4 Insider Transaction (2026-06-08)
- SEC Form 4 Insider Transaction (2026-06-08)
- SEC Form 4 Insider Transaction (2026-06-08)
- SEC 10-K Annual Report — FY2026
- SEC 10-K Annual Report — FY2025
- SEC 10-K Annual Report — FY2024
- SEC 10-K Annual Report — FY2023
- SEC 10-K Annual Report — FY2022
Data sourced from Yahoo Finance and SEC EDGAR. Not investment advice.
Leave a Comment