
| Company | Sep 25 | Oct 25 | Nov 25 | Dec 25 | Jan 26 | Feb 26 | Mar 26 | Apr 26 | May 26 | Jun 26 | Jul 26 | Aug 26 | 12-Mo |
|---|---|---|---|---|---|---|---|---|---|---|---|---|---|
| BX | -0% | -14% | +1% | +5% | -8% | -19% | +1% | +9% | -6% | +1% | +9% | +13% | -13% |
| APO | -2% | -7% | +6% | +10% | -7% | -22% | +7% | +16% | +0% | -8% | +6% | +9% | +2% |
| KKR | -7% | -9% | +4% | +4% | -10% | -23% | +5% | +13% | -8% | -4% | +11% | +8% | -21% |
| ARES | -10% | -7% | +5% | +4% | -7% | -25% | -1% | +8% | +9% | -13% | +15% | +12% | -17% |
Source: Yahoo Finance monthly adjusted close.
Quick Thesis
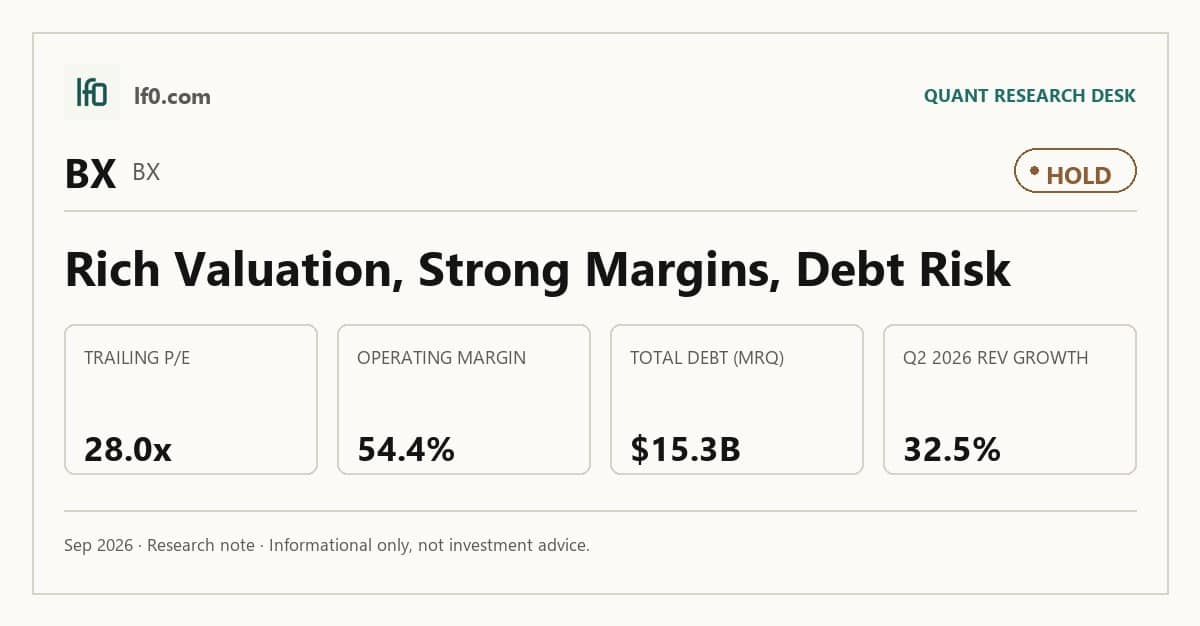
- Rated Hold — quality platform, but valuation already discounts a strong rebound.
- Strongest point: 54.4% TTM operating margin and 31.4% TTM ROE.
- Main risk: $15.3B of debt with a 0.9x current ratio.
- Valuation looks rich at 28.0x trailing P/E and 16.7x forward P/E.
- I would raise the rating if fee-earning AUM moves above $1T and margins stay above 50%.
Executive Summary
Rating: HOLD | BX
We’ll begin tracking this call’s performance since publication once sufficient adjusted-close data is available.
I would put my rating as a Hold because Blackstone’s scale and profitability are excellent, but the stock already prices in a durable recovery in fee and realization income. The platform is still the best part of the story: fee-earning assets reached $921.7B in 2025, and TTM operating margin was 54.4%, which tells me the franchise converts scale into earnings very efficiently. The issue is not business quality; it is that the shares trade at 28.0x trailing P/E and 16.7x forward P/E, so the market is already paying for a lot of good news.
I would become more constructive if fee-earning assets move above $1T, meaning the recurring fee base is still expanding, and if Credit & Insurance keeps compounding near the 37.0% 2025 segment distributable earnings growth rate. If that happens while operating margin stays above 50%, I would view the current multiple as easier to defend. For now, I think the burden of proof remains on the next few quarters.
Company Profile
Blackstone is the world’s largest alternative asset manager, with $1.3T of assets under management as of December 31, 2025. It earns management fees and performance revenues across real estate, private equity, credit and insurance, and multi-asset investing, serving pension funds, insurers, sovereign wealth funds, and individual investors.
The firm operates globally from New York and other offices, with about 5,285 employees and 268 senior managing directors at year-end 2025. Its real estate business managed $319.3B of assets, private equity $416.4B, credit and insurance $443.0B, and multi-asset investing $96.2B, which shows a broad platform rather than a single-product manager. Blackstone also has a growing private wealth channel and perpetual capital vehicles such as Blackstone Real Estate Income Trust, Inc. (BREIT), a non-listed real estate investment trust, and Blackstone Private Credit Fund (BCRED), a private credit fund.
Economic Moat
Business Model
Blackstone’s scale in alternative assets is the hardest thing for a well-funded rival to copy quickly. Total assets under management rose to more than $1.3T as of December 31, 2025 from more than $880.9B as of December 31, 2021, and that larger platform gives the firm more product breadth, more fundraising reach, and more places to recycle relationships across real estate, private equity, credit, and multi-asset investing. In my view, that scale is difficult to replicate within a few years because it depends on decades of performance history, distribution, and client trust, not just capital.
A second layer is the mix shift toward perpetual capital strategies and private wealth. In the current 10-K, Blackstone says perpetual capital now includes BREIT, BEPIF, BIP, BXPE, BXINFRA, BXSL, BCRED, BXMT, and insurance assets, while private wealth capital has become an increasing portion of total assets under management. That matters because it makes fee streams less dependent on fundraising cycles and gives the firm a longer-duration asset base than a traditional drawdown manager.
The business has also broadened materially over five years. In 2021’s 10-K, Blackstone reported four segments of Real Estate, Private Equity, Hedge Fund Solutions, and Credit & Insurance; today it reports Real Estate, Private Equity, Credit & Insurance, and Multi-Asset Investing. That change reflects the addition of a dedicated multi-asset platform and a more explicit push into private wealth, which means the firm is no longer just an institutional alternatives manager but a broader distribution platform. Blackstone also grew from approximately 3,795 employees in December 2021 to approximately 5,285 employees in December 2025, while Real Estate AUM moved from $279.5B to $319.3B and Credit & Insurance AUM reached $443B. In my view, that evolution makes the model structurally stronger than five years ago because the firm now has more fee-bearing capital, more recurring capital, and more channels to gather it.
Business & Operating Risks
The most material risk is the one Blackstone cannot control: difficult market, economic and geopolitical conditions can reduce fund capital raising, deployment, and exits, which the risk factors in its SEC 10-K say could materially reduce revenue, earnings and cash flow. That is not abstract for a manager whose economics depend on fee-earning assets and realizations, and the current financial data already shows the sensitivity through volatile performance revenues and a February 2026 draw of $900.0M on the Revolving Credit Facility, which suggests liquidity planning is already being used as a buffer. The same filing also flags a slower-than-expected decline in interest rates as a drag on real estate valuations and fundraising, and that is consistent with the pressure in office and other long-duration real assets.
A second risk is capital deployment. The filing says revenue is exposed if perpetual capital vehicles are unable to deploy capital at a sufficient pace, and that risk is more than theoretical because high prices, tougher financing, and regulatory review can slow deployment. The current article’s financial data shows $7.1B of other investments and $2.6B of cash and cash equivalents, so idle capital can become a drag if transaction volume stays soft. The risk does not threaten the moat directly, but it can delay the fee conversion that makes the scale advantage visible in earnings.
Third, Blackstone’s earnings are exposed to performance revenues and carry timing. The filing says revenue, earnings, net income, and cash flow can vary materially because incentive income is paid at different frequencies and only after vehicles clear return thresholds or high-water marks. That variability is already visible in the financials, where cash generation depends on realizations rather than a smooth quarterly annuity, so the risk has clearly shown up in earnings volatility rather than remaining a hypothetical disclosure.
The disclosed risks do not break the moat, but they do test whether Blackstone can keep turning its scale advantage into stable fee and performance income through a tougher macro backdrop.
Management Discussion & Analysis
Management is responding to those risks by extending liquidity and keeping capital allocation flexible. Blackstone extended the $4.325B Revolving Credit Facility to October 16, 2030 and issued $600M of 4.300% senior notes due November 3, 2030 plus $600M of 4.950% senior notes due February 15, 2036, which pushes refinancing risk out but does not reduce the $12.4B of operating borrowings outstanding as of December 31, 2025. The use of the net proceeds for general corporate purposes points to balance-sheet flexibility rather than a specific deleveraging plan.
Capital allocation still leans toward growth and fund support. Blackstone had $6.5B of remaining capital commitments to its own funds and other vehicles as of December 31, 2025, while the board-authorized repurchase program had $1.7B remaining after only $122.6M of buybacks in 2025. To me, that says repurchases are secondary to funding the platform and do not yet look like the main use of cash. The operating backdrop is constructive for fee growth because total assets under management rose to $1,274.9B and fee-earning assets under management rose to $921.7B, but the narrative is more confident than the segment mix suggests: Real Estate Segment Distributable Earnings rose only 10.0% in 2025 and the filing itself notes more challenging fundamentals in life sciences office, student housing and select logistics holdings.
Credit & Insurance is the clearest growth engine, with Segment Distributable Earnings up 37.0% in 2025 and BCRED raising over $14B. That is the part of the business management is leaning on most heavily, and it is also the cleanest evidence that the firm is responding to the deployment risk identified above by pushing into areas where demand is still strong.
Recent Events
The January 29, 2026 earnings release confirmed Blackstone’s full-year 2025 results and set the baseline for the new year. That filing is routine rather than transformative, but it matters because it shows the company entered 2026 with the same core earnings engine intact.
The more interesting follow-up came on March 24, 2026, when Blackstone posted a preliminary estimate of revenue tied to realization activity for January 1, 2026 through March 24, 2026. In my view, that signals the monetization engine is still active, which supports the firm’s fee and performance-related earnings model, but it does not by itself prove that realizations will sustain at the same pace through the rest of 2026.
On April 23, 2026, Blackstone reported first-quarter 2026 results. Taken together, the three filings point in the same direction: the investment case is being supported by continued realization activity and another quarterly update, but the disclosures are still operating updates rather than evidence of a new strategic catalyst.
Financial Analysis
Growth
BX — Financial Growth (Quarterly, USD Mil)
| Metric | 2025-06-30 | 2025-09-30 | 2025-12-31 | 2026-03-31 | 2026-06-30 |
|---|---|---|---|---|---|
| REVENUE (USD Mil) | 3,161.2 | 2,685.9 | 3,736.5 | 3,002.8 | 4,187.9 |
| NET INCOME (USD Mil) | 764.2 | 624.9 | 1,015.2 | 649.7 | 1,229.2 |
| DILUTED EPS | 1 | 0.8 | 1.3 | 0.8 | 1.5 |
Source: Yahoo Finance — Quarterly Financial Statements
Blackstone’s revenue moved from $3.2B in 2025-06-30 to $4.2B in 2026-06-30, while net income rose from $764.2M to $1.2B over the same span. That is a strong year-over-year improvement, and it tells me the platform is still capable of converting a better capital-markets backdrop into higher earnings. Diluted EPS increased from 1.0 to 1.5, so the earnings leverage is real rather than just a top-line effect.
The quarter-to-quarter path was choppy, with revenue dipping to $3B in 2026-03-31 before rebounding sharply. I read that as cyclical rather than structural, which is normal for a manager whose performance revenues depend on realizations and market activity. The key point is that the latest quarter shows the earnings engine can reaccelerate when the backdrop improves.
Profitability
BX — Profitability (TTM)
| Metric | TTM |
|---|---|
| Operating Margin (TTM) | 54.4% |
| Net Margin (TTM) | 22.7% |
| Return on Assets (TTM) | 14.3% |
| Return on Equity (TTM) | 31.4% |
| Gross Margin (TTM) | 100.0% |
Source: Yahoo Finance — Trailing Twelve Months (TTM)
Blackstone’s TTM operating margin of 54.4% and net margin of 22.7% point to a fee-heavy model with very little direct cost of revenue, so the real question is not whether the platform can gross profit but how much of that fee income survives after compensation and operating expense. TTM return on assets of 14.3% and TTM return on equity of 31.4% are both strong, and the spread between them tells me leverage and balance-sheet structure are amplifying returns rather than pure asset productivity alone.
Gross margin of 100.0% reinforces that the business is not constrained by product cost. The more important watch item is whether operating margin stays above 50% and net margin keeps tracking it, because that would confirm durable fee conversion rather than one-off performance income. Those margins are also consistent with the scale advantage described in the moat section: Blackstone’s platform is large enough to turn incremental fee revenue into very high incremental profit.
Valuation
BX — Valuation Multiples
| Metric | Value |
|---|---|
| Market Cap (USD Mil) | 149,741 |
| Enterprise Value (USD Mil) | 124,811 |
| Trailing P/E | 28 |
| Forward P/E | 16.7 |
| Price/Sales (TTM) | 9.7 |
| Price/Book (mrq) | 11.1 |
| EV/Revenue | 8.1 |
| EV/EBITDA | — |
| Beta (5Y Monthly) | 1.56 |
| FCF Yield % (TTM) | — |
| Forward EPS (USD) | 7.5 |
| Analyst Target Price – Low (USD) | 119 |
| Analyst Target Price – Mean (USD) | 144.4 |
| Analyst Target Price – High (USD) | 184 |
| # Analyst Opinions | 21 |
Source: Yahoo Finance
Blackstone trades at 28.0x trailing P/E and 16.7x forward P/E, with a 9.7x price to sales multiple and an 11.1x price to book ratio. The more decision-relevant anchor here is the 9.7x price to sales multiple, because Blackstone’s fee and performance revenue mix makes reported earnings more cyclical than the top line. At 9.7x sales, the market is pricing in sustained high fee-related earnings power and continued monetization of performance revenues, not a flat asset-management cycle.
On the analysis here, I would put fair value in a range of $125-$155, which is broadly in line with the $144.4 analyst mean target and sits inside the $119 to $184 analyst range from 21 opinions. That range is not a guarantee; it reflects a view that Blackstone deserves a premium multiple for its scale and profitability, but not a full rerating beyond the current consensus without clearer evidence that fee-earning assets can move above $1T and stay there. The implied forward EPS range is about $7.2-$7.8, which is close to the table’s 7.5 forward EPS and suggests the market is already paying for a fairly full earnings recovery. Relative to peers, that EPS profile looks rich versus KKR’s 7.4 and ARES’s 7.2 only if Blackstone keeps its margin edge; otherwise the multiple is harder to defend.
The stock also screens at 8.1x enterprise value to revenue, which is a rich multiple for a business tied to capital-markets conditions and fund realizations. Trailing P/E at 28.0x and forward P/E at 16.7x imply the market expects earnings to normalize sharply upward over the next year, so today’s multiple is only justified if that step-up actually lands. Beta is 1.6x, which tells you the shares should remain more volatile than the market. Shares trade around $199.5, derived from $149.7B market cap and 750.6M shares outstanding, so investors are paying a premium price for a business the market expects to keep compounding. Overall, the valuation is a hold rather than a buy.
Leverage
BX — Leverage & Coverage (Quarterly)
| Metric | Value |
|---|---|
| Total Debt/Equity % (mrq) | 68.2 |
| Current Ratio (mrq) | 0.9 |
| Total Debt (mrq, USD Mil) | 15,296.1 |
| Operating Cash Flow (TTM, USD Mil) | 5,597.9 |
Source: Yahoo Finance — Quarterly Financial Statements
Blackstone’s leverage is moderate, not stretched: Total Debt/Equity was 68.2% in mrq, Current Ratio was 0.9x in mrq, and Total Debt was $15.3B in mrq. Operating Cash Flow was $5.6B in TTM, which gives the balance sheet real liquidity support even though the current ratio sits below 1.0x. Levered Free Cash Flow, Net Debt/EBITDA, and FCF Margin % were not provided in the leverage table, so I am not inferring them.
The cash flow profile is the more important signal here. $5.6B of TTM operating cash flow against $15.3B of debt means the business is generating meaningful internal funding, which should help absorb refinancing needs without forcing a distressed capital raise. In my opinion, this is medium refinancing risk because the current ratio below 1.0x leaves limited near-term working-capital cushion, but the scale of operating cash generation reduces the chance that debt service becomes an immediate problem. The balance sheet is not the reason to own the stock, but it is also not the reason to avoid it.
Insider Activity
The insider transaction record I see here is net selling over the full filing window, with 39 open-market sales totaling $3.4B versus 20 purchases totaling $321.6M. Activity is concentrated rather than broad: Blackstone-related holders account for the largest buys and sells, while only one named executive, Vikrant Sawhney, appears on the sell side in the recent window. In my view, that pattern is a mild bear signal because the open-market selling is larger and more concentrated than the buying, which weakens alignment with outside shareholders.
Comparable Analysis
Growth
| Company | Revenue TTM (USD Mil) | Revenue Growth YoY % | Diluted EPS TTM |
|---|---|---|---|
| BX | 15,483.3 | 28.6% | 4.5 |
| APO | 35,598 | 63.8% | 2.8 |
| KKR | 25,833.1 | 7.8% | 3.1 |
| ARES | 5,987.6 | 5.8% | 2.2 |
Source: Yahoo Finance
Blackstone’s revenue rose 28.6% TTM, versus 63.8% for APO, 7.8% for KKR, and 5.8% for ARES. BX is growing faster than KKR and ARES but well behind APO, so the stock deserves a premium to the slower growers, yet not the kind of growth multiple APO can justify if its 63.8% pace proves durable.
Valuation
| Company | Trailing P/E | Forward P/E | EV/Revenue | EV/EBITDA | Price/Sales (TTM) | Price/Book (mrq) | Beta (5Y Monthly) | FCF Yield % (TTM) | Forward EPS | Analyst Target Price – Low | Analyst Target Price – Mean | Analyst Target Price – High | # Analyst Opinions |
|---|---|---|---|---|---|---|---|---|---|---|---|---|---|
| BX | 28 | 16.7 | 8.1 | — | 9.7 | 11.1 | 1.56 | — | 7.5 | 119 | 144.4 | 184 | 21 |
| APO | 45.4 | 11.9 | 2.5 | — | 2.1 | 3.7 | 1.51 | — | 10.7 | 130 | 153.5 | 173 | 19 |
| KKR | 31.5 | 13.3 | 5.7 | — | 3.5 | 3.1 | 1.79 | — | 7.4 | 115 | 128.7 | 166 | 20 |
| ARES | 57.7 | 17.6 | 7.9 | 33.1 | 7 | 11.5 | 1.52 | 5.1% | 7.2 | 122 | 147.8 | 168 | 18 |
Source: Yahoo Finance
BX trades at 8.1x EV/Revenue, 9.7x price to sales, and 28.0x trailing P/E, versus APO at 2.5x, 2.1x, and 45.4x, KKR at 5.7x, 3.5x, and 31.5x, and ARES at 7.9x, 7.0x, and 57.7x. On forward earnings, BX is at 16.7x with forward EPS of 7.5, which sits below ARES at 17.6x on 7.2 and far below APO’s 10.7 despite BX’s stronger 28.6% revenue growth, so I feel the market is already giving BX credit for a higher-quality earnings stream rather than just top-line growth. BX also pays a 4.2% dividend yield versus APO’s 1.7%, KKR’s 0.8%, and ARES’s 4.0%, which helps explain why the stock can hold a richer multiple than KKR even with similar forward EPS. On a growth-adjusted basis, BX looks more balanced than APO: APO has the faster top line, but BX has the stronger margin base and a more defensible earnings profile.
Profitability
| Company | Operating Margin (TTM) | Net Margin (TTM) | Return on Assets (TTM) | Return on Equity (TTM) | Gross Margin (TTM) | EBITDA Margin (TTM) |
|---|---|---|---|---|---|---|
| BX | 54.4% | 22.7% | 14.3% | 31.4% | 100.0% | — |
| APO | 22.0% | 5.3% | 0.9% | 11.4% | 36.1% | — |
| KKR | 20.6% | 12.2% | 1.4% | 7.3% | 54.8% | — |
| ARES | 19.4% | 10.6% | 2.6% | 14.9% | 37.4% | 23.9% |
Source: Yahoo Finance
BX posts a 54.4% operating margin and 22.7% net margin, versus APO at 22.0% and 5.3%, KKR at 20.6% and 12.2%, and ARES at 19.4% and 10.6%. BX’s 100.0% gross margin is not directly comparable to the peers’ 36.1%, 54.8%, and 37.4%, but it still signals a fee-based model with far less cost of revenue than the others. The gap looks structural, not cyclical, because BX’s economics are driven by asset management fees rather than balance-sheet spread or capital deployment, which supports a premium multiple.
Leverage
| Company | Total Debt/Equity % (mrq) | Current Ratio (mrq) | Total Debt (mrq, USD Mil) | Operating Cash Flow TTM (USD Mil) | Net Debt/EBITDA (TTM) | FCF Margin % (TTM) |
|---|---|---|---|---|---|---|
| BX | 68.2 | 0.9 | 15,296.1 | 5,597.9 | — | — |
| APO | 101 | 1.9 | 41,884 | 9,473 | — | — |
| KKR | 69.8 | 0.9 | 56,164 | 2,488.5 | — | — |
| ARES | 172.4 | 0.5 | 14,872.6 | 912.1 | 9.1 | 36.1% |
Source: Yahoo Finance
BX’s debt to equity is 68.2%, below APO’s 101.0% and ARES’s 172.4%, while its current ratio of 0.9x is slightly above KKR’s 0.9x and below APO’s 1.9x. ARES stands out with 9.1x net debt to EBITDA and a 36.1% FCF margin, while BX has no disclosed net debt to EBITDA and no FCF margin in the dataset, so the cleaner read is that BX carries moderate balance-sheet risk without the leverage intensity that makes ARES more fragile. That lower leverage helps explain why BX can trade at a stronger margin profile than KKR without needing the same balance-sheet discount that ARES deserves.
Conclusion
I would put my rating as a Hold because the core tension is straightforward: Blackstone’s platform quality is excellent, but the stock already discounts a lot of that quality. The business is producing 54.4% operating margin, 31.4% return on equity, and $921.7B of fee-earning assets, yet the shares still trade at 28.0x trailing P/E and 16.7x forward P/E. That combination leaves limited room for disappointment if fundraising, realizations, or fee growth slow.
I would raise my rating more towards a Buy if fee-earning assets move above $1T, which would mean the firm is converting its scale into a larger recurring fee base, and if Credit & Insurance keeps compounding near the 37.0% 2025 segment distributable earnings growth rate. If that happens while operating margin stays above 50%, meaning the platform keeps converting fee revenue into profit at a high rate, the current multiple would look easier to justify. I would also want to see the earnings base hold up against the leverage profile, because a stronger fee stream matters more when debt is still $15.3B.
I would move from Hold to Sell if realizations and performance revenues soften enough that forward EPS falls materially below the current 7.5 consensus, because that would tell me the market is paying for earnings that are not arriving. A second trigger would be a sustained drop in fee-earning assets below $900B, which would signal that the fundraising and deployment engine is losing traction and that the current 9.7x price to sales multiple is too rich for the growth profile. If the current ratio also stays below 1.0x, meaning near-term liquidity remains tight, the downside case would become more credible.
Weighing both paths, I still lean to Hold. The bull case is real, but it needs another quarter or two of proof, while the bear case would require a clear break in the platform’s fundraising and monetization engine. Blackstone is good enough to own, but not cheap enough to chase until the next set of results shows that 2026 is translating into sustained earnings power.
What to Watch Next
- Fee-earning assets above $1T — would support raising the rating toward Buy.
- Operating margin staying above 50% — would confirm durable fee conversion.
- Forward EPS holding near 7.5 — would support the current valuation.
- Fee-earning assets below $900B — would strengthen the bear case.
- Current ratio staying below 1.0x — would keep liquidity risk elevated.
What’s your take? I rated Blackstone (BX) HOLD above — but the goal here is to get this right, not just to publish an opinion. What would you add to this analysis, or which risk or catalyst do you think I’m under- or over-weighting? Tell me in the comments.
Sources
- SEC 10-K Annual Report — filed 2026-02-27
- SEC 8-K Filing (2026-04-23)
- SEC 8-K Filing (2026-03-24)
- SEC 8-K Filing (2026-01-29)
- SEC Form 4 Insider Transaction (2026-06-01)
- SEC Form 4 Insider Transaction (2026-05-26)
- SEC Form 4 Insider Transaction (2026-05-19)
- SEC 10-K Annual Report — FY2026
- SEC 10-K Annual Report — FY2025
- SEC 10-K Annual Report — FY2024
- SEC 10-K Annual Report — FY2023
- SEC 10-K Annual Report — FY2022
Data sourced from Yahoo Finance and SEC EDGAR. Not investment advice.
Leave a Comment