| Company | Sep 25 | Oct 25 | Nov 25 | Dec 25 | Jan 26 | Feb 26 | Mar 26 | Apr 26 | May 26 | Jun 26 | Jul 26 | Aug 26 | 12-Mo |
|---|---|---|---|---|---|---|---|---|---|---|---|---|---|
| ATI | +5% | +22% | +2% | +14% | +5% | +36% | -11% | +7% | +13% | +13% | -5% | +9% | +163% |
| CRS | +2% | +29% | +1% | -1% | +1% | +25% | -1% | +9% | +10% | +32% | -16% | -8% | +98% |
| RTX | +6% | +7% | -2% | +5% | +10% | +1% | -5% | -9% | +2% | +6% | +13% | -3% | +33% |
| HEI | +3% | -2% | -0% | +2% | +2% | -3% | -14% | -2% | +29% | +2% | +0% | -7% | +6% |
| HWM | +13% | +5% | -1% | +0% | +1% | +26% | -12% | +5% | +6% | +4% | +5% | -13% | +41% |
| HXL | -1% | +14% | +7% | -3% | +12% | +12% | -13% | +16% | -4% | +11% | +3% | -10% | +48% |
Source: Yahoo Finance monthly adjusted close.
Quick Thesis
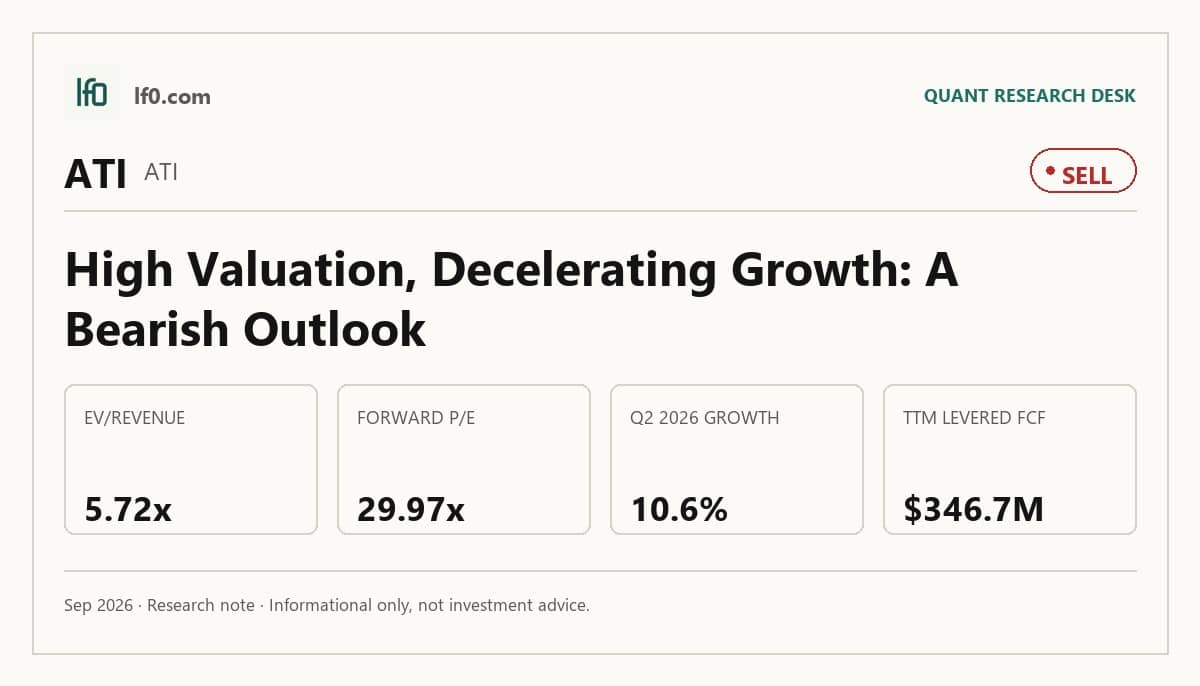
- Rated Sell — valuation already discounts the aerospace recovery.
- Strongest support: Q2 2026 revenue reached $1.3B, with EBITDA at $260.8M.
- Main risk: $2.2B of debt and 1.5x net debt/EBITDA leave little cushion.
- Valuation is rich at 29.4x EV/EBITDA and 30x forward P/E.
- I would turn more constructive only if revenue growth stays above 8.0% and FCF margin clears 8.0%.
Executive Summary
Rating: SELL | ATI
Measured from adjusted close on 2026-09-16 to 2026-09-16. Sell ratings are correct when the stock falls; Hold is tracked as a +/-10% range. Daily-close data, not intraday. Calls are tracked for 182 days from publication, then frozen as a final record.
I would put my rating as a Sell because ATI’s aerospace franchise is improving, but the stock already prices in a lot of that progress. The company has a defensible jet-engine materials position and a backlog of $3.7B, yet the shares trade at 29.4x EV/EBITDA, 30x forward P/E, and only a 1.3% FCF yield, which leaves little room for execution slippage. In my view, the key question is not whether ATI can grow, but whether that growth can outrun the valuation and the balance-sheet drag at the same time. I would move toward a Hold if revenue growth stays above 8.0% for two more quarters and FCF margin moves above 8.0%, meaning the earnings lift is turning into real cash after capex and interest.
Company Profile
ATI Inc. makes specialty materials and engineered components from nickel-based alloys, titanium, zirconium, hafnium, niobium, and other advanced metals. It serves aerospace and defense, specialty energy, medical, electronics, and industrial end markets through two segments: High Performance Materials & Components, which produces forged parts, powder alloys, and 3D-printed aerospace products, and Advanced Alloys & Solutions, which makes plate, sheet, strip, and specialty alloy products. Founded in 1996 and listed on the NYSE under ATI, the company ended FY2025 with $4.6B of revenue, about 68% from aerospace and defense, and a $3.7B backlog, with about 70% expected to ship in FY2026. ATI employs about 7,600 people across 15 countries and extended six-year collective bargaining agreements covering about 1,100 U.S. workers through February 2031.
Economic Moat
Business Model
The jet-engine materials franchise is the most defensible part of ATI’s model. In its 2026 10-K, the company says HPMC derives about 92% of revenue from aerospace and defense, including nearly 68% from commercial jet engines, and most major aerospace original equipment manufacturers have long-term agreements in place. I feel that this is hard to replicate within 3 years because ATI is already qualified across melt, forging, finishing, testing, machining, and post-production inspection, and it owns hundreds of U.S. patents plus ISO 45001-certified domestic facilities. The additive manufacturing and post-processing facility adds a second layer of protection, while the customer base is anchored by Boeing, Airbus, Embraer, GE Aerospace, Rolls-Royce, Pratt & Whitney, and Safran Aircraft Engines.
The business has also become more specialized over time. Aerospace and defense was about 40% of sales in 2022, versus about 68% today, and the strategic repositioning of Specialty Rolled Products pushed ATI away from lower-margin standard stainless sheet products. HPMC was 51% of revenue in FY2023, 52% in FY2024, and 53% in FY2025, which tells me the company is leaning harder into the segment with the strongest aerospace exposure. That mix shift is consistent with the moat described above: ATI is concentrating on qualified, high-specification products where certification and process know-how matter more than simple capacity.
Business & Operating Risks
The biggest disclosed risk is customer demand cyclicality. ATI’s end markets are tied to commercial aerospace and industrial activity, and the filing says demand can swing with lower consumption, weaker pricing, and lower-priced imports. That is not abstract boilerplate here, because a large share of sales comes from commercial aerospace, where exacting performance requirements make timing and cost misses painful, while AA&S remains exposed to oil and gas, automotive, food equipment, and construction and mining.
Pricing pressure and raw-material pass-through risk sit next. ATI says reduced demand, intense competition, and excess manufacturing capacity have already led to lower prices, while rapid changes in raw-material costs can outrun surcharge and index mechanisms. The company names nickel, hafnium, titanium sponge, cobalt, chromium, and molybdenum, and it notes that some inputs come from China, where export controls could limit or delay access. In my view, these risks do not break the moat, but they do test it by squeezing the very margin premium that ATI’s aerospace specialization is supposed to earn.
Supply-chain, labor, and operational disruption risks are also meaningful. ATI relies on third parties for critical raw materials, graphite electrodes, helium, argon, electricity, natural gas, and oil, and it warns that shortages or price spikes could hurt sales, costs, and reputation. About 35.0% of the workforce is covered by collective bargaining agreements, so a strike or lockout could interrupt production. The disclosed risks pressure execution, but they do not directly undermine the qualification-based moat; they mainly threaten the consistency of cash conversion and on-time delivery.
Management Discussion & Analysis
Management is responding to those risks by extending liquidity and leaning into aerospace, not by de-risking the business entirely. Fiscal 2025 capital expenditures were $280.6M, and the ABL Credit Facility was amended on June 13, 2025 to extend through June 2030 with a $600M revolver, a $200M term loan, and up to $100M of delayed-draw capacity. That gives ATI runway, but the next meaningful maturity is $350M of Senior Notes due in fiscal 2027, so I read the financing actions as maturity extension rather than balance-sheet repair.
The operating message is more convincing than the funding message. Management points to aerospace and defense sales rising 14% in fiscal 2025, with HPMC sales up 7% and Segment EBITDA up 9%, which supports the view that jet-engine and defense demand are carrying the portfolio. Working capital remains the friction point: managed working capital rose to 32.5% of annualized sales from 30.9% in fiscal 2024 even as cash from operations improved to $614.3M, so the business is growing, but it is still tying up a lot of cash to do it. That matters for the moat because a specialized materials business only compounds if margin gains also show up in cash.
Recent Events
The most important recent event was ATI’s June 8, 2026 issuance of $450M of unsecured 5.875% Senior Notes due 2033. That adds long-dated funding and reduces near-term refinancing pressure, but it also locks in a meaningful fixed coupon, so the benefit is real only if the proceeds are used to extend maturity rather than fund low-return uses.
The June 3, 2026 announcement and pricing of the same note deal suggest management moved quickly after the April 30, 2026 first-quarter release. In my view, that sequence points to deliberate balance-sheet management rather than distress financing, which supports the company’s ability to keep investing through the cycle. The May 14, 2026 annual meeting was routine, with directors elected, pay approved, and Ernst & Young ratified as auditor. Taken together, the recent filings reinforce the moat thesis by extending financial runway without signaling any operational break.
Financial Analysis
Growth
ATI — Financial Growth (Quarterly, USD Mil)
| Metric | 2025-06-30 | 2025-09-30 | 2025-12-31 | 2026-03-31 | 2026-06-30 |
|---|---|---|---|---|---|
| REVENUE (USD Mil) | 1,140.4 | 1,125.5 | 1,177.1 | 1,151.5 | 1,261.1 |
| EBIT (USD Mil) | 158.7 | 170.7 | 159.1 | 160.3 | 216.8 |
| EBITDA (USD Mil) | 200.3 | 213.3 | 202.2 | 205.3 | 260.8 |
| NET INCOME (USD Mil) | 100.7 | 110 | 96.6 | 118.2 | 151 |
| DILUTED EPS | 0.7 | 0.8 | 0.7 | 0.8 | 1.1 |
Source: Yahoo Finance — Quarterly Financial Statements
ATI’s revenue rose to $1.3B in Q2 2026 from $1.2B in Q1 2026, and that 10.6% year-over-year increase was the strongest quarterly growth in the period shown. EBITDA climbed to $260.8M from $205.3M, while net income increased to $151M from $118.2M, so the company is not just selling more volume; it is converting that volume into better earnings. I think the step-up matters because it shows the aerospace mix is finally feeding through to the income statement, not just the backlog.
Profitability
ATI — Profitability (TTM)
| Metric | TTM |
|---|---|
| Operating Margin (TTM) | 18.2% |
| Net Margin (TTM) | 10.1% |
| Return on Assets (TTM) | 8.8% |
| Return on Equity (TTM) | 25.4% |
| Gross Margin (TTM) | 23.6% |
| EBITDA Margin (TTM) | 19.4% |
Source: Yahoo Finance — Trailing Twelve Months (TTM)
TTM operating margin of 18.2%, gross margin of 23.6%, and EBITDA margin of 19.4% show ATI is already profitable at the operating level. Net margin of 10.1% confirms the business converts only about half of operating profit into bottom-line earnings, so below-the-line costs still matter. ROA of 8.79% and ROE of 25.4% point to solid asset productivity, and the gap between them tells me leverage is amplifying returns rather than creating them on its own.
Valuation
ATI — Valuation Multiples
| Metric | Value |
|---|---|
| Market Cap (USD Mil) | 26,004 |
| Enterprise Value (USD Mil) | 26,952 |
| Trailing P/E | 55.8 |
| Forward P/E | 30 |
| Price/Sales (TTM) | 5.5 |
| Price/Book (mrq) | 13.9 |
| EV/Revenue | 5.7 |
| EV/EBITDA | 29.4 |
| Beta (5Y Monthly) | 1.01 |
| FCF Yield % (TTM) | 1.3% |
| Forward EPS (USD) | 6.4 |
| Analyst Target Price – Low (USD) | 245 |
| Analyst Target Price – Mean (USD) | 259.9 |
| Analyst Target Price – High (USD) | 275 |
| # Analyst Opinions | 9 |
Source: Yahoo Finance
ATI screens as a growth and quality name rather than a value name. The stock trades at 55.8x trailing P/E, 30x forward P/E, 5.52x Price/Sales, and 29.4x EV/EBITDA, while FCF yield is only 1.33%. That is rich for a materials business, even one with aerospace exposure, because the market is already paying for a strong earnings ramp into 2026.
On the analysis here, I would put fair value in a range of about $121-$347 per share, using peer EV/Revenue as a cross-check against ATI’s own growth, margin, and leverage profile. That range sits around the current price and overlaps the analyst target range of 245–275, but I weight ATI’s leverage and thin cash yield more heavily than the consensus appears to. Forward EPS of 6.37 also looks modest versus the richer peers in the group, so the stock is not cheap on a like-for-like earnings basis even before you adjust for balance-sheet risk. The valuation case only works if the current growth inflection proves durable.
Leverage
ATI — Leverage & Coverage (Quarterly)
| Metric | Value |
|---|---|
| Total Debt/Equity % (mrq) | 109.7 |
| Current Ratio (mrq) | 2.3 |
| Total Debt (mrq, USD Mil) | 2,192 |
| Net Debt/EBITDA (TTM) | 1.5 |
| FCF Margin % (TTM) | 7.3% |
Source: Yahoo Finance — Quarterly Financial Statements
ATI’s leverage is manageable, but it is not a source of edge. Total debt/equity was 109.7%, current ratio was 2.327, and total debt was $2.2B, so the company has liquidity but also meaningful financial obligations. Net debt/EBITDA of 1.5x and levered free cash flow of $346.7M show the balance sheet is serviceable, yet the 7.3% FCF margin leaves limited room if demand softens. I would not call this a stress case, but I also would not call it a cushion.
Insider Activity
The insider transaction record is one-sided: 26 open-market sales and 0 open-market purchases in the 2025-01-03 to 2026-06-02 window. Activity is concentrated in Kimberly A. Fields, with additional selling from Robert S. Wetherbee and David J. Morehouse, so the pattern is broad enough to matter rather than a single isolated trade. I read that as a mild negative, mainly because it does not line up with a stock that is already priced for a lot of good news.
Comparable Analysis
Growth
| Company | Revenue TTM (USD Mil) | Revenue Growth YoY % | Diluted EPS TTM |
|---|---|---|---|
| ATI | 4,715.2 | 10.6% | 3.4 |
| CRS | 3,124.2 | 12.6% | 10.4 |
| RTX | 93,500 | 14.5% | 5.7 |
| HEI | 5,176.8 | 23.1% | 6 |
| HWM | 9,117 | 24.1% | 4.7 |
| HXL | 1,978.3 | 8.0% | 2 |
Source: Yahoo Finance
ATI’s revenue growth of 10.6% TTM is below HEI’s 23.1% and HWM’s 24.1%, but above HXL’s 8.0% and close to CRS at 12.6%. That puts ATI in the middle of the pack rather than in the top tier, which is important because the market is valuing it as if it were closer to the leaders.
Valuation
| Company | Trailing P/E | Forward P/E | EV/Revenue | EV/EBITDA | Price/Sales (TTM) | Price/Book (mrq) | Beta (5Y Monthly) | FCF Yield % (TTM) | Forward EPS | Analyst Target Price – Low | Analyst Target Price – Mean | Analyst Target Price – High | # Analyst Opinions |
|---|---|---|---|---|---|---|---|---|---|---|---|---|---|
| ATI | 55.8 | 30 | 5.7 | 29.4 | 5.5 | 13.9 | 1.01 | 1.3% | 6.4 | 245 | 259.9 | 275 | 9 |
| CRS | 40.6 | 26.6 | 6.7 | 25.3 | 6.7 | 9.4 | 1.26 | 1.1% | 15.9 | 540 | 625.9 | 700 | 8 |
| RTX | 34.5 | 25 | 3.2 | 18.6 | 2.8 | 4 | 0.29 | 3.7% | 7.9 | 200 | 234.8 | 265 | 22 |
| HEI | 49.9 | 41.6 | 8.6 | 30.2 | 8.1 | 8.5 | 1.04 | 2.0% | 7.2 | 294 | 393.9 | 491 | 20 |
| HWM | 48.8 | 35.1 | 10.3 | 33.5 | 9.9 | 15.8 | 1.19 | 1.3% | 6.5 | 256.6 | 337.7 | 375 | 21 |
| HXL | 46.5 | 29.4 | 3.9 | 20.1 | 3.5 | 5.4 | 1.04 | 3.6% | 3.1 | 90 | 110.6 | 126 | 14 |
Source: Yahoo Finance
ATI trades at 5.72x EV/Revenue and 29.4x EV/EBITDA, versus RTX at 3.2x and 18.6x, HXL at 3.9x and 20.1x, CRS at 6.7x and 25.3x, HEI at 8.6x and 30.2x, and HWM at 10.3x and 33.5x. On a growth-adjusted basis, that is not cheap: ATI’s 10.6% growth does not justify a premium to the faster growers, and its 1.3% FCF yield is only in line with the most expensive names. The stock’s strong 1-year total return of 138% also tells me the market has already moved far ahead of the fundamentals.
Profitability
| Company | Operating Margin (TTM) | Net Margin (TTM) | Return on Assets (TTM) | Return on Equity (TTM) | Gross Margin (TTM) | EBITDA Margin (TTM) |
|---|---|---|---|---|---|---|
| ATI | 18.2% | 10.1% | 8.8% | 25.4% | 23.6% | 19.4% |
| CRS | 24.1% | 17.0% | 11.9% | 25.8% | 30.6% | 26.4% |
| RTX | 12.7% | 8.3% | 4.2% | 12.3% | 20.3% | 17.0% |
| HEI | 25.1% | 16.4% | 8.5% | 17.7% | 40.4% | 28.5% |
| HWM | 28.5% | 20.5% | 12.8% | 34.7% | 36.0% | 30.6% |
| HXL | 13.9% | 7.8% | 6.0% | 10.8% | 25.0% | 19.7% |
Source: Yahoo Finance
ATI’s operating margin of 18.2% and EBITDA margin of 19.4% are solid, but they trail CRS at 24.1% and 26.4%, HEI at 25.1% and 28.5%, and HWM at 28.5% and 30.6%. ROE of 25.4% is respectable and close to CRS at 25.8%, yet HWM’s 34.7% shows what best-in-class capital efficiency looks like. In other words, ATI is profitable enough to support the thesis, but not profitable enough to justify the richest multiple in the group.
Leverage
| Company | Total Debt/Equity % (mrq) | Current Ratio (mrq) | Total Debt (mrq, USD Mil) | Free Cash Flow TTM (USD Mil) | Net Debt/EBITDA (TTM) | FCF Margin % (TTM) |
|---|---|---|---|---|---|---|
| ATI | 109.7 | 2.3 | 2,192 | 346.7 | 1.5 | 7.3% |
| CRS | 32.7 | 3.8 | 727.5 | 238.8 | 0.4 | 7.6% |
| RTX | 57 | 1 | 38,856 | 9,880 | 1.9 | 10.6% |
| HEI | 45 | 2.7 | 2,541.2 | 845.4 | 1.6 | 16.3% |
| HWM | 81.4 | 1.8 | 4,664 | 1,189.9 | 1.5 | 13.1% |
| HXL | 73.9 | 2.4 | 959.4 | 253 | 2.3 | 12.8% |
Source: Yahoo Finance
ATI’s debt/equity of 109.7% is higher than CRS at 32.7%, RTX at 57.0%, HEI at 45.0%, HWM at 81.4%, and HXL at 73.9%, but net debt/EBITDA of 1.5x is close to HEI and HWM, which means the raw debt ratio overstates risk because ATI carries $783M of cash. That lower net leverage helps explain why ATI can trade above some peers on valuation, but it does not explain the full premium when peers such as RTX and CRS also have stronger cash conversion. The balance sheet is acceptable, not advantaged.
Conclusion
I would put my rating as a Sell because ATI’s operating momentum is real, but the market has already priced in a lot of that improvement. Revenue reached $1.3B in Q2 2026 and EBITDA rose to $260.8M, so the business is moving in the right direction, yet the shares still trade at 29.4x EV/EBITDA, 30x forward P/E, and only a 1.3% FCF yield. That combination leaves me focused on whether the earnings lift is durable enough to outrun the valuation and the 1.5x net debt/EBITDA burden at the same time.
I would raise my rating toward a Hold if ATI can keep revenue growth above 8.0% for two more quarters, meaning the Q2 2026 step-up is not a one-off, and if FCF margin moves above 8.0%, which would show the earnings lift is turning into more cash after capex and interest. A net margin closer to 12.0% would also matter because it would tell me the jet-engine mix shift is flowing through cleanly enough to justify a higher multiple.
I would move from Sell to Strong Sell if revenue growth slips below 5.0% for two straight quarters, because that would suggest the current acceleration was temporary, and if net debt/EBITDA rises above 2.0x, meaning leverage is climbing to a level that starts to constrain flexibility. A weaker FCF margin, especially back toward the mid-6% area, would reinforce that view because it would show ATI is still funding growth with too much working capital and not enough cash conversion.
Weighing both cases, I lean to the bear side on valuation timing rather than on business quality. ATI can keep compounding, but the stock already reflects a lot of that outcome, so I want either a cheaper entry or another quarter of proof before getting more constructive.
What to Watch Next
- Revenue growth above 8.0% for two more quarters — would support a move toward Hold.
- FCF margin above 8.0% — would show earnings are converting into cash.
- Net margin near 12.0% — would confirm the mix shift is flowing through.
- Net debt/EBITDA above 2.0x — would signal leverage is starting to bite.
- FCF margin back near 6.5% — would weaken the cash-conversion case.
What’s your take? I rated ATI (ATI) SELL above — but the goal here is to get this right, not just to publish an opinion. What would you add to this analysis, or which risk or catalyst do you think I’m under- or over-weighting? Tell me in the comments.
Sources
- SEC 10-K Annual Report — filed 2026-02-20
- SEC 8-K Filing (2026-06-08)
- SEC 8-K Filing (2026-06-03)
- SEC 8-K Filing (2026-06-03)
- SEC 8-K Filing (2026-05-19)
- SEC 8-K Filing (2026-04-30)
- SEC 8-K Filing (2026-02-19)
- SEC Form 4 Insider Transaction (2026-06-04)
- SEC Form 4 Insider Transaction (2026-05-21)
- SEC Form 4 Insider Transaction (2026-05-21)
- SEC 10-K Annual Report — FY2026
- SEC 10-K Annual Report — FY2025
- SEC 10-K Annual Report — FY2024
- SEC 10-K Annual Report — FY2023
- SEC 10-K Annual Report — FY2022
Data sourced from Yahoo Finance and SEC EDGAR. Not investment advice.
Leave a Comment