
| Company | Sep 25 | Oct 25 | Nov 25 | Dec 25 | Jan 26 | Feb 26 | Mar 26 | Apr 26 | May 26 | Jun 26 | Jul 26 | Aug 26 | 12-Mo |
|---|---|---|---|---|---|---|---|---|---|---|---|---|---|
| XMTR | +10% | -11% | +20% | +2% | -4% | -28% | -0% | +26% | +86% | +1% | -11% | +8% | +87% |
| LECO | -2% | -1% | +2% | +0% | +11% | +8% | -13% | +6% | -2% | +3% | -2% | +8% | +17% |
| FSS | -3% | -1% | -3% | -5% | -0% | +8% | -7% | +14% | -13% | +20% | -3% | -6% | -4% |
| DCI | +3% | +3% | +7% | -1% | +15% | -9% | -9% | +4% | -7% | +10% | +5% | -3% | +16% |
| AME | +2% | +8% | -2% | +4% | +9% | +7% | -10% | +10% | -4% | +7% | -0% | -3% | +28% |
| ITW | -1% | -6% | +2% | -1% | +6% | +11% | -10% | -1% | -4% | +10% | +6% | -4% | +7% |
Source: Yahoo Finance monthly adjusted close.
Quick Thesis
- Rated hold — growth is strong, but cash conversion is still negative.
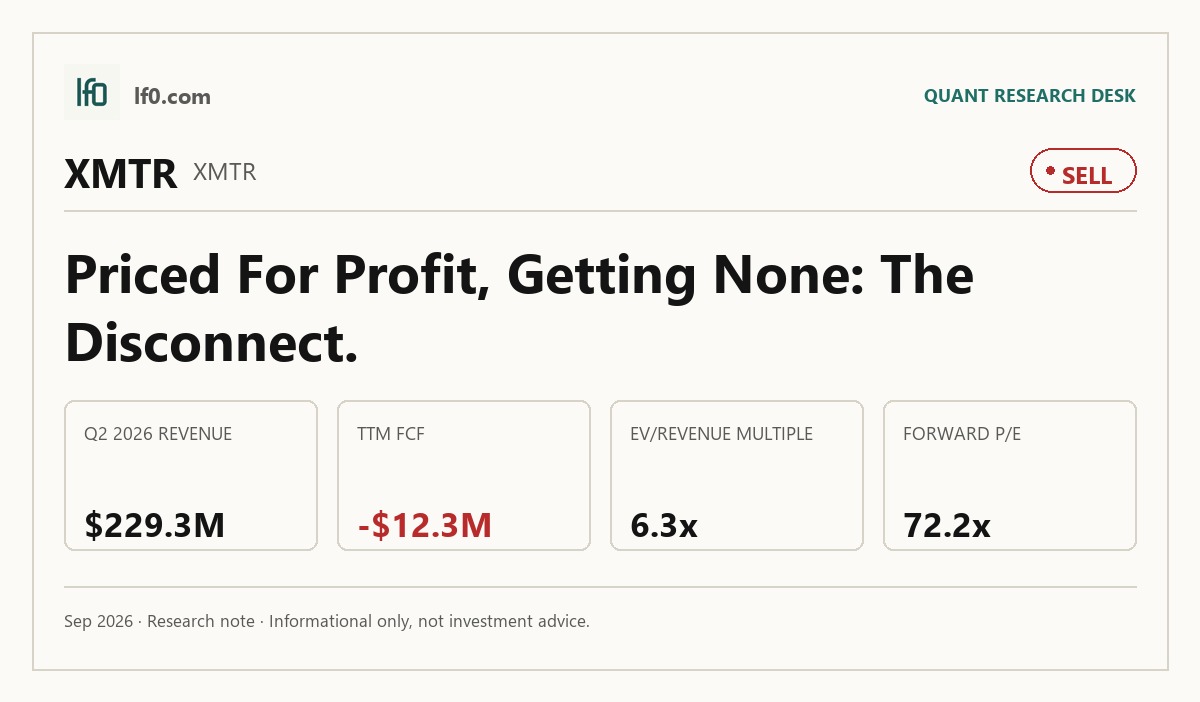
- Revenue reached $229.3M in Q2 2026, up 41.1% year over year.
- Biggest risk: levered free cash flow was -$12.3M TTM.
- Valuation is rich at 6.3x EV/revenue and 72.2x forward P/E.
- I would turn more constructive if quarterly EBITDA stays positive and revenue holds above $220M.
Executive Summary
Rating: SELL | XMTR
Measured from adjusted close on 2026-09-03 to 2026-09-03. Sell ratings are correct when the stock falls; Hold is tracked as a +/-10% range. Daily-close data, not intraday. Calls are tracked for 182 days from publication, then frozen as a final record.
I would put my rating as a hold because Xometry is growing fast, but the market is already paying for a cleaner earnings path than the latest cash flow and margin data justify. Revenue reached $229.3M in Q2 2026, EBITDA was only $2.1M, and levered free cash flow remained -$12.3M TTM, so the business is still proving that scale can turn into durable cash generation rather than just top-line expansion. In my view, the key strength is the network: active buyers rose 20% to 81,821 and active suppliers increased 17% to 4,996, which shows the marketplace is still widening. The main risk is that this growth is not yet self-funding, and that gap matters because the current 6.3x EV/revenue multiple already assumes better operating leverage than the company has delivered so far. I would become more constructive if quarterly EBITDA stays positive and revenue remains above $220M, because that would show the model can absorb fixed costs without leaning on external capital.
Company Profile
Xometry operates a digital manufacturing marketplace that connects buyers with a network of suppliers for custom parts and related services. The platform is built to match demand with available manufacturing capacity, so revenue depends on both buyer acquisition and supplier participation. That model gives the company a broader addressable market than a single-factory manufacturer, but it also means execution depends on keeping both sides of the network active at the same time.
Economic Moat
Business Model
The moat case rests on network density. More buyers should attract more suppliers, and more suppliers should improve speed, pricing, and part availability for buyers. I feel that this is the kind of marketplace advantage that can compound if management keeps adding users on both sides, because the value of the platform rises as the network gets deeper. The latest figures support that view: active buyers reached 81,821 and active suppliers reached 4,996 as of December 31, 2025, while 98% of Q4 2025 revenue came from existing accounts, which tells me the platform is starting to earn repeat usage rather than one-off transactions.
Business & Operating Risks
The main disclosed risk is that the marketplace still depends on continued buyer acquisition and supplier participation, so any slowdown on either side would weaken the network effect. Margin pressure is also visible in the numbers: marketplace cost of revenue rose 30% in 2025 and gross margin slipped to 39.1% from 39.5%, which suggests scale is not yet translating into clean operating leverage. I do not think these risks directly break the moat, but they do test whether the network can convert into durable economics fast enough to matter.
Management Discussion & Analysis
Management is responding to the scaling risk, but not yet to the cash-conversion problem. The June 2025 note issuance, the partial repurchase of 2027 Notes, and the June 2026 equity offering all show a willingness to fund growth externally while the platform matures. That is sensible if the network keeps compounding, yet it also means the company is still asking investors to bridge the gap between growth and self-funding profitability.
Recent Events
The most important recent event was the $50M strategic investment from Siemens Beteiligungen Inland GmbH on May 6, 2026, paired with a collaboration to build software for Siemens’ design-to-manufacturing ecosystem. I see that as a meaningful moat signal because it ties Xometry more closely to a large industrial customer and could deepen enterprise adoption of the platform. The June 1, 2026 underwritten equity offering of 2.6M shares at $85.00 per share added dilution, but it also gave management more room to fund product development and partnership execution. The board changes, including Sanjeev Singh Sahni’s planned move into the CEO role on July 1, 2026, suggest the company is sharpening execution around scale rather than changing strategy.
Financial Analysis
Growth
XMTR — Financial Growth (Quarterly, USD Mil)
| Metric | 2025-06-30 | 2025-09-30 | 2025-12-31 | 2026-03-31 | 2026-06-30 |
|---|---|---|---|---|---|
| REVENUE (USD Mil) | 162.5 | 180.7 | 192.4 | 205.1 | 229.3 |
| EBIT (USD Mil) | -25.3 | -10.3 | -6.8 | -3.8 | -3.7 |
| EBITDA (USD Mil) | -20.8 | -5.3 | -1.8 | 1.2 | 2.1 |
| NET INCOME (USD Mil) | -26.4 | -11.6 | -8.6 | -5.3 | -5.3 |
| DILUTED EPS | -0.5 | -0.2 | -0.2 | -0.1 | -0.1 |
Source: Yahoo Finance — Quarterly Financial Statements
Revenue rose from $162.5M in Q2 2025 to $229.3M in Q2 2026, a 41.1% increase, and the path between those points was steady rather than erratic. EBITDA improved from -$20.8M to $2.1M over the same span, which is the first sign that scale is starting to reach the income statement. That said, the business is still not fully converting growth into earnings, so I read the quarter as proof of momentum rather than proof of durability.
Profitability
XMTR — Profitability (TTM)
| Metric | TTM |
|---|---|
| Operating Margin (TTM) | -2.4% |
| Net Margin (TTM) | -3.8% |
| Return on Assets (TTM) | -2.2% |
| Return on Equity (TTM) | -7.1% |
| Gross Margin (TTM) | 38.8% |
| EBITDA Margin (TTM) | -1.3% |
Source: Yahoo Finance — Trailing Twelve Months (TTM)
TTM gross margin was 38.8%, but the rest of the profitability stack is still negative: operating margin was -2.4%, EBITDA margin was -1.3%, net margin was -3.8%, ROA was -2.2%, and ROE was -7.1%. The spread between gross margin and EBITDA margin tells me the issue is overhead absorption, not the core marketplace take rate. EBITDA turning positive in Q1 2026 and rising to $2.1M in Q2 2026 is encouraging, but the trailing numbers still show a business that has not yet crossed into durable profitability.
Valuation
XMTR — Valuation Multiples
| Metric | Value |
|---|---|
| Market Cap (USD Mil) | 5,328 |
| Enterprise Value (USD Mil) | 5,111 |
| Trailing P/E | — |
| Forward P/E | 72.2 |
| Price/Sales (TTM) | 6.6 |
| Price/Book (mrq) | 17.2 |
| EV/Revenue | 6.3 |
| EV/EBITDA | -488.8 |
| Beta (5Y Monthly) | 1.32 |
| FCF Yield % (TTM) | -0.2% |
| Forward EPS (USD) | 1.3 |
| Analyst Target Price – Low (USD) | 95 |
| Analyst Target Price – Mean (USD) | 110.3 |
| Analyst Target Price – High (USD) | 126 |
| # Analyst Opinions | 10 |
Source: Yahoo Finance
I would put fair value in a range of roughly $42-$102 per share based on the peer EV/revenue range and Xometry’s own revenue scale, which is a wide band because the company is still between growth and profitability. That range sits below the $95-$126 analyst target range, and with 10 analyst opinions I think the consensus is clearly more optimistic than I am because it gives more credit to margin expansion than the current cash flow profile supports. Forward EPS is 1.29 for Xometry, versus $12.5 for LECO, $12.4 for ITW, and $9.6 for AME, so the market is paying for a much faster earnings ramp than peers already deliver. On that basis, the stock screens as rich rather than cheap, especially with 6.3x EV/revenue, 17.2x price/book, and a -0.2% FCF yield. I would keep the rating at hold because the valuation already assumes the operating leverage that the latest margins have not yet proven.
Leverage
XMTR — Leverage & Coverage (Quarterly)
| Metric | Value |
|---|---|
| Total Debt/Equity % (mrq) | 57 |
| Current Ratio (mrq) | 3.2 |
| Total Debt (mrq, USD Mil) | 339.8 |
| Operating Cash Flow (TTM, USD Mil) | 27.7 |
| Levered Free Cash Flow (TTM, USD Mil) | -12.3 |
| Net Debt/EBITDA (TTM) | 16.9 |
| FCF Margin % (TTM) | -1.5% |
Source: Yahoo Finance — Quarterly Financial Statements
The balance sheet is liquid, but cash conversion is still weak. Total debt was $339.8M, current ratio was 3.2x, and total cash was $516.7M, so near-term solvency is not the issue. The problem is that operating cash flow was only $27.8M TTM while levered free cash flow was -$12.3M TTM and net debt/EBITDA was 16.9x, which reflects negative EBITDA rather than a conventional debt burden. In my view, that means the company can fund itself for now, but it is not yet generating enough internal cash to make the capital structure feel self-sustaining.
Insider Activity
The insider tape is mixed, but the recent pattern leans negative. Lukas Biewald bought 47,058 shares on June 3, 2026, yet that was outweighed by repeated sales from the CFO and Chief Sales Officer, and the summary shows 2 open-market purchases versus 127 open-market sales over the period. I do not read that as a decisive governance problem, especially with 6.82% insider ownership, but it does suggest insiders have been more willing to take money off the table than add to exposure.
Comparable Analysis
Growth
| Company | Revenue TTM (USD Mil) | Revenue Growth YoY % | EBITDA TTM (USD Mil) | Diluted EPS TTM |
|---|---|---|---|---|
| XMTR | 807.5 | 41.1% | -10.5 | -0.6 |
| LECO | 4,481 | 12.0% | 885 | 10 |
| FSS | 2,447.9 | 18.7% | 499.8 | 4.6 |
| DCI | 3,885.6 | 8.0% | 714.2 | 3.9 |
| AME | 7,863.9 | 15.0% | 2,500.7 | 6.8 |
| ITW | 16,469 | 6.1% | 4,806 | 11 |
Source: Yahoo Finance
Xometry’s revenue growth of 41.1% TTM is well ahead of LECO at 12.0%, FSS at 18.7%, DCI at 8.0%, AME at 15.0%, and ITW at 6.1%. That growth gap is the core bull case, but it also explains why the stock trades on a different basis than the peer group: investors are paying for future scale, not current earnings. The catch is that XMTR’s diluted EPS is still -$0.6 TTM while every named peer is profitable, so the growth premium is still a promise rather than a delivered cash return.
Valuation
| Company | Trailing P/E | Forward P/E | EV/Revenue | EV/EBITDA | Price/Sales (TTM) | Price/Book (mrq) | Market Cap (USD Mil) | Enterprise Value (USD Mil) | Beta (5Y Monthly) | FCF Yield % (TTM) | Forward EPS | Analyst Target Price – Low | Analyst Target Price – Mean | Analyst Target Price – High | # Analyst Opinions |
|---|---|---|---|---|---|---|---|---|---|---|---|---|---|---|---|
| XMTR | — | 72.2 | 6.3 | -488.8 | 6.6 | 17.2 | 5,328 | 5,111 | 1.32 | -0.2% | 1.3 | 95 | 110.3 | 126 | 10 |
| LECO | 27.4 | 21.9 | 3.5 | 17.9 | 3.3 | 9.6 | 14,941 | 15,817 | 1.22 | 2.1% | 12.5 | 238 | 304.9 | 340 | 11 |
| FSS | 25.1 | 20.1 | 3 | 14.9 | 2.9 | 4.7 | 7,106 | 7,450 | 1.23 | 2.7% | 5.8 | 132 | 145.6 | 155 | 8 |
| DCI | 23.5 | 18.6 | 3 | 16.1 | — | 6 | — | 11,504 | 0.93 | — | 4.9 | 79 | 99.6 | 123 | 5 |
| AME | 34.3 | 24.4 | 7 | 22.1 | 6.8 | 4.8 | 53,693 | 55,277 | 1 | 2.8% | 9.6 | 217 | 278.1 | 316 | 18 |
| ITW | 24.6 | 21.9 | 5.2 | 17.8 | 4.7 | 26.7 | 77,249 | 85,493 | 1 | 3.1% | 12.4 | 249 | 301.9 | 350 | 14 |
Source: Yahoo Finance
XMTR trades at 6.3x EV/revenue and 6.6x price/sales, versus 3.5x and 3.3x for LECO, 3.0x and 2.9x for FSS, 3.0x and 6.0x for DCI, 7.0x and 6.8x for AME, and 5.2x and 4.7x for ITW. The market is clearly paying up for XMTR’s faster growth, but the premium is not backed by current profitability because forward EPS is only 1.29 and FCF yield is -0.2%. On a like-for-like basis, that makes XMTR look expensive relative to peers with much stronger cash generation, even though its revenue growth is the best in the set.
Profitability
| Company | Operating Margin (TTM) | Net Margin (TTM) | Return on Assets (TTM) | Return on Equity (TTM) | Gross Margin (TTM) | EBITDA Margin (TTM) |
|---|---|---|---|---|---|---|
| XMTR | -2.4% | -3.8% | -2.2% | -7.1% | 38.8% | -1.3% |
| LECO | 18.2% | 12.4% | 13.0% | 37.7% | 36.0% | 19.8% |
| FSS | 17.7% | 11.7% | 11.8% | 20.6% | 29.2% | 20.4% |
| DCI | 17.1% | 11.7% | 10.9% | 28.2% | 35.1% | 18.4% |
| AME | 26.2% | 20.0% | 8.2% | 14.6% | 36.9% | 31.8% |
| ITW | 26.9% | 19.4% | 16.9% | 104.6% | 44.2% | 29.2% |
Source: Yahoo Finance
XMTR’s gross margin of 38.8% is respectable, but its operating margin of -2.4%, EBITDA margin of -1.3%, net margin of -3.8%, ROA of -2.2%, and ROE of -7.1% trail every profitable peer. LECO, FSS, DCI, AME, and ITW all post positive operating and net margins, which tells me the peer group has already converted scale into earnings power. The key point is that XMTR’s margin structure is not broken at the gross-profit level; it simply has not yet absorbed enough fixed cost to match the peer set.
Leverage
| Company | Total Debt/Equity % (mrq) | Current Ratio (mrq) | Total Debt (mrq, USD Mil) | Operating Cash Flow TTM (USD Mil) | Free Cash Flow TTM (USD Mil) | Net Debt/EBITDA (TTM) | FCF Margin % (TTM) |
|---|---|---|---|---|---|---|---|
| XMTR | 57 | 3.2 | 339.8 | 27.8 | -12.3 | 16.9 | -1.5% |
| LECO | 77.3 | 2 | 1,202.1 | 687.6 | 307.1 | 1.1 | 6.9% |
| FSS | 32.2 | 2.7 | 485.8 | 372.5 | 194.7 | 0.8 | 8.0% |
| DCI | 75.1 | 2.1 | 1,324.8 | 493.7 | 347 | 1.5 | 8.9% |
| AME | 20.5 | 1.2 | 2,310.9 | 1,960.3 | 1,492.2 | 0.7 | 19.0% |
| ITW | 334.9 | 1.1 | 9,694 | 3,330 | 2,433 | 1.8 | 14.8% |
Source: Yahoo Finance
XMTR’s current ratio of 3.2x is healthy, and its $516.7M of cash gives it more liquidity than the debt figure alone suggests. Even so, net debt/EBITDA is 16.9x because EBITDA is still barely positive, while peers such as LECO at 1.1x, FSS at 0.8x, DCI at 1.5x, and AME at 0.7x are operating with far more cash-generative balance sheets. That gap matters because XMTR’s valuation premium is being asked to coexist with a weaker cash profile, which is a harder combination to defend if growth slows.
Conclusion
I would put my rating as a hold because the central tension is no longer whether Xometry can grow, but whether that growth can turn into sustained positive EBITDA and free cash flow before the valuation gets ahead of itself. The company has already shown that the network can scale, and the Siemens partnership plus the buyer and supplier gains support the moat thesis, but the latest numbers still show only $2.1M of quarterly EBITDA and -$12.3M of levered free cash flow TTM. That is enough to keep the thesis alive, but not enough for me to call the stock cheap.
I would raise my rating more towards a buy if quarterly EBITDA stays above $10M for two straight quarters and revenue remains above $220M, because that would show the marketplace can absorb its fixed cost base without recurring external funding. If that happens while free cash flow turns positive, the current 6.3x EV/revenue multiple would look much easier to defend, and the 72.2x forward P/E would start to reflect real earnings power rather than hope.
I would move from hold to sell if revenue growth falls below 25% year over year and EBITDA slips back toward breakeven or negative territory, because that would mean the stock’s 87.6% one-year gain has outrun the business. I would also watch for another round of equity-linked funding before cash flow turns positive, since that would confirm the company is still financing growth externally rather than internally.
For now, I think the market is giving Xometry credit for a profitability step-up that has not fully arrived. The growth is real, but I want to see sustained positive EBITDA and better cash conversion before I move more constructive.
What to Watch Next
- Quarterly EBITDA above $10M — would support a move toward Buy.
- Revenue above $220M per quarter — would confirm the scale trend is intact.
- Free cash flow turning positive — would show the business is becoming self-funding.
- Revenue growth below 25% year over year — would weaken the growth premium.
- Another equity-linked financing before cash flow turns positive — would keep dilution risk elevated.
What’s your take? I rated Xometry (XMTR) SELL above — but the goal here is to get this right, not just to publish an opinion. What would you add to this analysis, or which risk or catalyst do you think I’m under- or over-weighting? Tell me in the comments.
Sources
- SEC 10-K Annual Report — filed 2026-02-24
- SEC 8-K Filing (2026-06-02)
- SEC 8-K Filing (2026-05-21)
- SEC 8-K Filing (2026-05-08)
- SEC 8-K Filing (2026-05-07)
- SEC 8-K Filing (2026-02-24)
- SEC 8-K Filing (2026-02-24)
- SEC Form 4 Insider Transaction (2026-06-04)
- SEC Form 4 Insider Transaction (2026-06-03)
- SEC Form 4 Insider Transaction (2026-05-28)
Data sourced from Yahoo Finance and SEC EDGAR. Not investment advice.
Leave a Comment