
| Company | Sep 25 | Oct 25 | Nov 25 | Dec 25 | Jan 26 | Feb 26 | Mar 26 | Apr 26 | May 26 | Jun 26 | Jul 26 | Aug 26 | 12-Mo |
|---|---|---|---|---|---|---|---|---|---|---|---|---|---|
| DAC | -2% | +1% | +7% | -4% | +10% | +15% | -5% | +7% | +5% | -2% | +17% | +7% | +68% |
| CMRE | +4% | +3% | +25% | +3% | +6% | +5% | -4% | -1% | -7% | -9% | +12% | -2% | +36% |
| ZIM | -0% | +14% | +33% | +4% | +4% | +31% | -6% | +0% | -11% | +11% | -3% | +9% | +108% |
| SBLK | -0% | +1% | +6% | -3% | +19% | +15% | -11% | +9% | +8% | -7% | +15% | +11% | +78% |
| MATX | -5% | +2% | +8% | +13% | +30% | +4% | -1% | +6% | +4% | +6% | +5% | +11% | +118% |
| NMM | -4% | +9% | +11% | -4% | +14% | +21% | -6% | +7% | -4% | +1% | +15% | +9% | +89% |
Source: Yahoo Finance monthly adjusted close.
Quick Thesis
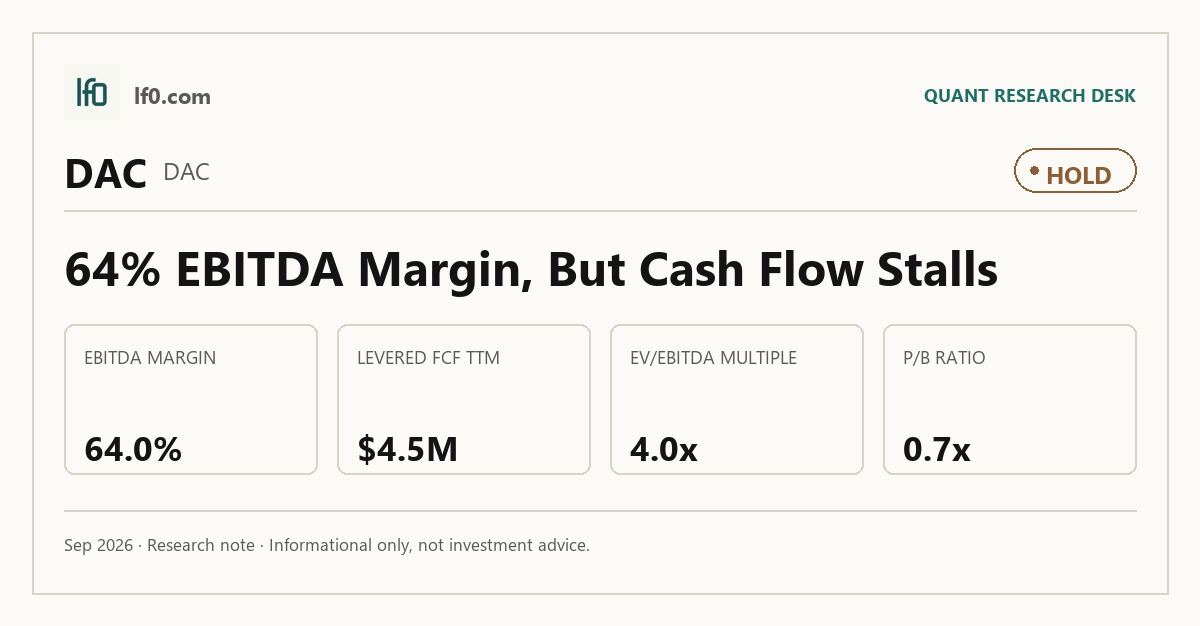
- Rated Hold — strong margins and near-zero net debt, but free cash flow is too thin.
- EBITDA margin is 64.0% TTM, which confirms the fleet still earns well.
- The main risk is only $4.5M of levered free cash flow TTM.
- Valuation is mixed: 4.0x EV/EBITDA and 0.7x price/book, but cash conversion is weak.
- I would move toward Buy if levered free cash flow rises meaningfully above breakeven and stays there.
Executive Summary
Rating: HOLD | DAC
Measured from adjusted close on 2026-09-02 to 2026-10-20. Sell ratings are correct when the stock falls; Hold is tracked as a +/-10% range. Daily-close data, not intraday. Calls are tracked for 182 days from publication, then frozen as a final record.
I would put my rating as a Hold because Danaos has a high-quality earnings base, but the company is not yet turning that into enough residual cash to justify a more aggressive call. The balance sheet is the main support: net debt/EBITDA is effectively zero, current ratio is 9.3x, and EBITDA margin is 64.0% TTM, so the fleet still converts charter revenue efficiently. What keeps me at Hold is the cash conversion gap — levered free cash flow was only $4.5M TTM, which tells me vessel spending and financing costs are still absorbing most of the operating profit. I would move more toward a Buy if levered free cash flow turns clearly positive and stays there, because that would show the earnings power is reaching equity holders rather than just supporting the fleet.
Company Profile
Danaos owns and operates containerships and charters them out on time-charter contracts, so revenue is driven mainly by vessel utilization, charter rates, and contract coverage. The business is capital intensive, which means the fleet’s earning power matters as much as reported revenue, and the company’s value depends on how well it converts those charter earnings into cash after maintenance capex and newbuild commitments. In my view, that model can produce very strong margins when the charter book is tight, but it also leaves the equity exposed if vessel values or charter rates weaken.
Economic Moat
Business Model
Danaos’ structural edge is the combination of a large contracted fleet and high operating efficiency. As of February 2026, 73 of 75 containerships were on time charters, and that coverage gives the company visibility that many shipping peers do not have. The moat is not a classic brand or network effect; it is the discipline of locking in utilization and keeping the fleet productive, which is why the 64.0% EBITDA margin TTM matters so much. That margin profile is consistent with a charter platform that can still earn well even when the cycle is not perfect.
Business & Operating Risks
The main disclosed risk is charter-market volatility and vessel impairment. According to the risk factors in their SEC 10-K, Danaos said events and circumstances indicated potential impairment of certain container vessels as of December 31, 2025 and December 31, 2024, with future daily time charter equivalent rates for non-contracted days as the key assumption. Six of 75 container vessels carried impairment indicators at year-end 2025, so this is not abstract. I do not think that risk destroys the moat, but it does threaten the asset-value side of the model: if charter rates weaken enough, the contracted-fleet advantage still helps cash flow, yet it does not fully protect book value.
Management Discussion & Analysis
Management is responding to those risks by extending debt maturities and keeping the fleet largely contracted, but it is not de-risking the balance sheet in a full sense. The company issued $500M of 6.875% Senior Notes due 2032, used part of the proceeds to repay secured facilities, and plans to redeem the 8.500% Senior Notes due 2028, so refinancing risk is being pushed out rather than ignored. At the same time, the company committed $297.3 million of remaining payments for 25 containerships under construction, which tells me management is still leaning into fleet expansion. That is a rational response to a strong charter book, but it also means the company is choosing growth over balance-sheet simplification.
Recent Events
Recent events reinforce that same message. Danaos added four Newcastlemax drybulk carriers for $297.3M and two more 5,300 TEU newbuildings for $126M after year-end, while also declaring a $0.90 per share dividend in February 2026. In my view, those moves show confidence in cash generation, but they also widen the capital agenda at a time when vessel impairment indicators are already present. The moat is intact, yet it is being tested by the need to keep earning power ahead of a larger asset base.
Financial Analysis
Growth
DAC — Financial Growth (Quarterly, USD Mil)
| Metric | 2025-03-31 | 2025-06-30 | 2025-09-30 | 2025-12-31 | 2026-03-31 | 2026-06-30 |
|---|---|---|---|---|---|---|
| REVENUE (USD Mil) | — | 262.2 | 260.7 | 266.3 | 253.7 | 274.4 |
| EBIT (USD Mil) | — | 140.6 | 139.2 | 132.5 | 152.3 | 159.9 |
| EBITDA (USD Mil) | — | 181.3 | 180.4 | 174 | 193.1 | 201.7 |
| NET INCOME (USD Mil) | — | 130.9 | 130.6 | 117.9 | 140.4 | 151.8 |
| DILUTED EPS | 6.1 | 7.1 | 7.1 | — | 7.7 | 8.3 |
Source: Yahoo Finance — Quarterly Financial Statements
Revenue rose from $253.7M in Q1 2026 to $274.4M in Q2 2026, while EBITDA increased from $193.1M to $201.7M and net income from $140.4M to $151.8M. That is not a breakout growth profile, but it does show the charter book is still producing steady sequential improvement rather than deterioration. I read that as a mature shipping platform with stable earnings momentum, not a company that needs top-line acceleration to support the thesis.
Profitability
DAC — Profitability (TTM)
| Metric | TTM |
|---|---|
| Operating Margin (TTM) | 48.4% |
| Net Margin (TTM) | 51.3% |
| Return on Assets (TTM) | 6.4% |
| Return on Equity (TTM) | 14.1% |
| Gross Margin (TTM) | 70.8% |
| EBITDA Margin (TTM) | 64.0% |
Source: Yahoo Finance — Trailing Twelve Months (TTM)
TTM operating margin was 48.4%, net margin 51.3%, gross margin 70.8%, and EBITDA margin 64.0%, which is an unusually strong profit stack for a shipping name. Return on assets was 6.4% and return on equity 14.1%, so the business is generating respectable returns without needing aggressive financial engineering. The key point for me is that these margins confirm the moat described above: the contracted fleet is still converting revenue into profit at a high rate, even if cash conversion is not yet as strong as the income statement suggests.
Valuation
DAC — Valuation Multiples
| Metric | Value |
|---|---|
| Enterprise Value (USD Mil) | 2,730 |
| Trailing P/E | 5.2 |
| Forward P/E | 6.3 |
| Price/Book (mrq) | 0.7 |
| EV/Revenue | 2.6 |
| EV/EBITDA | 4 |
| Beta (5Y Monthly) | 0.85 |
| Forward EPS (USD) | 24.5 |
| Analyst Target Price – Low (USD) | 155 |
| Analyst Target Price – Mean (USD) | 164.5 |
| Analyst Target Price – High (USD) | 174 |
| # Analyst Opinions | 2 |
Source: Yahoo Finance
I would put fair value in a range of roughly $155–$174, which lines up with the analyst target range and sits above the current multiple set only if the company can convert earnings into more free cash flow. The stock trades at 4.0x EV/EBITDA, 2.6x EV/revenue, 5.2x trailing P/E, and 0.7x price/book, so it is not expensive on earnings or asset value. With only 2 analyst opinions, I do not think there is a broad consensus to anchor to, but the published target range of $155–$174 is close enough to my own view that I would not fight it aggressively. On earnings power, I would frame fair value around $24.5 of forward EPS, which is in line with the company’s own $24.5 and looks richer than most peers on a per-dollar-of-revenue basis because Danaos carries better margins and lower leverage than the group. That said, the valuation is not a clean bargain: the market is already paying for the balance-sheet quality, so the stock needs better free cash flow conversion to justify a higher multiple.
Leverage
DAC — Leverage & Coverage (Quarterly)
| Metric | Value |
|---|---|
| Total Debt/Equity % (mrq) | 29.8 |
| Current Ratio (mrq) | 9.3 |
| Total Debt (mrq, USD Mil) | 1,210.7 |
| Operating Cash Flow (TTM, USD Mil) | 715.6 |
| Levered Free Cash Flow (TTM, USD Mil) | 4.5 |
| Net Debt/EBITDA (TTM) | 0 |
| FCF Margin % (TTM) | 0.4% |
Source: Yahoo Finance — Quarterly Financial Statements
Danaos has a strong liquidity profile, with a 9.3x current ratio, $1.2B of total debt, and $1.2B of cash, which leaves net debt effectively flat. Total debt/equity is 29.8%, and net debt/EBITDA is effectively zero, so refinancing pressure is manageable rather than acute. The weak spot is not solvency; it is cash conversion. Levered free cash flow was only $4.5M TTM, and that is the figure I watch most closely because it shows how much of the operating profit is left after fleet investment and financing costs. In other words, the balance sheet gives Danaos time, but it does not by itself create equity upside.
Insider Activity
Insider ownership is high at 53.8%, which aligns management with shareholders, but it also means the stock can be influenced by a tightly held capital base. Short interest is 8.4% of float, so there is still some skepticism in the market, though not enough to define the thesis on its own. I view the insider profile as supportive, not decisive.
Comparable Analysis
Growth
| Company | Revenue TTM (USD Mil) | Revenue Growth YoY % | EBITDA TTM (USD Mil) | Diluted EPS TTM |
|---|---|---|---|---|
| DAC | 1,055.1 | 4.7% | 675 | 29.5 |
| CMRE | 857.4 | -4.0% | 546.4 | 2.6 |
| ZIM | 6,439.1 | 8.9% | 466.8 | 1.1 |
| SBLK | 1,203 | 44.5% | 497.8 | 2.5 |
| MATX | 3,459.2 | 16.7% | 674.6 | 14.8 |
| NMM | 1,479.7 | 25.2% | 835.9 | 15.3 |
Source: Yahoo Finance
DAC’s revenue growth was 4.7% TTM, which trails SBLK at 44.5%, MATX at 16.7%, and NMM at 25.2%, while ZIM posted 8.9% and CMRE was negative at -4.0%. DAC is not the fastest grower in the group, so the market should not be paying for growth leadership here. The more relevant comparison is that DAC’s steadier growth comes with much better margin quality than the faster growers.
Valuation
| Company | Trailing P/E | Forward P/E | EV/Revenue | EV/EBITDA | Price/Sales (TTM) | Price/Book (mrq) | Beta (5Y Monthly) | FCF Yield % (TTM) | Forward EPS | Analyst Target Price – Low | Analyst Target Price – Mean | Analyst Target Price – High | # Analyst Opinions |
|---|---|---|---|---|---|---|---|---|---|---|---|---|---|
| DAC | 5.2 | 6.3 | 2.6 | 4 | — | 0.7 | 0.85 | — | 24.5 | 155 | 164.5 | 174 | 2 |
| CMRE | 5.8 | 5.6 | 3.5 | 5.5 | 2.2 | 0.8 | 0.92 | -12.4% | 2.8 | 19 | 20 | 21 | 2 |
| ZIM | 24.4 | 3.1 | 1.1 | 14.9 | 0.5 | 0.9 | 1.11 | 29.4% | 9.2 | 16.5 | 25.8 | 38 | 4 |
| SBLK | 12.5 | 8.9 | 3.4 | 8.3 | 3 | 1.4 | 0.71 | 4.8% | 3.6 | 25.9 | 32.4 | 36 | 5 |
| MATX | 14.7 | 13.1 | 2.1 | 10.6 | 1.9 | 2.4 | 1.26 | 2.2% | 16.7 | 255 | 261.7 | 270 | 3 |
| NMM | 6 | 5.2 | 3.1 | 5.5 | 1.8 | 0.7 | 0.98 | -6.2% | 17.5 | 91 | 98 | 105 | 4 |
Source: Yahoo Finance
DAC trades at 4.0x EV/EBITDA and 5.2x trailing P/E, versus CMRE at 5.5x and 5.8x, ZIM at 14.9x and 24.4x, SBLK at 8.3x and 12.5x, MATX at 10.6x and 14.7x, and NMM at 5.5x and 6.0x. On a 1-year total return basis, DAC’s 67.5% trails MATX at 116.4% and ZIM at 104.4%, but it has delivered that return with a much cleaner balance sheet than ZIM and better profitability than CMRE. That is why I think the market is paying for quality rather than raw upside: DAC is cheaper than most peers on earnings, yet not cheap enough to ignore the fact that free cash flow is still thin.
Profitability
| Company | Operating Margin (TTM) | Net Margin (TTM) | Return on Assets (TTM) | Return on Equity (TTM) | Gross Margin (TTM) | EBITDA Margin (TTM) |
|---|---|---|---|---|---|---|
| DAC | 48.4% | 51.3% | 6.4% | 14.1% | 70.8% | 64.0% |
| CMRE | 47.0% | 39.5% | 6.7% | 16.0% | 69.8% | 63.7% |
| ZIM | 8.4% | 2.2% | 2.1% | 3.6% | 31.0% | 7.2% |
| SBLK | 39.7% | 23.9% | 5.4% | 11.7% | 47.3% | 41.4% |
| MATX | 16.1% | 13.4% | 6.9% | 17.2% | 23.0% | 19.5% |
| NMM | 38.8% | 30.3% | 5.1% | 13.2% | 90.3% | 56.5% |
Source: Yahoo Finance
DAC’s 48.4% operating margin, 51.3% net margin, 70.8% gross margin, and 64.0% EBITDA margin are all stronger than CMRE’s 47.0%, 39.5%, 69.8%, and 63.7%, and far ahead of ZIM’s 8.4%, 2.2%, 31.0%, and 7.2%. ROE of 14.1% and ROA of 6.4% are also solid, though not the best in the group. The key takeaway is that DAC’s profitability is high enough to justify a premium to the weaker operators, but the market is still right to ask whether those margins will translate into more cash.
Leverage
| Company | Total Debt/Equity % (mrq) | Current Ratio (mrq) | Total Debt (mrq, USD Mil) | Operating Cash Flow TTM (USD Mil) | Free Cash Flow TTM (USD Mil) | Net Debt/EBITDA (TTM) | FCF Margin % (TTM) |
|---|---|---|---|---|---|---|---|
| DAC | 29.8 | 9.3 | 1,210.7 | 715.6 | 4.5 | 0 | 0.4% |
| CMRE | 65.6 | 1.6 | 1,504.4 | 467.9 | -232.1 | 2 | -27.1% |
| ZIM | 136.8 | 1.2 | 5,312.6 | 1,660.8 | 991.5 | 7.9 | 15.4% |
| SBLK | 46.9 | 1.9 | 1,179 | 455.2 | 169.8 | 1.4 | 14.1% |
| MATX | 25.8 | 0.9 | 716.4 | 584.1 | 147.1 | 0.9 | 4.2% |
| NMM | 68.6 | 1.5 | 2,465.2 | 540.1 | -161.7 | 2.4 | -10.9% |
Source: Yahoo Finance
DAC’s total debt/equity of 29.8% is well below CMRE at 65.6%, ZIM at 136.8%, SBLK at 46.9%, and NMM at 68.6%, while its current ratio of 9.3x is far stronger than CMRE’s 1.6x, ZIM’s 1.2x, and NMM’s 1.5x. Net debt/EBITDA is effectively zero, which is a major advantage versus CMRE at 2.0x and ZIM at 7.9x. That lower leverage helps explain why DAC can trade at a lower EV/EBITDA multiple than some peers even though its margins are better; investors are paying less for balance-sheet risk, not just for operating quality.
Conclusion
I would put my rating as a Hold because the central tension is still unresolved: Danaos has the margins and balance sheet of a stronger stock, but it has not yet shown enough free cash flow to make that strength fully visible in equity value. The company’s 64.0% EBITDA margin and near-zero net debt tell me the operating model is working, yet levered free cash flow of only $4.5M TTM says the cash left for shareholders is still too small. That is why I do not want to upgrade the name simply on profitability alone.
I would raise my rating more toward a Buy if levered free cash flow moves materially above the current $4.5M TTM and stays there, because that would show the fleet is converting earnings into real residual cash rather than just funding new vessels. A second positive trigger would be operating margin staying above 45.0% for the next two quarters, meaning the core charter economics are still intact even as the fleet expands. If that happens while 2026 charter coverage remains near 99.5%, I would feel much more comfortable that the moat is translating into shareholder value.
The bear case is the opposite: if charter rates soften enough to push vessel impairment indicators beyond the current 6 of 75 ships, then both earnings and asset value would come under pressure at the same time. I would also move lower if levered free cash flow stays near breakeven despite the current earnings base, because that would tell me the company is still absorbing too much cash in fleet investment and financing costs.
For now, I think the balance of evidence still supports Hold. The moat is real, but the market is already giving some credit for it, and I want to see better cash conversion before I call the stock a clearer Buy.
What to Watch Next
- Levered free cash flow above $4.5M TTM — would support a move toward Buy.
- Operating margin above 45.0% for two quarters — would confirm earnings durability.
- Vessel impairment indicators staying at 6 of 75 or lower — would limit asset-value risk.
- 2026 charter coverage near 99.5% — would support cash-flow visibility.
- Free cash flow turning clearly positive — would show earnings are reaching shareholders.
What’s your take? I rated Danaos (DAC) HOLD above — but the goal here is to get this right, not just to publish an opinion. What would you add to this analysis, or which risk or catalyst do you think I’m under- or over-weighting? Tell me in the comments.
Data sourced from Yahoo Finance and SEC EDGAR. Not investment advice.
Leave a Comment