Executive Summary
Rating: SELL | EOSE
Measured from adjusted close on n/a to 2026-08-14. Sell ratings are correct when the stock falls; Hold is tracked as a +/-10% range. Daily-close data, not intraday.
I would put my rating as a Sell because Eos Energy is still burning cash at scale while trading on a sales multiple that already assumes a much cleaner earnings profile than the business has delivered. TTM operating cash flow was -$302M and levered free cash flow was -$281.9M, so the company is not yet funding itself, and the 21.2x EV/revenue multiple leaves little room for execution slippage. I would become more constructive only if quarterly revenue holds above about $55M, which would show the Q1 2026 run rate is durable rather than a timing spike, and if operating margin turns positive, meaning the core battery business is finally covering its fixed cost base.
Company Profile
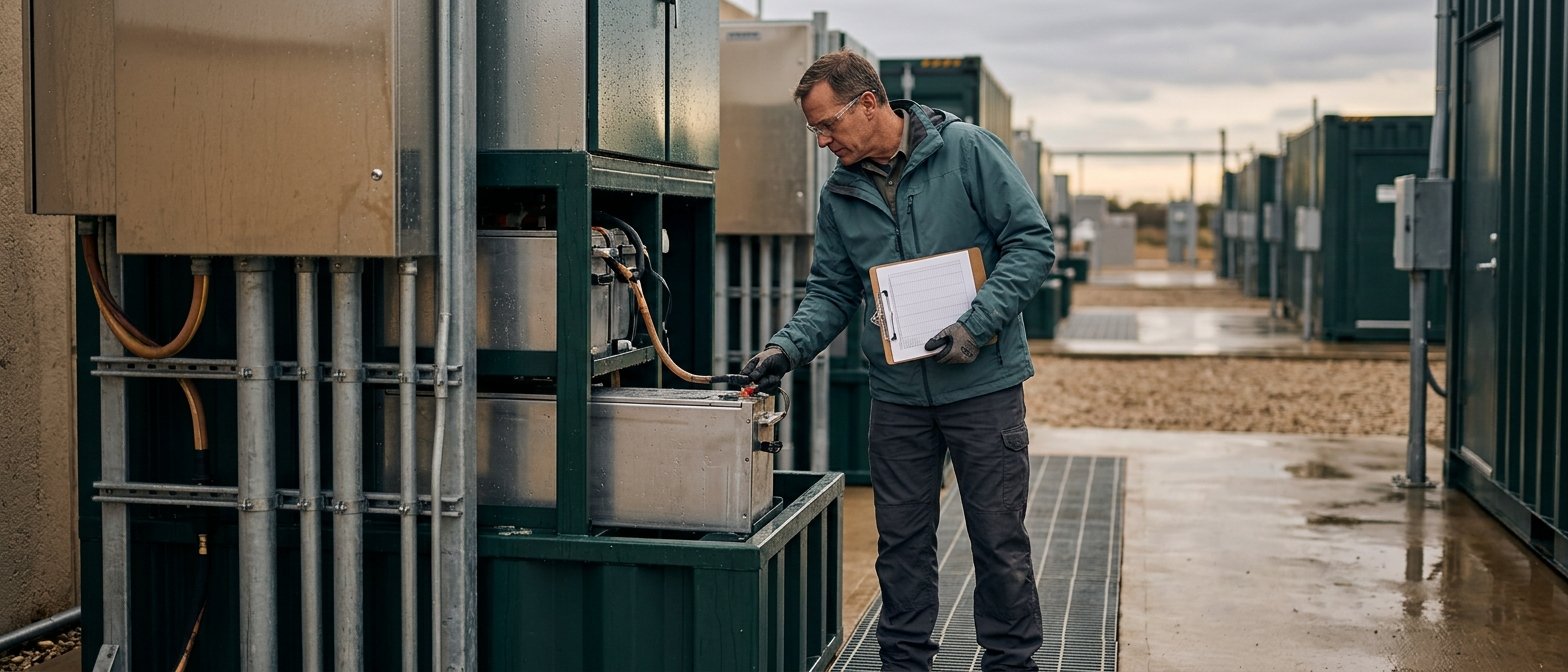
Eos Energy Enterprises designs, manufactures and sells zinc-based battery energy storage systems for utility-scale, microgrid and commercial and industrial applications. Revenue is recognized when batteries ship or, in some contracts, when they are delivered or placed in commercial operation. Founded in 2008, the company went public via a SPAC merger in 2020 and has since shifted from its earlier Gen 23 platform to the Z3 battery, which began shipping in Q3 2023. It operates one manufacturing site in Turtle Creek, Pennsylvania, and expects its idle Warrendale, Pennsylvania facility to become operational in 2026. Eos is listed on Nasdaq under EOSE and has 339.4M common shares outstanding.
Economic Moat
Business Model
The Z3 module is the only U.S.-designed and U.S.-manufactured battery module the company says can serve 3- to 12-hour, or longer, discharge applications, according to their SEC filings. That matters because long-duration storage is a harder technical problem than short-duration systems, and domestic manufacturing can be a real differentiator when customers care about supply-chain security and domestic-content incentives. Eos also has 31 patent families with 202 patents pending, issued or published across 30 countries, which gives the company some protection around its chemistry and system design. The DOE Loan Facility is another structural support, but I view it as a financing enabler rather than a moat by itself.
Business & Operating Risks
The highest-severity risk is funding and covenant failure under the DOE Loan Facility and Credit Agreement, which are secured by a substantial portion of the company’s assets and require quarterly minimum EBITDA, revenue and liquidity tests. The revenue and EBITDA covenants were deferred only until March 31, 2027, so the company still has to prove it can scale into those thresholds. If Eos misses them, lenders can accelerate remedies, stop future DOE funding and force a capital raise on potentially onerous or highly dilutive terms.
Manufacturing scale-up is another high-severity risk because Eos has limited experience in commercial manufacturing and only one operating site in Turtle Creek, with Warrendale not expected until 2026. That leaves the business exposed to any delay, quality issue or plant interruption. Supply-chain dependence is also material: Eos is heavily dependent on third-party suppliers and contractors, and shortages, tariffs or transport disruptions could slow production or raise input costs. Product performance and warranty exposure remain high severity as well, since defects, BMS bugs or field failures could trigger recalls, lost customers and warranty claims.
Management Discussion & Analysis
Management is signaling that Project AMAZE is the capital-allocation center of gravity. The $3035 million DOE Loan Facility is tied to 80% of eligible costs for each production line, and the first tranche’s $90.9M draw funded a battery automation line, which tells me expansion is being financed with project-level debt rather than purely through dilution. The January 2025 release of the final $40.5M under the $210.5M DDTL, after milestone completion, is a positive liquidity signal because it shows lenders are validating execution.
At the same time, the 2025 financing stack — $81.1M of equity proceeds, $240M from May convertible notes, $580.5M from November convertible notes and $458.2M from the registered direct offering — raised roughly $1.5B. That materially reduces near-term going-concern pressure, but it does not change the fact that 2025 operating cash flow was negative -$211.2M. The gap between the “no additional capital needed” narrative and the $1,197.4M of future debt payments, including springing maturities in 2030, is the key investor takeaway: the story is improving, but it is not yet self-funding.
Recent Earnings
Q1 2026 revenue was $57M, up from $10.5M in Q1 2025, which is the kind of step-up that can validate a commercialization story. I would not overread the quarter-to-quarter path, though: revenue moved through $15.2M in Q2 2025, $30.5M in Q3 2025 and $58M in Q4 2025 before easing slightly in Q1 2026, so the latest print looks more like a plateau than a fresh acceleration. The quarter also showed positive EBIT, EBITDA and net income, but the rest of the article’s cash-flow and margin data still point to a business that has not yet converted scale into durable self-funding, so I treat that quarter as encouraging but not yet decisive.
Financial Analysis
Growth
EOSE — Financial Growth (Quarterly, USD Mil)
| Metric | 2025-03-31 | 2025-06-30 | 2025-09-30 | 2025-12-31 | 2026-03-31 |
|---|---|---|---|---|---|
| REVENUE (USD Mil) | 10.5 | 15.2 | 30.5 | 58 | 57 |
| EBIT (USD Mil) | 21.9 | -218.1 | -636.3 | -113.8 | 521.1 |
| EBITDA (USD Mil) | 25 | -214.7 | -632.5 | -107.9 | 527.3 |
| NET INCOME (USD Mil) | 15.1 | -222.9 | -641.4 | -120.5 | 508.9 |
| DILUTED EPS | -0.2 | -1.1 | -4.9 | -0.8 | 0.1 |
Source: Yahoo Finance — Quarterly Financial Statements
Revenue rose from $10.5M in Q1 2025 to $57M in Q1 2026, a 444.7% increase that shows demand is scaling quickly. The more important question is whether that growth is translating into operating leverage, and the answer is not yet clear: the company still posted negative TTM gross profit of -$163.7M, which tells me the top line is outrunning the economics. In other words, the business is growing fast enough to matter, but it has not yet proven that growth can carry the cost structure.
Profitability
EOSE — Profitability (TTM)
| Metric | TTM |
|---|---|
| Operating Margin (TTM) | -139.1% |
| Net Margin (TTM) | -296.1% |
| Return on Assets (TTM) | -33.5% |
| Return on Equity (TTM) | — |
Source: Yahoo Finance — Trailing Twelve Months (TTM)
TTM operating margin was -139.1%, TTM net margin was -296.1% and TTM return on assets was -33.5%. Those figures say Eos is still in an early commercialization phase, where each dollar of sales is not yet covering the fixed cost base and asset returns remain deeply negative. I would focus first on a positive operating margin, because that would show the core battery business is absorbing overhead better; after that, net margin narrowing toward operating margin would tell me financing and other below-the-line costs are no longer overwhelming the model.
Valuation
EOSE — Valuation Multiples
| Metric | Value |
|---|---|
| Market Cap (USD Mil) | 2,597.3 |
| Enterprise Value (USD Mil) | 3,412.2 |
| Trailing P/E | — |
| Forward P/E | -161.3 |
| Price/Sales (TTM) | 16.2 |
| Price/Book (mrq) | -3 |
| EV/Revenue | 21.2 |
| EV/EBITDA | -12.8 |
| Beta (5Y Monthly) | 2.6 |
Source: Yahoo Finance
Eos screens at 21.2x EV/revenue and 16.2x price/sales, which is the right anchor because trailing earnings are not usable: EV/EBITDA is -12.8x and forward P/E is -161.3x, reflecting negative EBITDA and net losses rather than cheapness. The market is therefore pricing in a sharp move from today’s loss-making profile to sustained profitability, not just higher sales. Price/book is -3.0x because accumulated losses have pushed book equity below zero, so that ratio is not a valuation floor. Relative to the balance sheet, the multiple looks demanding: with $642.9M of debt and negative cash flow, the equity story depends on execution converting revenue into cash before financing needs reassert themselves.
Leverage
EOSE — Leverage & Coverage (Quarterly)
| Metric | Value |
|---|---|
| Total Debt/Equity % (mrq) | — |
| Current Ratio (mrq) | 4.7 |
| Total Debt (mrq, USD Mil) | 642.9 |
| Operating Cash Flow (TTM, USD Mil) | -302 |
| Levered Free Cash Flow (TTM, USD Mil) | -281.9 |
Source: Yahoo Finance — Quarterly Financial Statements
Eos’s leverage is manageable on liquidity but not yet self-funding. Current ratio was 4.7x, total debt was $642.9M, operating cash flow was -$302M and levered free cash flow was -$281.9M. The 4.7x current ratio gives near-term liquidity cushion, but negative cash generation means that cushion erodes unless operating performance improves. I would call refinancing risk medium: the balance sheet can absorb a downturn for now, yet any covenant test, higher rate on the DOE Loan Facility or near-term maturity would matter quickly because cash burn is still funding the business.
Comparable Analysis
Growth
| Company | Revenue TTM (USD Mil) | Revenue Growth YoY % | EBITDA TTM (USD Mil) | Diluted EPS TTM |
|---|---|---|---|---|
| EOSE | 160.7 | 444.7% | -267.5 | -6.4 |
| FLNC | 2,584.6 | 7.7% | -18.4 | -0.3 |
| NXT | 3,559.4 | -4.7% | 738.2 | 3.8 |
| VRT | 10,843.4 | 30.1% | 2,383 | 4 |
| AMPX | 90.3 | 152.9% | -16.9 | -0.3 |
| BE | 2,449 | 130.4% | 231.6 | 0 |
Source: Yahoo Finance
Eos’s revenue growth of 444.7% TTM is far ahead of FLNC at 7.7%, NXT at -4.7%, VRT at 30.1%, AMPX at 152.9% and BE at 130.4%. That is a real growth outlier, but the peer set also shows why growth alone is not enough: Eos still posted EBITDA of -$267.5M and diluted EPS of -6.4, so the top-line surge is still early-stage growth rather than proven scale.
Valuation
| Company | Trailing P/E | Forward P/E | EV/Revenue | EV/EBITDA | Price/Sales (TTM) | Price/Book (mrq) | Market Cap (USD Mil) | Enterprise Value (USD Mil) | Beta (5Y Monthly) |
|---|---|---|---|---|---|---|---|---|---|
| EOSE | — | -161.3 | 21.2 | -12.8 | 16.2 | -3 | 2,597.3 | 3,412.2 | 2.6 |
| FLNC | — | 123 | 1.3 | -184.2 | 1.8 | 8.9 | 4,570.9 | 3,398.5 | 2.8 |
| NXT | 32.8 | 21.6 | 5 | 24.1 | 5.4 | 8.1 | 19,159.9 | 17,826.2 | 1.7 |
| VRT | 83.3 | 37.6 | 11.9 | 54 | 11.8 | 32.3 | 127,927.4 | 128,691.8 | 2 |
| AMPX | — | 285.3 | 24.8 | -131.8 | 25.4 | 20.6 | 2,290.1 | 2,234.3 | 2.1 |
| BE | — | 75.7 | 38.4 | 406.1 | 38.2 | 101.5 | 93,556.4 | 94,044.4 | 3.7 |
Source: Yahoo Finance
Eos trades at 21.2x EV/revenue and 16.2x price/sales, above FLNC at 1.3x and 1.8x, NXT at 5.0x and 5.4x, VRT at 11.9x and 11.8x, AMPX at 24.8x and 25.4x and BE at 38.4x and 38.2x. The only peer with a richer sales multiple is BE, but BE also has 9.6% operating margin and $298.2M of operating cash flow TTM, which Eos lacks. That gap tells me the market is paying for growth optionality, not current earnings power, and the leverage profile makes that premium harder to justify.
Profitability
| Company | Operating Margin (TTM) | Net Margin (TTM) | Return on Assets (TTM) | Return on Equity (TTM) |
|---|---|---|---|---|
| EOSE | -139.1% | -296.1% | -33.5% | — |
| FLNC | -8.4% | -1.6% | -1.3% | -12.7% |
| NXT | 18.2% | 16.5% | 12.2% | 29.6% |
| VRT | 16.4% | 14.4% | 11.1% | 45.1% |
| AMPX | -23.4% | -44.0% | -10.6% | -44.2% |
| BE | 9.6% | 0.2% | 3.1% | 1.3% |
Source: Yahoo Finance
Eos’s operating margin of -139.1% and net margin of -296.1% are far below FLNC at -8.4% and -1.6%, AMPX at -23.4% and -44.0%, and BE at 9.6% and 0.2%. NXT and VRT are already profitable, with operating margins of 18.2% and 16.4%, which highlights how far Eos still has to go. The margin gap matters more because the company is still carrying debt; until gross profit turns positive and stays there, the business is destroying capital faster than peers that have already crossed into durable profitability.
Leverage
| Company | Total Debt/Equity % (mrq) | Current Ratio (mrq) | Total Debt (mrq, USD Mil) | Operating Cash Flow TTM (USD Mil) | Free Cash Flow TTM (USD Mil) |
|---|---|---|---|---|---|
| EOSE | — | 4.7 | 642.9 | -302 | -281.9 |
| FLNC | 8,773.1% | 1.4 | 402 | -236 | -133.7 |
| NXT | 226.6% | 2.4 | 52.9 | 562.9 | 311.7 |
| VRT | 7,691.3% | 1.5 | 3,264.9 | 2,577.3 | 1,964.8 |
| AMPX | 599.7% | 7.1 | 6.6 | -54.3 | -35.3 |
| BE | 31,147.6% | 5 | 2,952.8 | 298.2 | 265.5 |
Source: Yahoo Finance
Eos has $642.9M of debt and a 4.7x current ratio, versus FLNC’s $402M debt and 1.4x current ratio and BE’s $2,952.8M debt with a 5.0x current ratio. The issue is not just the debt balance, it is the cash profile behind it: Eos’s operating cash flow was -$302M TTM and free cash flow was -$281.9M, so debt is being carried without internal funding. That makes the balance sheet a financing bridge, not a competitive advantage.
Conclusion
I would put my rating as a Sell because Eos still trades on a revenue story while the balance sheet and cash flow remain deeply negative. The stock’s 21.2x EV/revenue multiple already discounts a much cleaner earnings profile than the company has delivered, and TTM operating cash flow of -$302M plus levered free cash flow of -$281.9M tells me the business is still relying on external capital to bridge the gap.
I would raise my rating toward Hold if Eos can show two things at once: quarterly revenue holding above roughly $55M, which would confirm the Q1 2026 run rate is not a one-off, and a positive operating margin, meaning the core battery business is finally covering its fixed cost base. If that happens while the current ratio stays near 4.7x, the market could start treating the stock as a commercialization story rather than a financing story.
I would move from Sell to Strong Sell if revenue falls back below about $30M in a quarter, roughly half the latest level, because that would tell me the Q1 2026 step-up was timing rather than durable demand. I would also turn more negative if operating cash burn widens beyond the current -$302M TTM pace or if covenant pressure under the DOE facility forces another dilutive raise, since that would mean the balance sheet is absorbing losses faster than the business is scaling.
After weighing both paths, I lean to the bear case first because the company still has to prove that its revenue base can convert into cash before the financing stack tightens again. The upside case is real if execution holds, but until Eos shows a positive operating margin and sustained quarterly revenue above the mid-$50M range, I think investors are paying for progress that has not yet become durable.
What’s your take? I rated Eos Energy Enterprises (EOSE) SELL above — but the goal here is to get this right, not just to publish an opinion. What would you add to this analysis, or which risk or catalyst do you think I’m under- or over-weighting? Tell me in the comments — the best pushback makes the next article better.
Data sourced from Yahoo Finance. Not investment advice.
Leave a Comment