
| Company | Oct 25 | Nov 25 | Dec 25 | Jan 26 | Feb 26 | Mar 26 | Apr 26 | May 26 | Jun 26 | Jul 26 | 12-Mo |
|---|---|---|---|---|---|---|---|---|---|---|---|
| STUB | +14% | -39% | +15% | +4% | -32% | -35% | +17% | +35% | +31% | -34% | -50% |
| LYV | -8% | -12% | +8% | +2% | +11% | -6% | +4% | +7% | +9% | -5% | +18% |
| SPOT | -6% | -9% | -3% | -14% | +3% | -6% | -8% | +11% | -8% | +9% | -20% |
| NFLX | -7% | -4% | -13% | -11% | +15% | -0% | -3% | -8% | -17% | +0% | -38% |
| RBLX | -18% | -16% | -15% | -19% | +4% | -18% | -2% | -15% | +15% | -35% | -74% |
| DIS | -2% | -7% | +10% | -1% | -6% | -9% | +8% | -2% | -5% | -0% | -18% |
Source: Yahoo Finance monthly adjusted close.
Quick Thesis
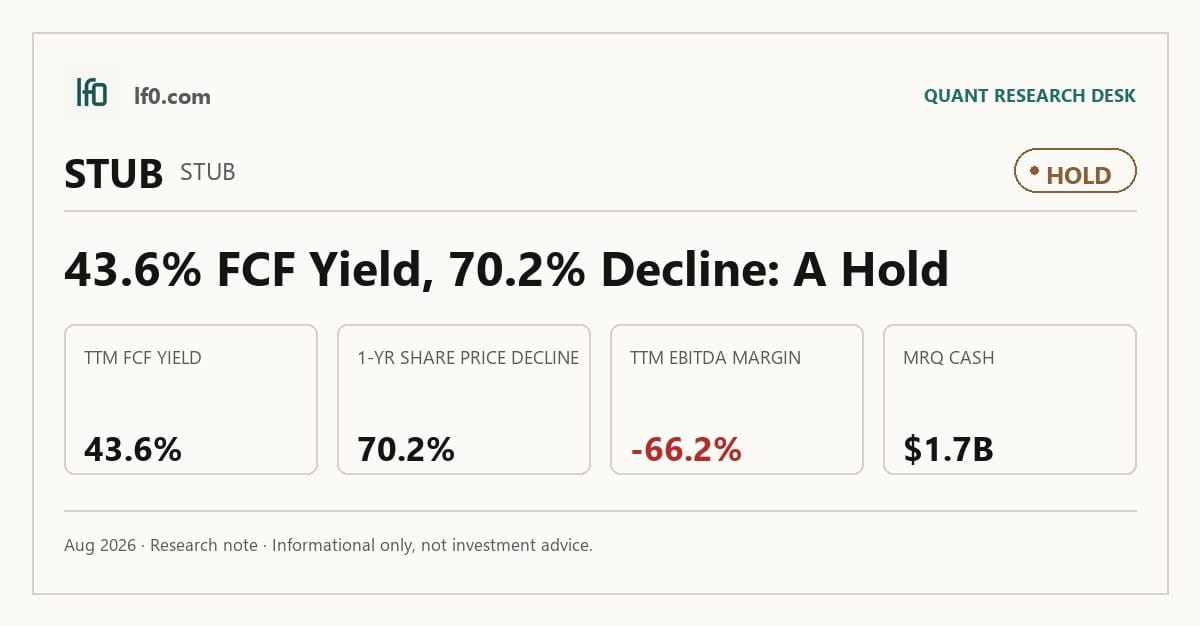
- Rated Hold — cash generation is strong, but profitability is still not durable.
- Best strength: 43.6% TTM FCF yield and $1.1B levered free cash flow.
- Biggest risk: -66.2% TTM EBITDA margin, despite 82.1% gross margin.
- Valuation looks fair to slightly cheap at 1.36x EV/Revenue and 9.9x forward P/E.
- I would turn more constructive if EBITDA margin stays positive and quarterly revenue holds above $450M.
Executive Summary
Rating: HOLD | STUB
Measured from adjusted close on 2026-08-26 to 2026-10-09. Sell ratings are correct when the stock falls; Hold is tracked as a +/-10% range. Daily-close data, not intraday. Calls are tracked for 182 days from publication, then frozen as a final record.
I would put my rating as a Hold because StubHub has real cash generation and a cleaner balance sheet than the headline losses suggest, but the earnings base has not yet proven to me that it can absorb the company’s still-heavy operating spend. TTM free cash flow margin was 56.3% and net debt to EBITDA was 0.25x, which gives management room to invest and weather volatility, yet TTM EBITDA margin was -66.2% and TTM net margin was -91.3%, so I do not see a business that has fully earned a higher rating.
The key strength is the marketplace model itself: StubHub keeps 82.1% gross margin TTM, which tells me the core take rate is healthy and the platform still has pricing power at the transaction layer. The key risk is that this gross profit is being absorbed by overhead and IPO-related costs before it reaches the bottom line, so the moat is visible in gross economics but not yet in durable operating profit.
I would raise my rating more towards a Buy if quarterly revenue holds above $450M for two straight quarters and EBITDA margin stays positive, because that would show the Q1 2026 revenue level of $446M is not a one-off and that the business is finally converting its gross margin into operating profit.
Company Profile
StubHub Holdings Inc. runs a global secondary ticketing marketplace for live events through StubHub and viagogo. Buyers and sellers meet on the platform, and the company earns marketplace transaction fees rather than owning inventory in the traditional sense. It is also in the early stages of direct issuance, where rights holders list tickets directly on the marketplace, which could broaden the revenue base beyond resale.
The company went public through a SPAC merger in 2025. Its current structure reflects the 2025 divestiture of the international StubHub business, after which certain trademarks, domain names, and platform rights were licensed outside the U.S. and Canada for ten years, with that license amended and approved in June 2025.
StubHub is headquartered across hubs in New York, Los Angeles, Atlanta, Ireland, and Switzerland, and had about 900 full-time employees as of December 31, 2025, including about 250 outside the U.S. It trades on Nasdaq under STUB.
Economic Moat
Business Model
I think the moat rests on marketplace liquidity, brand trust, and the breadth of the platform rather than on exclusive supply. The company’s SEC filings describe a system that combines technology, global distribution, data intelligence, and trusted brands, and that mix is hard to rebuild quickly because a competitor would need both buyer demand and seller supply at scale before the network effects start to work.
FanProtect, StubHub, and viagogo also matter because they support trust in a market where the company does not control the box office or the venue. In my view, that makes the moat real but not impenetrable: the advantage comes from depth of liquidity and transaction confidence, not from owning the underlying event inventory.
The move into direct issuance is important because it broadens the platform from pure resale into a wider live-events marketplace. That should help the moat if it increases ticket selection and seller monetization, but it also raises the bar for execution because the company has to prove it can expand beyond its original niche without losing the liquidity advantage that made the marketplace valuable in the first place.
Business & Operating Risks
The main disclosed risk is dependence on live event supply and attendance. If sports, concerts, theater, or other live events are disrupted, ticket volume falls first and transaction fees follow, so this is a direct threat to the marketplace engine rather than a distant operating issue.
Traffic concentration is the other meaningful risk. StubHub relies heavily on search engines and app-store distribution, so a policy change or ranking shift could force higher marketing spend or reduce traffic, which would pressure the same liquidity loop that supports the moat.
Regulation and litigation are also material because ticket resale sits in a heavily watched area. Pricing rules, privacy requirements, and jurisdiction-specific restrictions can shape how the platform markets and monetizes inventory, and that makes compliance a real operating cost rather than boilerplate risk.
Taken together, these risks do not break the moat, but they do test it at the exact points where it is supposed to work: liquidity, discovery, and trust. The risk profile threatens the scale advantage more than the brand itself, which means the moat is intact but still under pressure.
Management Discussion & Analysis
Management is actively addressing the leverage and liquidity side of the risk profile, even if the operating risk remains unresolved. The IPO proceeds were used to repay debt, and that matters because it reduces refinancing pressure while the company is still proving that its marketplace can translate gross profit into durable earnings.
The 2025 numbers show why I am not ready to call the operating reset complete. Revenue was $1.7B in FY2025, down 1.4% year over year, while adjusted EBITDA fell to $232.4M, so management’s growth narrative has not yet produced cleaner operating leverage. At the same time, sales and marketing rose to $971.7M and capitalized software spending increased, which tells me the company is still leaning into growth rather than harvesting cash.
I also think management is trying to broaden the moat through product expansion and international reach, but the monetization mix still looks uneven. The company cited higher transaction volume and international markets as drivers of gross merchandise sales, yet lower average transaction fees and weaker inventory-risk ticket sales show that volume growth has not fully converted into pricing power.
Recent Events
The most important recent event is the March 4, 2026 IPO lock-up expiration, which ended the restricted period on March 6, 2026 after the company’s year-end results were already out. That does not change the business model, but it does raise the risk of insider selling and short-term share volatility, so the market may need time to absorb a larger free float.
The other notable event is the May 13, 2026 release of results for the quarter ended March 31, 2026. Because that filing was routine disclosure rather than a strategic transaction, financing change, or leadership shift, I read it as confirmation that the company is still in execution mode rather than in a new phase of the story.
Financial Analysis
Growth
STUB — Financial Growth (Quarterly, USD Mil)
| Metric | 2025-03-31 | 2025-06-30 | 2025-09-30 | 2025-12-31 | 2026-03-31 |
|---|---|---|---|---|---|
| REVENUE (USD Mil) | 397.6 | 430.3 | 468.1 | 449.2 | 446 |
| EBITDA (USD Mil) | 18.1 | -21.1 | -1,359.1 | -17.6 | 70.4 |
| DILUTED EPS | -0.1 | -0.2 | -4.3 | -1.6 | 0.1 |
Source: Yahoo Finance — Quarterly Financial Statements
Revenue rose to $446M in Q1 2026 from $397.6M in Q1 2025, a 12.2% increase, which tells me the platform is still growing even after the Q4 2025 step-down to $449.2M. EBITDA improved to $70.4M in Q1 2026 from $18.1M a year earlier, and that matters because it suggests the business can still generate operating leverage when event flow is healthy.
The sharp Q3 2025 drop in EBIT, EBITDA, and net income was not explained clearly in the materials I reviewed, so I would not overread it as a new run-rate. What matters more is that the latest quarter shows both revenue growth and a return to positive EBITDA, which is the first sign that the marketplace can still scale into profit.
Profitability
STUB — Profitability (TTM)
| Metric | TTM |
|---|---|
| Operating Margin (TTM) | 3.4% |
| Net Margin (TTM) | -91.3% |
| Return on Assets (TTM) | -15.0% |
| Return on Equity (TTM) | -102.9% |
| Gross Margin (TTM) | 82.1% |
| EBITDA Margin (TTM) | -66.2% |
Source: Yahoo Finance — Trailing Twelve Months (TTM)
TTM gross margin of 82.1% is the cleanest proof that the core marketplace economics work. StubHub keeps most of each ticket dollar after direct costs, which is exactly what I want to see from a platform business with network effects.
The problem is that this gross profit is not yet flowing through the rest of the income statement. TTM operating margin was 3.4%, but TTM EBITDA margin was -66.2% and TTM net margin was -91.3%, so overhead and non-cash charges are still overwhelming the business. TTM return on assets was -15% and TTM return on equity was -103%, which tells me capital is not yet being turned into acceptable returns.
That gap between gross margin and EBITDA margin is the key issue for the thesis. If management can keep the gross take rate intact while bringing operating costs down, the moat should start to show up in earnings rather than just in transaction economics.
Valuation
STUB — Valuation Multiples
| Metric | Value |
|---|---|
| Market Cap (USD Mil) | 2,503 |
| Enterprise Value (USD Mil) | 2,638 |
| Trailing P/E | — |
| Forward P/E | 9.9 |
| Price/Sales (TTM) | 1.3 |
| Price/Book (mrq) | 1.5 |
| EV/Revenue | 1.4 |
| EV/EBITDA | -2.1 |
| Beta (5Y Monthly) | — |
| FCF Yield % (TTM) | 43.6% |
| Forward EPS (USD) | 0.7 |
| Analyst Target Price – Low (USD) | 7.5 |
| Analyst Target Price – Mean (USD) | 11.3 |
| Analyst Target Price – High (USD) | 16 |
| # Analyst Opinions | 12 |
Source: Yahoo Finance
StubHub trades at 1.36x EV/Revenue and 1.29x price to sales, which is the right lens because trailing earnings are not useful after the FY2025 net loss. Forward P/E is 9.9x on forward EPS of 0.7, and the market cap of $2.5B against enterprise value of $2.6B tells me the equity is not being priced as if leverage is the main story.
The 43.6% TTM FCF yield is unusually high, and I think that is the number the market is leaning on. In my view, the stock is priced as if cash generation is already durable, not as a speculative turnaround, which is why the valuation looks fair to slightly cheap rather than obviously cheap.
On my read of the peer multiple work, fair value sits in a broad range of roughly $4-$33 per share, with the lower end tied to a low-growth cash generator and the upper end tied to a much richer platform multiple. The analyst consensus target range of 7.5–16.0, based on 12 opinions, sits above the low end of my range and overlaps the middle, so my view is not far from consensus but is a little more cautious on the upside because I weight the negative EBITDA margin more heavily than the target-price crowd appears to.
I would also frame forward earnings in a narrower band around $0.6-$0.8 per share if the current quarter is a reasonable starting point, which is close to the company’s own 0.7 forward EPS. That is cheap relative to peers only if the margin recovery holds, because a low EPS number on a low multiple is not enough by itself when the business is still working through negative EBITDA.
Leverage
STUB — Leverage & Coverage (Quarterly)
| Metric | Value |
|---|---|
| Total Debt/Equity % (mrq) | 67.2 |
| Current Ratio (mrq) | 1 |
| Total Debt (mrq, USD Mil) | 1,396.3 |
| Operating Cash Flow (TTM, USD Mil) | 635.2 |
| Levered Free Cash Flow (TTM, USD Mil) | 1,090.6 |
| Net Debt/EBITDA (TTM) | 0.2 |
| FCF Margin % (TTM) | 56.3% |
Source: Yahoo Finance — Quarterly Financial Statements
StubHub’s leverage is manageable, not stretched. Total debt to equity was 67.2% in the most recent quarter, total debt was $1.4B, and net debt to EBITDA was 0.25x, which tells me the balance sheet is not the main constraint on the equity story.
Liquidity is only adequate, though, because the current ratio was 1.0. That is just above the breakeven point for near-term obligations, so the company has room, but not a lot of cushion if working capital swings against it.
Cash generation is the real support here. Operating cash flow was $635.2M TTM, levered free cash flow was $1.1B, and FCF margin was 56.3%, which means the business is converting earnings into cash efficiently even while reported profitability remains weak. That combination is why I do not see leverage as a bear case by itself; the issue is whether management can keep cash flow strong while the operating margin normalizes.
Insider Activity
The insider tape is not a strong confidence signal. I see open-market sales but no offsetting open-market purchases in the recent sample, which leaves insiders net sellers over a limited period.
The largest sale was concentrated in one holder, so I would not overstate it as a broad vote of no confidence. Even so, the absence of buying means insiders are not yet using their own capital to signal that the current valuation is obviously cheap.
Comparable Analysis
Growth
| Company | Revenue TTM (USD Mil) | Revenue Growth YoY % | Diluted EPS TTM |
|---|---|---|---|
| STUB | 1,936.4 | 33.2% | -5.9 |
| LYV | 26,272.5 | 9.4% | -1.1 |
| SPOT | 18,113 | 13.9% | 18.6 |
| NFLX | 48,370.8 | 13.4% | 3.2 |
| RBLX | 5,685.6 | 35.9% | -1.4 |
| DIS | 98,861 | 6.8% | 4.8 |
Source: Yahoo Finance
StubHub’s TTM revenue growth of 33.2% is faster than LYV at 9.4%, SPOT at 13.9%, NFLX at 13.4%, and DIS at 6.8%, but it trails RBLX at 35.9%. That puts STUB near the top of the group on growth, although the comparison is less flattering once you look at diluted EPS, where STUB was -5.9 versus positive EPS at SPOT, NFLX, and DIS.
I think the important point is that StubHub is growing like a high-growth platform but still earning like a business in transition. The market should not pay a premium growth multiple unless that revenue growth starts to show up in EBITDA and EPS.
Valuation
| Company | Trailing P/E | Forward P/E | EV/Revenue | EV/EBITDA | Price/Sales (TTM) | Price/Book (mrq) | Market Cap (USD Mil) | Enterprise Value (USD Mil) | FCF Yield % (TTM) | Forward EPS | Analyst Target Price – Low | Analyst Target Price – Mean | Analyst Target Price – High | # Analyst Opinions |
|---|---|---|---|---|---|---|---|---|---|---|---|---|---|---|
| STUB | — | 9.9 | 1.4 | -2.1 | 1.3 | 1.5 | 2,503 | 2,638 | 43.6% | 0.7 | 7.5 | 11.3 | 16 | 12 |
| LYV | — | 96.2 | 1.8 | 29.8 | 1.6 | 508.8 | 42,317 | 46,265 | 4.0% | 1.9 | 145 | 202 | 222 | 24 |
| SPOT | 29.5 | 30.3 | 5.9 | 39.5 | 6.2 | 11.5 | 112,559 | 106,040 | 1.4% | 18.1 | 422.6 | 610.3 | 724.4 | 39 |
| NFLX | 25.1 | 21.4 | 7 | 23.1 | 7 | 11.3 | 340,277 | 339,976 | 7.5% | 3.8 | 70 | 93.7 | 135 | 45 |
| RBLX | — | -30.9 | 4.6 | -31.2 | 4.8 | 180.9 | 27,525 | 26,324 | 5.4% | -1.2 | 30 | 48.3 | 70 | 34 |
| DIS | 22.3 | 14.5 | 2.4 | 11.2 | 1.9 | 1.7 | 186,655 | 234,321 | 2.6% | 7.4 | 88 | 127.8 | 160 | 32 |
Source: Yahoo Finance
StubHub’s 1.36x EV/Revenue is below LYV at 1.8x, SPOT at 5.9x, NFLX at 7.0x, RBLX at 4.6x, and DIS at 2.4x, so the stock screens as inexpensive on a sales basis. That discount is partly explained by the company’s weaker earnings profile, but I do not think it fully explains the gap because STUB also has a 43.6% FCF yield, which is far above LYV at 4.0%, SPOT at 1.4%, NFLX at 7.5%, RBLX at 5.4%, and DIS at 2.6%.
Forward P/E is 9.9x on 0.7 forward EPS, which is well below LYV at 96.2x, SPOT at 30.3x, NFLX at 21.4x, RBLX at -30.9x, and DIS at 14.5x. In my view, the market is not paying for earnings power that is already visible in peers, and the low multiple is more a reflection of execution risk than of a broken business model.
A simple peer EV/Revenue frame implies a wide range of roughly $4-$33 per share for STUB, depending on whether the market values it like a low-multiple cash generator or a richer platform. That range is useful because it shows the stock is still being priced as a special case, not as a clean comp.
Profitability
| Company | Operating Margin (TTM) | Net Margin (TTM) | Return on Assets (TTM) | Return on Equity (TTM) | Gross Margin (TTM) | EBITDA Margin (TTM) |
|---|---|---|---|---|---|---|
| STUB | 3.4% | -91.3% | -15.0% | -102.9% | 82.1% | -66.2% |
| LYV | 6.7% | 0.5% | 2.1% | 17.7% | 25.8% | 5.9% |
| SPOT | 13.7% | 18.4% | 12.2% | 44.5% | 32.8% | 14.8% |
| NFLX | 33.4% | 28.2% | 16.1% | 49.5% | 49.1% | 30.4% |
| RBLX | -13.3% | -17.6% | -7.7% | -432.3% | 25.7% | -14.8% |
| DIS | 19.3% | 8.7% | 4.8% | 8.0% | 37.6% | 21.2% |
Source: Yahoo Finance
StubHub’s 82.1% gross margin is better than LYV at 25.8%, SPOT at 32.8%, NFLX at 49.1%, RBLX at 25.7%, and DIS at 37.6%. The issue is that the advantage stops there: operating margin was 3.4%, below SPOT, NFLX, and DIS, and EBITDA margin was -66.2%, which is far weaker than every profitable peer in the group.
That spread tells me the business model is good at generating gross profit but still poor at converting it into bottom-line returns. Until that changes, I would treat the company as a lower-quality operator than the profitable media and streaming names, even though the gross economics are strong.
Leverage
| Company | Total Debt/Equity % (mrq) | Current Ratio (mrq) | Total Debt (mrq, USD Mil) | Operating Cash Flow TTM (USD Mil) | Net Debt/EBITDA (TTM) | FCF Margin % (TTM) |
|---|---|---|---|---|---|---|
| STUB | 67.2 | 1 | 1,396.3 | 635.2 | 0.2 | 56.3% |
| LYV | 620.2 | 0.9 | 11,282.7 | 2,608.7 | 1.4 | 6.5% |
| SPOT | 5.6 | 2.1 | 466 | 3,337 | -2.4 | 8.5% |
| NFLX | 55.2 | 1.1 | 16,654.7 | 11,970.8 | 0.5 | 52.5% |
| RBLX | 1,423.3 | 0.8 | 1,836 | 2,100.4 | 1.4 | 26.0% |
| DIS | 39.4 | 0.7 | 46,041 | 16,989 | 1.9 | 4.9% |
Source: Yahoo Finance
StubHub’s total debt to equity of 67.2% is far below LYV at 620.2% and RBLX at 1,423.3%, while net debt to EBITDA of 0.25x is also better than LYV at 1.4x, RBLX at 1.4x, and DIS at 1.9x. The balance sheet is therefore cleaner than several peers, and that helps explain why the equity can trade on cash flow rather than on distress risk.
The cash conversion profile is the real differentiator. StubHub’s 56.3% FCF margin is much stronger than LYV at 6.5%, SPOT at 8.5%, RBLX at 26.0%, and DIS at 4.9%, which means the company has more financial flexibility than the leverage headline alone suggests. In other words, the valuation discount is not coming from balance-sheet stress; it is coming from uncertainty about whether the operating margin can catch up.
Conclusion
I would put my rating as a Hold because the core tension is between strong cash generation and weak operating durability. StubHub is already producing a 43.6% TTM FCF yield and has only 0.25x net debt to EBITDA, but the business still carries a -66.2% EBITDA margin and a -91.3% net margin, so the market is paying for cash flow before the earnings base has fully stabilized.
The bull case is straightforward. If quarterly revenue can stay above $450M and EBITDA margin remains positive, that would tell me the Q1 2026 improvement is not just a seasonal bounce and that the marketplace is finally converting its 82.1% gross margin into durable operating profit. In that scenario, I would move more towards a Buy because the current 1.36x EV/Revenue would start to look too low for a business with this level of cash conversion.
The bear case is just as clear. If revenue slips back below $400M in a quarter, or if operating cash flow falls materially from the $635.2M TTM level, I would move from Hold to Sell because that would show the platform is not sustaining the volume needed to support the current valuation. A weaker tape would be even more concerning if short interest keeps rising while the 50-day moving average stays below the 200-day moving average, since that would suggest the market is losing patience before the earnings base has repaired.
I lean Hold rather than Buy because the upside depends on execution that is visible only in part so far, while the downside is cushioned by cash and low net leverage. The next two quarters matter more than the last twelve months here, and I want to see revenue hold the mid-$400M range with positive EBITDA margin before I call the stock a clearer winner.
What to Watch Next
- Quarterly revenue above $450M — would support a more constructive view.
- EBITDA margin staying positive — would show gross profit is reaching the bottom line.
- Operating cash flow holding near $635.2M TTM — would confirm cash generation is durable.
- Net debt to EBITDA staying near 0.25x — would keep refinancing risk contained.
- Revenue falling below $400M — would strengthen the case for a lower rating.
What’s your take? I rated StubHub (STUB) HOLD above — but the goal here is to get this right, not just to publish an opinion. What would you add to this analysis, or which risk or catalyst do you think I’m under- or over-weighting? Tell me in the comments.
Sources
- SEC 10-K Annual Report — filed 2026-03-05
- SEC 8-K Filing (2026-05-13)
- SEC 8-K Filing (2026-03-04)
- SEC Form 4 Insider Transaction (2026-06-04)
- SEC Form 4 Insider Transaction (2026-06-04)
- SEC Form 4 Insider Transaction (2026-06-04)
Data sourced from Yahoo Finance and SEC EDGAR. Not investment advice.
Leave a Comment