
| Company | Jul 25 | Aug 25 | Sep 25 | Oct 25 | Nov 25 | Dec 25 | Jan 26 | Feb 26 | Mar 26 | Apr 26 | May 26 | Jun 26 | 12-Mo |
|---|---|---|---|---|---|---|---|---|---|---|---|---|---|
| CMG | -24% | -2% | -7% | -19% | +9% | +7% | +5% | -4% | -14% | +6% | -6% | +7% | -39% |
| SBUX | -3% | -0% | -4% | -4% | +8% | -3% | +9% | +7% | -9% | +18% | -5% | +3% | +14% |
| MCD | +3% | +4% | -3% | -2% | +4% | -1% | +3% | +8% | -8% | -6% | -5% | -3% | -5% |
| QSR | +2% | -7% | +2% | +2% | +10% | -5% | -2% | +7% | +4% | +9% | -7% | -2% | +13% |
| YUM | -3% | +2% | +4% | -9% | +11% | -1% | +3% | +9% | -8% | +3% | -7% | +8% | +10% |
| WING | +12% | -13% | -23% | -14% | +22% | -10% | +11% | -2% | -40% | +6% | -4% | +10% | -48% |
Source: Yahoo Finance monthly adjusted close.
Executive Summary
Rating: HOLD | CMG
Measured from adjusted close on 2026-08-17 to 2026-10-01. Sell ratings are correct when the stock falls; Hold is tracked as a +/-10% range. Daily-close data, not intraday. Calls are tracked for 182 days from publication, then frozen as a final record.
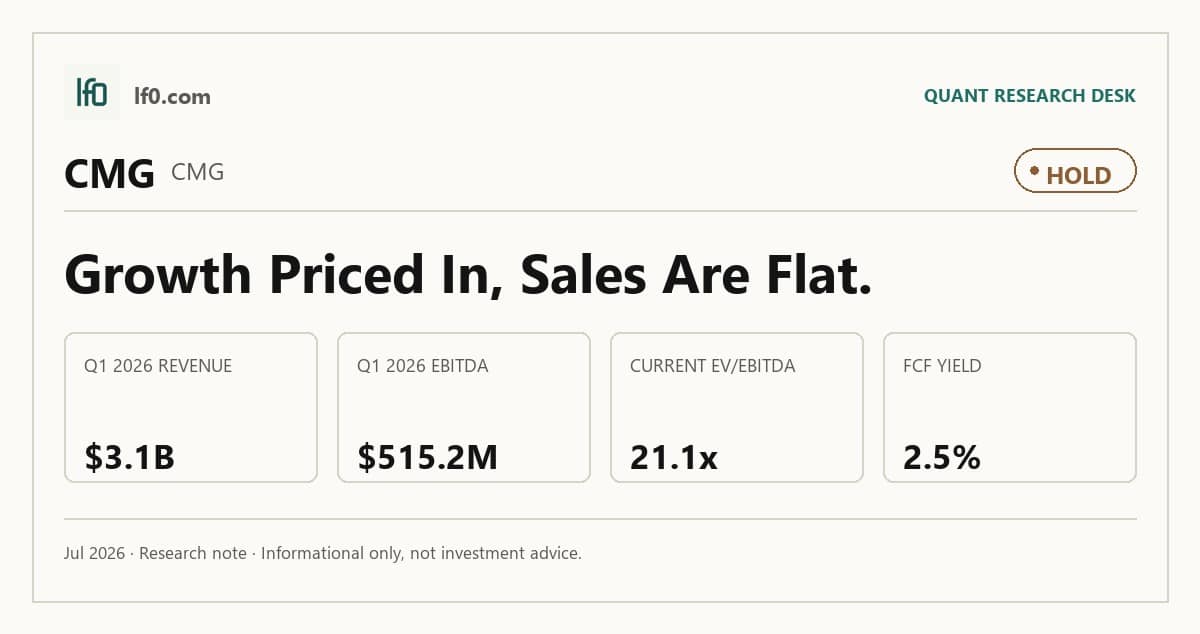
I would put my rating as a Hold because Chipotle still has a durable sourcing and execution system, but the current valuation already assumes more earnings progress than the latest numbers support. TTM EV/Revenue is 4.0x and EV/EBITDA is 21.1x, while Q1 2026 diluted EPS fell to $0.23 from $0.28 in Q1 2025, so investors are paying a premium for a business whose top line is still growing but whose profit conversion has slowed. I would raise my rating more towards a Buy if comparable restaurant sales move from about flat in 2026 to low single-digit positive growth and operating margin pushes back toward the high teens, because that would show the current unit expansion plan is translating into real operating leverage.
Company Profile
Chipotle Mexican Grill, Inc. owns and operates Chipotle Mexican Grill restaurants that sell burritos, burrito bowls, quesadillas, tacos, and salads. Revenue comes entirely from restaurant sales. The company opened its first location in Denver in 1993 and has since grown to 3,938 U.S. restaurants, 104 international restaurants, and 14 partner-operated restaurants as of December 31, 2025. It runs U.S. operations through 11 regions and reports as one segment.
Chipotle trades on the New York Stock Exchange under CMG. As of December 31, 2025, it employed 130,301 people worldwide, including 127,116 in the U.S. and 3,185 internationally across Canada, France, Germany, and the U.K. Digital sales represented 36.7% of food and beverage revenue in 2025, which tells me the business now depends on both in-restaurant traffic and digital ordering, but digital remains a channel rather than a separate revenue stream.
Economic Moat
Business Model
The supply chain for responsibly raised proteins and produce is the hardest part of Chipotle’s model to replicate within 3 years, because the company works with a limited list of approved suppliers and has spent years building Food with Integrity standards, ingredient traceability, and supplier intervention steps before ingredients reach the restaurant. I feel that this is the most defensible element because a well-funded rival can copy menu items faster than it can recreate Chipotle’s sourcing discipline, food safety protocols, and restaurant-level execution across 3,938 U.S. restaurants and 104 international restaurants. Digital sales were 36.7% of food and beverage revenue in 2025, up from 35.1% in 2024, so the app, Chipotle Rewards, and Chipotlanes are becoming more important to convenience and frequency. The company’s 14 international partner-operated restaurants add a small but useful test bed for overseas expansion, while trademark protection on Chipotle, Food with Integrity, Responsibly Raised, and Chipotle Rewards matters less than the operating system behind it.
Chipotle has also become structurally stronger over the last five years. In 2021, the company had 2,918 U.S. restaurants and 44 international restaurants; today it has 3,938 U.S. restaurants and 104 international restaurants, so the footprint has expanded by 1,080 restaurants and the business is more geographically diversified, even if the U.S. still dominates the base. Prior filings pointed to digital growth and new openings, and by 2025 that had evolved into a broader Recipe for Growth that added AI, a relaunched Rewards Program, and more Chipotlanes. Nearly 90% of in-restaurant leadership roles were filled through internal promotions in 2025, with more than 23,000 employees promoted, which supports execution as the unit count rises. In my view, that combination makes the moat more operational than legal: the edge is in how the system runs, not in a single product feature.
Business & Operating Risks
Food safety is the clearest disclosed risk because a single incident can hit brand trust, traffic, and ingredient costs at the same time. The risk factors note that Chipotle uses fresh, unprocessed produce, handles raw chicken, and relies on employees cooking with traditional methods, which raises food safety risk versus some competitors. Delivery and catering add another layer because food is transported, stored, and served in conditions that are not under the company’s control. I view this as a direct threat to the brand and margin structure, not a remote compliance issue.
Labor availability and labor law exposure are the second major headwind because the company owns and operates all of its U.S. and Canada restaurants, so staffing problems flow straight into service quality and unit economics. The filing cites the aggressive pace of openings, predictive scheduling laws, just-cause termination rules, and lawsuits over wages, overtime, meal and rest breaks, and pay transparency. It also notes that longer wait times, temporary closures of the digital make line, and lower guest satisfaction have already occurred or may continue, which is consistent with a business that can lose throughput when staffing slips. The risk is material because labor costs are one of the company’s most important expenses, so even a modest wage or turnover shock can move restaurant margins quickly.
Supply chain risk is not generic boilerplate either. The filing names beef, avocados, and other produce, plus chicken, beef, dairy, tortillas, and pork, and it says some ingredients come from Mexico, Canada, and China. That leaves the company exposed to tariffs, trade sanctions, weather, animal disease outbreaks, and supplier disruption. If one of those key inputs spikes, Chipotle may have to suspend menu items instead of fully passing through the cost, which would hurt traffic as well as gross margin. The disclosed risks do touch the moat, but they do not break it; they mainly pressure the execution system that supports it.
Management Discussion & Analysis
Management is actively responding to the operating risks above by leaning harder into throughput, digital, and control of the restaurant base. According to management’s discussion in the 10-K, 2026 comparable restaurant sales are expected to be about flat, while restaurant openings are guided to approximately 350 to 370 company-owned and partner-operated units, with around 80% of new company-owned restaurants including a Chipotlane, a drive-through format that should support speed and unit economics. That tells me management is trying to offset labor and service risk with a format that improves convenience and throughput.
The capital plan is also more aggressive. 2026 capital expenditures are expected to be about $834.1M, including about $531.8M for new restaurants and about $266.9M for existing restaurants and technology. At the same time, the company ended 2025 with $1.1B of cash and marketable investments, $500M of undrawn revolver capacity, and $1.7B still available under share repurchase authorizations, so management is keeping a liquidity buffer while continuing buybacks. I view that as disciplined, but it is not a demand catalyst by itself; it is a way to keep the system funded while the company tries to prove that flat comps are temporary.
Management’s track record is mixed rather than cleanly strong. In 2025, management expected comparable restaurant sales growth in the low to mid-single-digit range, yet the year ended with a 1.7% decline, so the demand call missed by a wide margin. The filing also pointed to digital sales at 35.1% of food and beverage revenue and a continued Chipotlane rollout, and the current filing shows digital sales at 36.7% and 257 Chipotlane openings in 2025, which confirms that the operating model is still shifting toward convenience and digital mix even if it has not translated into positive comparable sales. I would not call that a broken process, but I do think it means management has earned less credit on forecasting precision than on execution.
Recent Events
The most significant development I see is the January 12, 2026 leadership transition, when Chris Brandt and Roger Theodoredis stepped out of executive officer roles and moved into temporary advisory positions. In my view, that tests execution at a moment when Chipotle is still leaning on brand and digital expansion, because the company is replacing two senior operators while keeping them available only for a limited handoff period.
The April 27, 2026 hires of Fernando Machado as Chief Brand Officer and Arlie Sisson as Chief Digital Officer strengthen the thesis more clearly. Machado is being brought in to lead global marketing and brand positioning, while Sisson is tasked with digital capabilities and operating efficiency, which supports the Recipe for Growth strategy and suggests management is investing behind customer engagement and throughput rather than standing still.
The April 29, 2026 earnings release is routine on its face, but it confirms the company is still using quarterly results to reset expectations and communicate execution. Taken together, the recent 8-Ks leave the investment case modestly strengthened on strategic talent additions, even though the January turnover means Chipotle still has to prove the new team can execute cleanly.
Financial Analysis
Growth
CMG — Financial Growth (Quarterly, USD Mil)
| Metric | 2025-03-31 | 2025-06-30 | 2025-09-30 | 2025-12-31 | 2026-03-31 |
|---|---|---|---|---|---|
| REVENUE (USD Mil) | 2,875.3 | 3,063.4 | 3,003.4 | 2,983.5 | 3,088.2 |
| EBIT (USD Mil) | 493.6 | 575.1 | 498.3 | 445.7 | 418.5 |
| EBITDA (USD Mil) | 580.8 | 666.1 | 588.8 | 538.4 | 515.2 |
| NET INCOME (USD Mil) | 386.6 | 436.1 | 382.1 | 330.9 | 302.8 |
| DILUTED EPS | 0.3 | 0.3 | 0.3 | 0.2 | 0.2 |
Source: Yahoo Finance — Quarterly Financial Statements
Revenue rose to $3.1B in Q1 2026 from $2.9B in Q1 2025, a 7.4% increase, after moving through $3.1B in Q2 2025, $3B in Q3 2025, and $3B in Q4 2025. EBITDA fell from $580.8M in Q1 2025 to $515.2M in Q1 2026, while net income declined from $386.6M to $302.8M and diluted EPS from $0.28 to $0.23. That split matters because the top line is still expanding, but the earnings bridge is weakening, so the market is paying for growth that is not yet converting cleanly into profit.
Profitability
CMG — Profitability (TTM)
| Metric | TTM |
|---|---|
| Operating Margin (TTM) | 13.3% |
| Net Margin (TTM) | 12.0% |
| Return on Assets (TTM) | 13.5% |
| Return on Equity (TTM) | 49.2% |
| Gross Margin (TTM) | 39.6% |
| EBITDA Margin (TTM) | 19.0% |
Source: Yahoo Finance — Trailing Twelve Months (TTM)
TTM operating margin was 13.3%, gross margin was 39.7%, and EBITDA margin was 19.0%, so the business is still carrying a 26.4-point gap from gross profit to operating profit. That spread says the core food economics are healthy, but restaurant-level overhead, labor, and occupancy still absorb a large share of sales, which is typical for a scaled growth brand that has not yet converted its store base into full operating leverage.
TTM net margin was 12.0%, only 1.3 points below operating margin, which tells me non-operating charges are not the main issue here. TTM return on assets was 13.5% and TTM return on equity was 49.2%, a wide gap that points to leverage amplifying shareholder returns rather than returns being driven purely by asset productivity. I would watch for operating margin moving toward the high teens and net margin staying close to it, because that would show the company is turning restaurant expansion into cleaner earnings, not just higher sales.
Valuation
CMG — Valuation Multiples
| Metric | Value |
|---|---|
| Market Cap (USD Mil) | 44,177 |
| Enterprise Value (USD Mil) | 48,552 |
| Trailing P/E | 31.6 |
| Forward P/E | 25.4 |
| Price/Sales (TTM) | 3.6 |
| Price/Book (mrq) | 18.4 |
| EV/Revenue | 4 |
| EV/EBITDA | 21.1 |
| Beta (5Y Monthly) | 0.96 |
| FCF Yield % (TTM) | 2.5% |
| Forward EPS (USD) | 1.4 |
| Analyst Target Price – Low (USD) | 35 |
| Analyst Target Price – Mean (USD) | 43.2 |
| Analyst Target Price – High (USD) | 52 |
| # Analyst Opinions | 32 |
Source: Yahoo Finance
Chipotle trades at 4.0x enterprise value to revenue and 3.6x price to sales on a trailing twelve-month basis, with 21.1x EV/EBITDA and 31.6x trailing P/E. Forward P/E is 25.4x and forward EPS is 1.35, so the stock is priced for earnings growth, but not for a step-change in margin. The PEG ratio is 1.84, which suggests the market is not giving full credit for growth relative to the multiple, while FCF yield is 2.46%, modest for a company valued at 4.0x revenue. Beta is 0.964, so the shares have moved roughly with the market rather than behaving like a defensive staple.
On the analysis here, I would put fair value in a range of roughly $31-$64 per share. That range is built from the peer EV/Revenue spread and then adjusted for Chipotle’s stronger cash conversion than some peers but weaker growth and leverage profile than the best operators. It sits around the current trading range and is close to the 43.2 analyst mean target, which tells me the Street and my own read are not far apart even though I weight the flat comp outlook more heavily than the consensus appears to.
I would also frame EPS in a $1.2-$1.6 range over the next year if margins stabilize and comps recover modestly. That sits above the company’s 1.35 forward EPS estimate at the midpoint, so the market is already assuming some recovery, but not a full re-acceleration. Relative to peers, that EPS path is not especially rich on a like-for-like basis because Chipotle’s multiple is still higher than most of the group even though its earnings growth is not leading the pack.
The valuation picture is therefore neutral to slightly expensive. The stock is not cheap enough to ignore the slower profit conversion, but it is also not priced for a collapse.
Leverage
CMG — Leverage & Coverage (Quarterly)
| Metric | Value |
|---|---|
| Total Debt/Equity % (mrq) | 217.9 |
| Current Ratio (mrq) | 0.9 |
| Total Debt (mrq, USD Mil) | 5,245.9 |
| Operating Cash Flow (TTM, USD Mil) | 2,208.2 |
| Levered Free Cash Flow (TTM, USD Mil) | 1,087.9 |
| Net Debt/EBITDA (TTM) | 1.9 |
| FCF Margin % (TTM) | 9.0% |
Source: Yahoo Finance — Quarterly Financial Statements
Total debt was $5.2B at March 31, 2026, and Total Debt/Equity was 217.9%, so leverage is meaningful even for a cash-generative restaurant operator. Current Ratio was 0.9x, which leaves limited near-term liquidity cushion if working capital tightens. Operating Cash Flow was $2.2B TTM and Levered Free Cash Flow was $1.1B TTM, while FCF Margin was 9.0%, showing that earnings still convert into real cash despite heavy reinvestment.
Net Debt/EBITDA was 1.9x, a manageable level that gives Chipotle room to absorb a slowdown, but not enough to ignore refinancing or operating pressure if cash generation weakens. Total Cash was $871.4M at March 31, 2026, which helps bridge short-term needs, yet the sub-1.0x current ratio means I would watch for any deterioration in same-store sales or capex discipline. The balance sheet is serviceable, but it is not a source of upside.
Insider Activity
The insider transaction record I see here is clearly net selling, with 14 open-market sales versus 1 open-market purchase over the 2025-01-07 to 2026-05-20 window. The activity is not broad buying support; it is concentrated on the sell side, led by multiple senior insiders rather than a single isolated trade, which points to weak insider alignment with shareholders at current prices.
Comparable Analysis
Growth
| Company | Revenue TTM (USD Mil) | Revenue Growth YoY % | Diluted EPS TTM |
|---|---|---|---|
| CMG | 12,138.6 | 7.4% | 1.1 |
| SBUX | 38,471.6 | 8.8% | 1.3 |
| MCD | 27,446 | 9.4% | 12.1 |
| QSR | 9,589 | 7.3% | 3.1 |
| YUM | 8,486 | 15.2% | 6.2 |
| WING | 709.5 | 7.4% | 4.1 |
Source: Yahoo Finance
CMG’s revenue grew 7.4% TTM, below MCD at 9.4% and SBUX at 8.8%, and only slightly above QSR at 7.3% and WING at 7.4%. YUM was the clear growth leader at 15.2%, so CMG is not being rewarded for category-leading top-line acceleration. That matters because the stock still trades like a premium grower even though the peer set shows faster expansion elsewhere.
Valuation
| Company | Trailing P/E | Forward P/E | EV/Revenue | EV/EBITDA | Price/Sales (TTM) | Price/Book (mrq) | Market Cap (USD Mil) | Enterprise Value (USD Mil) | Beta (5Y Monthly) | FCF Yield % (TTM) | Forward EPS | Analyst Target Price – Low | Analyst Target Price – Mean | Analyst Target Price – High | # Analyst Opinions |
|---|---|---|---|---|---|---|---|---|---|---|---|---|---|---|---|
| CMG | 31.6 | 25.4 | 4 | 21.1 | 3.6 | 18.4 | 44,177 | 48,552 | 0.96 | 2.5% | 1.4 | 35 | 43.2 | 52 | 32 |
| SBUX | 80.5 | 35.1 | 3.7 | 26.5 | 3.1 | -14.2 | 120,227 | 142,943 | 0.97 | -1.1% | 3 | 81 | 106.5 | 137 | 31 |
| MCD | 22.1 | 18.9 | 8.9 | 16.4 | 6.9 | -147.9 | 190,210 | 243,935 | 0.42 | 3.1% | 14.2 | 250 | 326.6 | 407 | 31 |
| QSR | 24.1 | 17 | 4.4 | 14.7 | 3.6 | 7 | 34,230 | 42,240 | 0.53 | 4.8% | 4.4 | 76 | 85.3 | 100 | 24 |
| YUM | 23.9 | 19.8 | 6.3 | 17.8 | 4.8 | -5.6 | 40,770 | 53,225 | 0.56 | 3.1% | 7.5 | 147 | 174.3 | 200 | 21 |
| WING | 35.1 | 25.6 | 7.1 | 22.3 | 5.5 | -4.9 | 3,876 | 5,018 | 1.78 | 2.3% | 5.6 | 143 | 231.4 | 305 | 27 |
Source: Yahoo Finance
CMG trades at 21.1x EV/EBITDA, 31.6x trailing P/E, 25.4x forward P/E, and 3.6x price/sales. MCD is cheaper on EV/EBITDA at 16.4x and forward P/E at 18.9x, while QSR screens lower at 14.7x EV/EBITDA and 17.0x forward P/E; YUM sits at 17.8x and 19.8x, and WING at 22.3x and 25.6x. CMG’s 2.5% FCF yield is better than SBUX at -1.1% and WING at 2.3%, but below MCD at 3.1% and QSR at 4.8%, so the market is paying a premium for a cash generator that is not the best in class.
Using peer EV/Revenue of 3.7x to 7.1x on CMG’s $12.1B TTM revenue implies an enterprise value of about $45.1B to $85.9B, or roughly $31.1 to $63.7 per share after netting about $4.4B of net debt and dividing by 1.2827B shares. That range brackets the current price, which tells me the stock is not obviously cheap on peer multiples. The premium is harder to justify because CMG’s growth is only mid-pack while its leverage is still meaningful.
Profitability
| Company | Operating Margin (TTM) | Net Margin (TTM) | Return on Assets (TTM) | Return on Equity (TTM) | Gross Margin (TTM) | EBITDA Margin (TTM) |
|---|---|---|---|---|---|---|
| CMG | 13.3% | 12.0% | 13.5% | 49.2% | 39.6% | 19.0% |
| SBUX | 8.4% | 3.9% | 7.4% | — | 21.9% | 14.0% |
| MCD | 44.3% | 31.6% | 13.6% | — | 57.4% | 54.2% |
| QSR | 25.9% | 10.0% | 6.4% | 28.1% | 33.9% | 29.9% |
| YUM | 31.1% | 20.5% | 23.3% | — | 45.7% | 35.3% |
| WING | 29.0% | 15.8% | 18.5% | — | 49.1% | 31.6% |
Source: Yahoo Finance
CMG’s gross margin of 39.7% sits above SBUX at 21.9% and QSR at 33.9%, but below MCD at 57.4% and YUM at 45.7%. Its EBITDA margin of 19.0% also trails MCD at 54.2%, QSR at 29.9%, YUM at 35.3%, and WING at 31.6%. The pattern says CMG’s issue is not cost of revenue alone; operating leverage is weaker than the best peers, which points to restaurant-level scale and opex intensity rather than a broken unit model.
CMG’s ROE is 49.2% and ROA is 13.5%, versus QSR at 28.1% ROE and 6.4% ROA, MCD at 13.6% ROA, and SBUX at 7.4% ROA. The wide ROE-to-ROA spread tells me CMG’s equity returns are amplified by a relatively thin book equity base, so the headline ROE is not pure operating superiority. That is why I would not pay up for returns alone without better evidence that margin expansion is durable.
Leverage
| Company | Total Debt/Equity % (mrq) | Current Ratio (mrq) | Total Debt (mrq, USD Mil) | Operating Cash Flow TTM (USD Mil) | Free Cash Flow TTM (USD Mil) | Net Debt/EBITDA (TTM) | FCF Margin % (TTM) |
|---|---|---|---|---|---|---|---|
| CMG | 217.9 | 0.9 | 5,245.9 | 2,208.2 | 1,087.9 | 1.9 | 9.0% |
| SBUX | — | 0.9 | 24,408.5 | 4,345.7 | -1,304.1 | 4.2 | -3.4% |
| MCD | — | 1.1 | 54,895 | 10,535 | 5,952.2 | 3.6 | 21.7% |
| QSR | 296.4 | 1 | 15,683 | 1,747 | 1,650 | 5.1 | 17.2% |
| YUM | — | 0.7 | 13,144 | 2,022 | 1,261.5 | 4.2 | 14.9% |
| WING | — | 2.2 | 1,270.4 | 189.2 | 87.5 | 5.1 | 12.3% |
Source: Yahoo Finance
CMG’s total debt/equity is 217.9% and net debt/EBITDA is 1.9x, which is lighter than QSR at 5.1x, YUM at 4.2x, MCD at 3.6x, SBUX at 4.2x, and WING at 5.1x. CMG’s 9.0% FCF margin is also healthier than SBUX at -3.4% and WING at 12.3%, but below MCD at 21.7% and QSR at 17.2%, so the company has room to fund growth without stress, yet not enough excess cash flow to justify a top-of-group multiple.
The leverage gap helps explain part of the valuation spread: investors are paying for a cleaner balance sheet at MCD and stronger cash yield at QSR, while CMG sits in the middle on both. That is why the stock looks more expensive on a growth-adjusted basis than the headline multiple alone suggests.
Conclusion
I would put my rating as a Hold because the key tension is now between a still-strong operating system and a valuation that already discounts a recovery in comps and margins that has not fully shown up. The moat is intact, but the latest numbers show that revenue growth is not yet flowing through to earnings at the pace the multiple implies.
I would raise my rating more towards a Buy if comparable restaurant sales move from about flat to low-single-digit positive growth for two straight quarters and operating margin moves back toward the high teens, because that would tell me the current unit expansion plan is finally creating operating leverage. On the current $12.1B revenue base, a move from 13.3% operating margin to 17.0% would imply roughly $446M of additional operating profit, which would materially improve the earnings runway and make the 21.1x EV/EBITDA multiple easier to defend.
I would move from Hold to Sell if 2026 comparable sales stay flat or turn negative while labor and food costs keep pressure on margins, because then the market would be paying a growth multiple for a business that is not delivering growth. A second warning sign would be if Q1 2026’s $0.23 EPS proves to be the high-water mark rather than the start of a recovery, since that would imply the current share price is still anchored to earnings power that has not reappeared.
Weighing both paths, I lean to Hold because the bull case needs proof from several quarters, while the bear case only needs the current flat comp trend to persist. Chipotle is still a high-quality operator, but at 31.6x trailing P/E and a 2.5% FCF yield, I do not see enough near-term upside to call it a Buy, and I do not see enough deterioration to call it a Sell.
What’s your take? I rated Chipotle Mexican Grill (CMG) HOLD above — but the goal here is to get this right, not just to publish an opinion. What would you add to this analysis, or which risk or catalyst do you think I’m under- or over-weighting? Tell me in the comments.
Sources
- SEC 10-K Annual Report — filed 2026-02-04
- SEC 8-K Filing (2026-04-29)
- SEC 8-K Filing (2026-04-27)
- SEC 8-K Filing (2026-02-03)
- SEC 8-K Filing (2026-01-12)
- SEC Form 4 Insider Transaction (2026-05-21)
- SEC Form 4 Insider Transaction (2026-02-25)
- SEC Form 4 Insider Transaction (2026-02-17)
- SEC 10-K Annual Report — FY2026
- SEC 10-K Annual Report — FY2025
- SEC 10-K Annual Report — FY2024
- SEC 10-K Annual Report — FY2023
- SEC 10-K Annual Report — FY2022
Data sourced from Yahoo Finance and SEC EDGAR. Not investment advice.
Leave a Comment