Expected price range
Each range is set from the stock’s recent price history and our Hold rating, using its own 1-year realised volatility (33% annualised) as the width of a ~68% statistical band, and checked against that rating so the range leans the same way as our view. Starting price $53.47 (close 2026-11-11). The stock traded between $50.19 and $68.34 over the last 6 months and between $32.13 and $68.34 over the last year. This is an illustration of where our view and normal volatility point, not a forecast, price target or investment advice; the stock can move outside it.
| Company | Nov 25 | Dec 25 | Jan 26 | Feb 26 | Mar 26 | Apr 26 | May 26 | Jun 26 | Jul 26 | Aug 26 | Sep 26 | Oct 26 | 12-Mo |
|---|---|---|---|---|---|---|---|---|---|---|---|---|---|
| DAR | +14% | -2% | +27% | +16% | +16% | +4% | -8% | -8% | +11% | +9% | -8% | -8% | +74% |
| INGR | -7% | +3% | +8% | -1% | -4% | -0% | -9% | -7% | +6% | +4% | -7% | +2% | -13% |
| TSN | +13% | +2% | +11% | +0% | -1% | +0% | -5% | -5% | +1% | -5% | -8% | +13% | +15% |
| ADM | +1% | -5% | +17% | +3% | +5% | +3% | +8% | -4% | +4% | +3% | -2% | -3% | +31% |
| LW | -4% | -29% | +11% | +5% | -12% | +3% | +0% | +0% | +22% | +5% | -24% | +30% | -10% |
| BG | +2% | -7% | +28% | +7% | +5% | -0% | -2% | -13% | -0% | +10% | -8% | -10% | +5% |
Source: Yahoo Finance monthly adjusted close.
<a id="lf0-thesis"></a>
Quick Thesis
- Rated hold — growth is real, but the stock already prices it in.
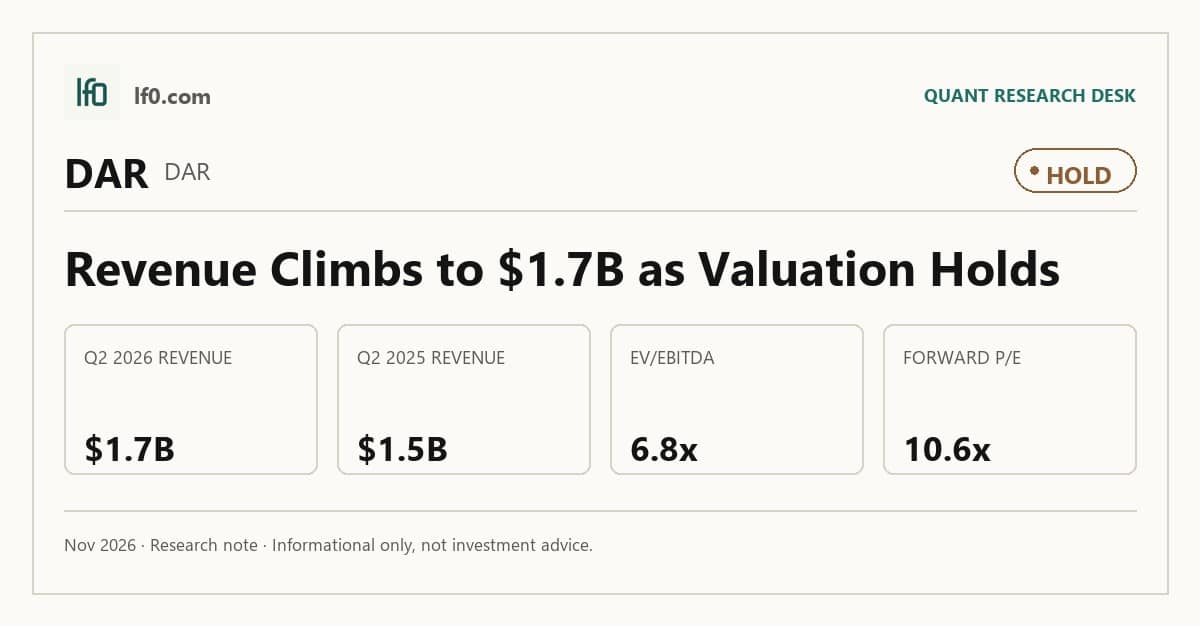
- Revenue reached <span class="lf0-key" data-src="Yahoo Finance — Quarterly Income Statement: Total Revenue (2026-06-30)">$1.72e+03M</span> in Q2 2026, and EBITDA rose to <span class="lf0-key" data-src="Yahoo Finance — Quarterly Income Statement: EBITDA (2026-06-30)">$686M</span>.
- The main risk is leverage: total debt was <span class="lf0-key" data-src="Yahoo Finance — Key Statistics (Balance Sheet): Total Debt (mrq)">$4171M</span> and debt/equity was <span class="lf0-key" data-src="Yahoo Finance — Key Statistics (Balance Sheet): Total Debt/Equity % (mrq)">78.61%</span>.
- Valuation looks fair, with EV/EBITDA at <span class="lf0-key" data-src="Yahoo Finance — Key Statistics: EV/EBITDA">6.75x</span> and forward P/E at <span class="lf0-key" data-src="Yahoo Finance — Key Statistics: Forward P/E">10.5x</span>.
- I would turn more constructive if operating margin stays near <span class="lf0-key" data-src="Yahoo Finance — Key Statistics: Operating Margin (TTM)">10%</span> for two more quarters.
<a id="lf0-summary"></a>
Executive Summary
Measured from adjusted close on 2026-11-11 to 2026-11-11. Sell ratings are correct when the stock falls; Hold is tracked as a +/-10% range. Daily-close data, not intraday. Calls are tracked for 182 days from publication, then frozen as a final record.
I would put my rating as a Hold because Darling Ingredients is growing faster than peers, but the current valuation already reflects that improvement and the balance sheet still carries <span class="lf0-key" data-src="Yahoo Finance — Key Statistics (Balance Sheet): Total Debt (mrq)">$4171M</span> of debt. Revenue grew 14.5% TTM, the fastest in the peer set, while operating margin held at 9.6% TTM and net margin reached 12.5% TTM, so the business is converting growth into earnings rather than just adding sales.
I would raise my rating more towards a Buy if quarterly revenue stays above <span class="lf0-key" data-src="Yahoo Finance — Quarterly Income Statement: Total Revenue (2026-06-30)">$1.72e+03M</span>, which would show the current run rate is holding, and if operating margin moves closer to 11%, which would add roughly $35M of quarterly operating profit versus a 9.6% margin on $1.7B. That would tell me the earnings step-up is still expanding rather than settling back into a normal range, and it would make the current 10.0x trailing P/E easier to own.
I would move from Hold to Sell if quarterly revenue slips back toward $1.55e+03M and operating margin falls below 8%, because that would signal the recent earnings inflection was not durable and would cut roughly $25M to $30M from quarterly operating profit versus the current margin profile. A weaker top line combined with <span class="lf0-key" data-src="Yahoo Finance — Key Statistics (Balance Sheet): Total Debt/Equity % (mrq)">78.61%</span> debt to equity would also make the balance sheet look less comfortable, since the stock would then be leaning on a premium multiple without the growth to support it.
<a id="lf0-business"></a>
Company Profile
Darling Ingredients develops sustainable natural ingredients from edible and inedible bio-nutrients, turning animal by-products, used cooking oil, bakery residuals, and other residual streams into proteins, fats, collagen, casings, fertilizers, and fuel feedstocks. It operates through Feed Ingredients, Food Ingredients, and Fuel Ingredients, and in FY2025 it generated $6.1B of revenue and $62.8M of net income attributable to Darling.
The company traces its roots to 1882 and is incorporated in Delaware. It operates on five continents, including over 150 U.S. processing and transfer facilities, six Canadian facilities, and 81 international production facilities. Its Fuel Ingredients segment includes the Diamond Green Diesel joint venture, which runs renewable diesel plants in Norco, Louisiana and Port Arthur, Texas with about 1.2 billion gallons of annual capacity.
Economic Moat
Business Model
The collection and processing network is the part of Darling Ingredients that I view as hardest to replicate within three years. The company operates over 150 processing and transfer facilities in the United States, six facilities in Canada, and 81 production facilities across five continents, while also collecting used cooking oil from approximately 158,300 U.S. locations. That footprint gives Darling access to dispersed residual feedstocks that are costly to aggregate, and it supports a single-source offering across feed, food, fuel, and bioenergy end markets.
I also see a secondary moat in the formula-based raw material contracts, because approximately 91% of Darling’s U.S. volume of raw materials in fiscal 2025 was acquired on a formula basis. That structure helps stabilize margins when finished-product prices move, which is important in a business where input and output prices can swing quickly.
The business has become more diversified and more specialized over the last five years. The Valley Proteins acquisition, the FASA Group acquisition, and Gelnex expanded the footprint and added a larger collagen platform, while the current move to place collagen into a joint venture with Tessenderlo Group through NewCo Collagen LLC is a further structural step rather than a simple asset sale. In my view, that combination makes the moat broader, but it also raises the bar on execution because the model now depends on more moving parts.
Business & Operating Risks
The most material risk is the Diamond Green Diesel joint venture because Darling’s equity value now carries a $2.1B investment in a business that depends on policy support, feedstock access, and plant uptime all at once. According to the risk factors in their SEC 10-K, the venture is highly dependent on government programs, incentives, and regulatory frameworks, and the filing says the Clean Fuels Production Credit runs through 2027, with the One Big Beautiful Bill Act extending it through 2029 but cutting the maximum Sustainable Aviation Fuel credit to $1.00 per gallon beginning in 2026. That is not abstract policy risk: the current-year financial data already shows the fuel-linked earnings stream is sensitive to credit economics, so a lower SAF credit can flow straight into margin pressure if feedstock costs do not move in lockstep.
Raw-material procurement is the second risk that matters because Darling’s own filing says the most competitive aspect of the business is securing animal by-products, and in fiscal 2025 the top ten raw material suppliers accounted for approximately 27% of supply while the top ten customers accounted for approximately 40% of product sales. That concentration creates a direct earnings transmission mechanism: if a few suppliers switch to captive rendering, or if a few customers delay taking delivery when commodity prices move, volumes and gross margin can fall quickly. The filing’s note that some facilities depend on one or a few suppliers is especially relevant because a disruption at a single plant can hit both collection fees and finished-product output in the same quarter.
Commodity and energy volatility is the third risk that matters, and it is already embedded in the operating model rather than sitting in the background. The filing says finished products are tied to commodity markets and that Darling is highly dependent on natural gas, diesel fuel, and electricity, with the added warning that rapid changes in finished-goods prices can hit gross margin because of the lag between raw-material purchase and sale. That lag is the key mechanism, and it means a move in input costs can compress margin before pricing resets.
Taken together, these risks do threaten the DGD-driven earnings leg of the moat more than the collection network itself; the logistics footprint still looks hard to copy, but the policy-sensitive fuel earnings stream is clearly the part under pressure.
Management Discussion & Analysis
Management is actively responding to the policy and financing risks, but it is doing so by extending maturities and preserving flexibility rather than by de-risking the earnings mix. The June 25, 2025 Third Amended and Restated Credit Agreement refinanced the prior facility into $2.9B of senior secured credit facilities, and the June 24, 2025 issue of €750M of 4.5% Senior Notes due 2032 was used with revolver borrowings to redeem the prior notes and refinance the previous credit agreement. I read that as balance-sheet maintenance rather than deleveraging.
The board also approved a share repurchase program of up to $500M through August 13, 2026, and Darling had repurchased $34.7M in fiscal 2025 with $460.3M remaining as of January 3, 2026. That is a modest capital return signal, but it sits behind debt service and should not be mistaken for aggressive excess-cash deployment. Capital spending is still rising, with fiscal 2026 capex expected at approximately $450M versus $380.5M in fiscal 2025, which tells me management is still funding compliance, replacement, and expansion projects before shareholders see a larger cash return.
The operating narrative is more mixed than the financing story. Management points to Diamond Green Diesel integration as central to the business, and the filing is explicit that Darling’s share of DGD Adjusted EBITDA fell to $103.7M in fiscal 2025 from $289.9M in fiscal 2024, while combined Adjusted EBITDA slipped to $1.026B from $1.080B. That gap matters because it shows the renewable fuel leg is still highly policy-sensitive, so the company’s earnings base is not yet as stable as the core rendering network might suggest. The planned $450M of fiscal 2026 capex signals continued reinvestment, but the filing also says management expects operating cash flow, unrestricted cash, and revolver availability to cover needs through the next twelve months and beyond; I read that as adequate liquidity, not excess liquidity.
Management’s track record is mixed, which keeps the credibility score below the top tier. Prior filings framed DGD as a growing earnings engine, yet fiscal 2025 showed DGD Adjusted EBITDA falling sharply versus fiscal 2024, so the policy and turnaround headwinds were materially worse than the earlier tone implied. The current filing’s $57.96M of restructuring and asset impairment charges and the decision to classify assets as held for sale show that not every expansion has created durable value. Management Credibility Rating: BBB — the team has generally executed on financing and expansion, but the repeated reliance on DGD as a growth engine has not translated into stable earnings.
Recent Events
The most significant development I see is the February 25, 2026 board refresh: Gary W. Mize plans to retire at the 2026 Annual Meeting, while Robert Aspell joined the board immediately and was added to the Audit Committee. Aspell’s Cargill background in supply chain, expansion, and M&A strengthens oversight of a business where feedstock sourcing and capital allocation matter, so I read this as a modest positive for execution discipline rather than a strategic reset.
The February 11, 2026 full-year earnings release and the April 30, 2026 first-quarter release are routine disclosures, but they do confirm management is still using the earnings cadence to frame the story around operating performance and cash use. On their own, those filings do not change the structural thesis, because they add no new transaction, financing, or regulatory event.
The May 11, 2026 Investor Day filing is more important than the routine earnings releases because it signals management is actively trying to reframe the equity case with updated strategy and outlook materials. I view that as supportive of the thesis only if the presentation shows a clearer path to cash conversion and capital returns. Taken together, the recent 8-Ks leave the investment case materially unchanged, with the board change the only clear incremental positive.
Financial Analysis
LF0 has published standalone analyses of these peers: Ingredion (INGR) (rated Hold); Tyson Foods (TSN) (rated Hold); Archer-Daniels-Midland (ADM) (rated Hold); Bunge Global (BG) (rated Hold).
<a id="lf0-growth"></a>
Growth
DAR — Financial Growth (Quarterly, USD Mil)
| Metric | 2025-06-30 | 2025-09-30 | 2025-12-31 | 2026-03-31 | 2026-06-30 | 2026-09-30 |
|---|---|---|---|---|---|---|
| REVENUE (USD Mil) | 1,481.5 | 1,564 | 1,709.8 | 1,550.8 | 1,724.1 | — |
| EBIT (USD Mil) | 70.2 | 76.7 | 103.4 | 229.8 | 555.4 | — |
| EBITDA (USD Mil) | 191.3 | 200.8 | 242.9 | 360.7 | 685.6 | — |
| NET INCOME (USD Mil) | 12.7 | 19.4 | 56.9 | 134.3 | 387.3 | — |
| DILUTED EPS | — | 0.1 | 0.3 | 0.8 | 2.4 | 1.7 |
Source: Yahoo Finance — Quarterly Financial Statements
Revenue rose from $1.48e+03M in Q2 2025 to <span class="lf0-key" data-src="Yahoo Finance — Quarterly Income Statement: Total Revenue (2026-06-30)">$1.72e+03M</span> in Q2 2026, up 16.4% year over year, while EBITDA increased from $191M to <span class="lf0-key" data-src="Yahoo Finance — Quarterly Income Statement: EBITDA (2026-06-30)">$686M</span> over the same span. That is a much faster earnings ramp than revenue growth alone would suggest, which tells me the model is getting operating leverage rather than just adding volume.
Net income also moved sharply higher, from $12.7M in Q2 2025 to $387M in Q2 2026. The step-up is large enough that I would not treat it as a simple linear trend; it looks more like a mix and margin swing, which is why the growth case needs to be judged alongside profitability and leverage rather than in isolation.
Growth versus peers
| Company | Revenue TTM (USD Mil) | Revenue Growth YoY % | Diluted EPS TTM |
|---|---|---|---|
| <span class="lf0-primary">DAR</span> | 6,775.8 | 14.5% | 5.3 |
| INGR | 7,191 | -1.3% | 8.8 |
| TSN | 55,694 | -0.1% | 1.6 |
| ADM | 84,062 | 9.6% | 5.1 |
| LW | 6,623.3 | 0.7% | 1.8 |
| BG | 93,468 | 7.4% | 5.8 |
Source: Yahoo Finance
DAR’s revenue growth of 14.5% TTM is the fastest in the group, ahead of ADM at 9.6%, BG at 7.4%, LW at 0.7%, TSN at -0.1%, and INGR at -1.3%. That growth leadership is the main reason the market can justify a premium, but it also means the bar is higher for the next leg of earnings improvement.
<a id="lf0-profitability"></a>
Profitability
TTM operating margin is 9.64% and TTM net margin is 12.5%, which tells me Darling is already profitable on both an operating and bottom-line basis rather than still in an early loss-making phase. The gap between the two is modest, so non-operating items are not overwhelming the earnings picture, and investors should weight operating margin more heavily because it shows the core business is converting sales into profit before financing effects.
The current margin profile also fits the moat: the collection network and formula-based sourcing are doing real work, because a business that can hold a near-double-digit operating margin while processing residual feedstocks is not just a commodity blender. The key question is durability, not direction. If operating margin stays near 10% while net margin holds close behind it, that would confirm the current profitability is structural rather than a one-quarter spike.
Profitability versus peers
| Company | Operating Margin (TTM) | Net Margin (TTM) | Return on Assets (TTM) | Return on Equity (TTM) |
|---|---|---|---|---|
| <span class="lf0-primary">DAR</span> | 9.6% | 12.5% | — | — |
| INGR | 12.0% | 7.8% | 6.8% | 12.9% |
| TSN | 2.7% | 1.0% | 2.6% | 3.3% |
| ADM | 2.9% | 3.0% | 2.9% | 10.6% |
| LW | 10.1% | 3.8% | 5.8% | 14.2% |
| BG | 2.7% | 1.2% | 3.3% | 6.9% |
Source: Yahoo Finance
DAR’s 9.64% operating margin and 12.5% net margin compare with INGR’s 12.0% and 7.8%, TSN’s 2.7% and 1.0%, ADM’s 2.9% and 3.0%, LW’s 10.1% and 3.8%, and BG’s 2.7% and 1.2%. The margin profile is good enough to support a premium, but not so dominant that it overwhelms the leverage discussion.
What stands out is the mix: DAR’s net margin is stronger than every peer except INGR, even though its operating margin is not the highest. That tells me below-the-line items are helping the equity case, so I would want to see the operating margin stay near current levels before I would pay up for further multiple expansion.
<a id="lf0-valuation"></a>
Valuation
DAR trades at 1.82x EV/Revenue, 9.99x trailing P/E, <span class="lf0-key" data-src="Yahoo Finance — Key Statistics: Forward P/E">10.5x</span> forward P/E, 1.24x Price/Sales, and <span class="lf0-key" data-src="Yahoo Finance — Key Statistics: EV/EBITDA">6.75x</span> EV/EBITDA on a current share price of 53.4. That is not a distressed multiple set, but it is also not demanding for a business with positive earnings power and a 0.973 beta, so I read the stock as fairly valued rather than cheap.
The earnings base matters here because forward EPS is 6.46, which means the market is paying about 10.5x next-year earnings for a company with a real but still policy-sensitive fuel leg. With 12 analyst opinions, the consensus target range of 65 to 90 versus the current 53.4 share price leaves room for upside, but my own range sits closer to the lower half of that band because I weight the DGD volatility and leverage more heavily than the consensus appears to. On that basis, I would put fair value roughly in the $60 to $75 range, which is above the current price but still below the 81.8 mean target.
The implied earnings path is also important. At 6.46 of forward EPS, the stock is already discounting a steady profit base rather than a sharp reset, and that looks reasonable against peers with weaker growth or lower margins. I do not see enough evidence to call it a bargain, but I also do not see a valuation that requires a major de-rating unless the earnings mix weakens.
Valuation versus peers
| Company | Current Share Price (USD) | Trailing P/E | Forward P/E | EV/Revenue | EV/EBITDA | Price/Sales (TTM) | Price/Book (mrq) | Market Cap (USD Mil) | Enterprise Value (USD Mil) | Beta (5Y Monthly) | Forward EPS | Analyst Target Price – Low | Analyst Target Price – Mean | Analyst Target Price – High | # Analyst Opinions |
|---|---|---|---|---|---|---|---|---|---|---|---|---|---|---|---|
| <span class="lf0-primary">DAR</span> | 53.4 | 10 | 10.5 | 1.8 | 6.8 | 1.2 | 1.7 | 8,138 | 12,148 | 0.97 | 6.5 | 65 | 81.8 | 90 | 12 |
| INGR | 91.7 | 10.5 | 7.9 | 0.9 | 6.1 | 0.8 | 1.3 | 5,727 | 6,509 | 0.62 | 10.3 | 100 | 113.2 | 135 | 6 |
| TSN | 59.8 | 37 | 14.6 | 0.5 | 10.8 | 0.4 | 1.2 | 21,210 | 28,476 | 0.37 | 3.8 | 56 | 63 | 75 | 12 |
| ADM | 69.8 | 13.6 | 12.9 | 0.5 | 9 | 0.4 | 1.4 | 32,981 | 42,287 | 0.61 | 5.7 | 60 | 78.5 | 95 | 10 |
| LW | 56 | 31.2 | 17.9 | 1.8 | 12.7 | 1.2 | 4.4 | 7,869 | 11,659 | 0.47 | 3.5 | 52 | 55.7 | 65 | 13 |
| BG | 99.4 | 17.6 | — | 0.4 | 10.9 | 0.2 | 1.2 | 19,103 | 36,487 | 0.68 | 11 | 116 | 139.2 | 155 | 9 |
Source: Yahoo Finance
DAR trades at 1.82x EV/Revenue, 10.0x trailing P/E, <span class="lf0-key" data-src="Yahoo Finance — Key Statistics: Forward P/E">10.5x</span> forward P/E, and 1.2x Price/Sales, versus INGR at 0.9x, <span class="lf0-key" data-src="Yahoo Finance — Key Statistics: Trailing P/E">10.5x</span>, 7.9x, and 0.8x; TSN at 0.5x, 37.0x, 14.6x, and 0.4x; ADM at 0.5x, 13.6x, 12.9x, and 0.4x; LW at 1.8x, 31.2x, 17.9x, and 1.2x; and BG at 0.4x, 17.6x, and 0.2x. I think the market is paying for DAR’s growth and margin profile, but not for a much larger earnings base than the peers already show.
The peer spread also helps explain the stock’s relative positioning. DAR’s 49.3% one-year total return is the strongest in the group, which tells me the market has already rerated the name for the earnings inflection; that is why I would not call the stock cheap even though the multiple is still below the highest-growth industrial names.
<a id="lf0-leverage"></a>
Leverage
DAR’s leverage is moderate but not a cushionless balance sheet. Total Debt/Equity was <span class="lf0-key" data-src="Yahoo Finance — Key Statistics (Balance Sheet): Total Debt/Equity % (mrq)">78.61%</span>, and Total Debt was <span class="lf0-key" data-src="Yahoo Finance — Key Statistics (Balance Sheet): Total Debt (mrq)">$4171M</span>, so the debt load is the clearest hard anchor here. Cash generation is the bigger question: Operating Cash Flow TTM, Levered Free Cash Flow TTM, Net Debt/EBITDA TTM, and FCF Margin % TTM were not reported in the leverage data, which leaves less visibility on how quickly debt can be reduced from internal cash.
The supplementary data helps on liquidity and market perception. Total Cash was $163.7M mrq, or 1.038 per share, while Book Value Per Share was 33.24 mrq, so the equity base is still substantial relative to the share price. In my opinion, this is medium refinancing risk because the balance sheet is levered, but the cash balance and book value provide some room unless operating cash flow weakens further or refinancing terms tighten.
Leverage versus peers
| Company | Total Debt/Equity % (mrq) | Current Ratio (mrq) | Total Debt (mrq, USD Mil) | Free Cash Flow TTM (USD Mil) |
|---|---|---|---|---|
| <span class="lf0-primary">DAR</span> | 78.6 | — | 4,171.2 | — |
| INGR | 39 | 2 | 1,775 | 347.5 |
| TSN | 44 | 1.4 | 8,006 | 1,191.2 |
| ADM | 41.7 | 1.4 | 10,062 | -1,129.5 |
| LW | 219 | 1.5 | 3,956.7 | 331.8 |
| BG | 104.7 | 1.5 | 18,727 | -3,016.9 |
Source: Yahoo Finance
DAR’s debt/equity is 78.6%, above INGR’s 39.0%, TSN’s 44.0%, and ADM’s 41.7%, but below LW’s 219.0% and BG’s 104.7%. That puts DAR in the middle of the pack, yet the lack of a reported net debt/EBITDA or FCF margin means the balance-sheet read is less complete than for INGR, TSN, ADM, LW, and BG, where cash generation is visible and in INGR’s case FCF is $347.5M TTM.
That matters for valuation because the market is not just pricing growth; it is also pricing the ability to service and eventually reduce debt. In that sense, DAR’s growth premium is more defensible than its leverage premium, and the stock looks better on a growth-adjusted basis than on a balance-sheet-adjusted one.
<a id="lf0-insiders"></a>
Insider Activity
The insider transaction record I see here is one open-market sale and no open-market purchases across 81 filings from 2025-01-02 to 2026-05-07, so the sample is limited but directionally one-sided. The selling is concentrated in a single insider rather than broad-based across the leadership team, which makes it more of a mild negative than a strong alarm.
<a id="lf0-conclusion"></a>
Conclusion
I would put my rating as a Hold because the stock’s biggest tension is already visible in the numbers: growth and margins have improved, but the earnings engine is still tied to a policy-sensitive fuel business and the balance sheet carries <span class="lf0-key" data-src="Yahoo Finance — Key Statistics (Balance Sheet): Total Debt (mrq)">$4171M</span> of debt. Revenue rose 16.4% year over year in Q2 2026 to <span class="lf0-key" data-src="Yahoo Finance — Quarterly Income Statement: Total Revenue (2026-06-30)">$1.72e+03M</span>, and EBITDA climbed to <span class="lf0-key" data-src="Yahoo Finance — Quarterly Income Statement: EBITDA (2026-06-30)">$686M</span>, so the operating model is working; the question is whether that improvement can persist once the fuel credit backdrop and mix effects normalize.
I would raise my rating more towards a Buy if operating margin stays near <span class="lf0-key" data-src="Yahoo Finance — Key Statistics: Operating Margin (TTM)">10%</span> for two more quarters and revenue remains above <span class="lf0-key" data-src="Yahoo Finance — Quarterly Income Statement: Total Revenue (2026-06-30)">$1.72e+03M</span>, because that would show the current earnings step-up is becoming durable rather than cyclical. I would also want to see debt/equity move materially lower from <span class="lf0-key" data-src="Yahoo Finance — Key Statistics (Balance Sheet): Total Debt/Equity % (mrq)">78.61%</span>, since that would tell me the company is turning earnings into balance-sheet flexibility instead of simply funding a larger asset base.
I would move from Hold to Sell if quarterly revenue slips back toward $1.55e+03M and operating margin falls below 8%, because that would signal the recent inflection was not durable and would leave the stock leaning on a premium multiple without the growth to support it. A weaker top line combined with the current debt load would make the equity case much less forgiving.
For now, I think the base case is still the most likely outcome: Darling keeps growing, but not fast enough to force a rerating from here. The market has already given credit for the 49.3% 52-week gain, so I would need either a clearer margin step-up or a cheaper entry point before becoming more constructive.
What to Watch Next
- Quarterly revenue above <span class="lf0-key" data-src="Yahoo Finance — Quarterly Income Statement: Total Revenue (2026-06-30)">$1.72e+03M</span> — would support a more constructive rating.
- Operating margin near <span class="lf0-key" data-src="Yahoo Finance — Key Statistics: Operating Margin (TTM)">10%</span> for two more quarters — would confirm the earnings step-up is durable.
- Debt/equity moving materially below 78.6% — would improve balance-sheet flexibility.
- DGD EBITDA stabilizing after the 2025 drop — would reduce policy sensitivity in the earnings mix.
- Revenue slipping back toward $1.55e+03M and margin below 8% — would push the case toward Sell.
What’s your take? I rated Darling Ingredients (DAR) HOLD above — but the goal here is to get this right, not just to publish an opinion. What would you add to this analysis, or which risk or catalyst do you think I’m under- or over-weighting? Tell me in the comments.
Our track record: every directional call is tracked publicly on The Scorecard, and Stocks Covered lists every company we have rated and when.
Sources
- SEC 10-K Annual Report — filed 2026-03-03
- SEC 8-K Filing (2026-05-11)
- SEC 8-K Filing (2026-05-08)
- SEC 8-K Filing (2026-04-30)
- SEC 8-K Filing (2026-02-25)
- SEC 8-K Filing (2026-02-11)
- SEC 8-K Filing (2026-01-29)
- SEC Form 4 Insider Transaction (2026-05-08)
- SEC Form 4 Insider Transaction (2026-05-08)
- SEC Form 4 Insider Transaction (2026-05-08)
- SEC 10-K Annual Report — FY2026
- SEC 10-K Annual Report — FY2025
- SEC 10-K Annual Report — FY2024
- SEC 10-K Annual Report — FY2023
- SEC 10-K Annual Report — FY2022
Data sourced from Yahoo Finance and SEC EDGAR. Not investment advice.
Leave a Comment