| Company | Aug 25 | Sep 25 | Oct 25 | Nov 25 | Dec 25 | Jan 26 | Feb 26 | Mar 26 | Apr 26 | May 26 | Jun 26 | Jul 26 | 12-Mo |
|---|---|---|---|---|---|---|---|---|---|---|---|---|---|
| USAC | +1% | -0% | -6% | +14% | -9% | +15% | +6% | -1% | +3% | +0% | -4% | +1% | +19% |
| WES | -2% | +0% | -2% | +5% | +0% | +5% | +3% | -1% | +6% | +1% | +2% | +9% | +28% |
| PAGP | -2% | -5% | -3% | +7% | +3% | +9% | +10% | +8% | +1% | +1% | -0% | +10% | +45% |
| PAA | -1% | -5% | -1% | +6% | +3% | +9% | +9% | +7% | +3% | -1% | -1% | +12% | +46% |
| MPLX | -1% | -2% | +2% | +9% | -2% | +5% | +8% | -3% | -1% | -1% | +3% | +4% | +20% |
| AROC | +7% | +6% | -4% | -2% | +6% | +14% | +20% | -2% | +11% | -13% | +22% | -12% | +58% |
Source: Yahoo Finance monthly adjusted close.
Executive Summary
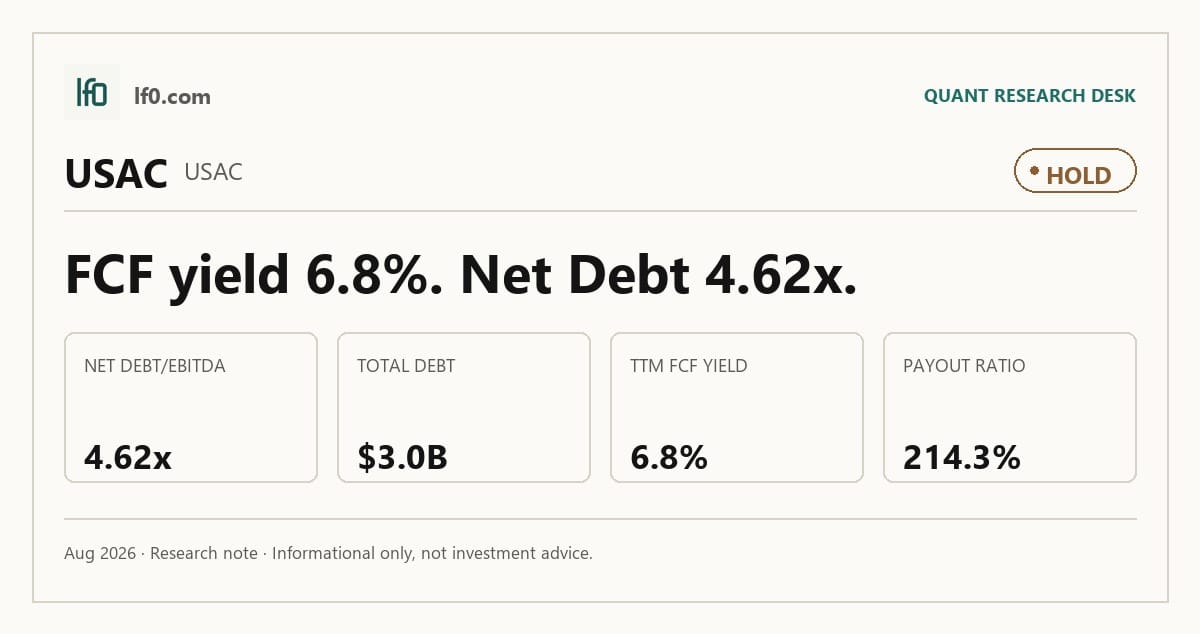
Rating: HOLD | USAC
Measured from adjusted close on 2026-08-05 to 2026-09-18. Sell ratings are correct when the stock falls; Hold is tracked as a +/-10% range. Daily-close data, not intraday. Calls are tracked for 182 days from publication, then frozen as a final record.
I would put my rating as a Hold because USA Compression Partners has a durable fixed-fee compression franchise, but the balance sheet is still heavy enough that the J W Power Acquisition has to prove it can add cash flow faster than it adds risk. The model’s appeal is straightforward: customers pay for compression capacity even when throughput is uneven, and that gives the partnership a steadier revenue base than a pure volume business. The issue is that leverage remains the constraint, not demand, so I would only move more constructive if net debt to EBITDA falls below 4.0x, meaning the business is moving away from a distribution stress point.
Company Profile
USA Compression Partners, LP is a Delaware limited partnership that provides fixed-fee natural gas compression services and related natural gas treating services to producers, gatherers, processors, and transporters. It has operated since 1998 and completed its initial public offering in January 2013. USA Compression GP, LLC, which is wholly owned by Energy Transfer, manages the partnership. As of December 31, 2025, the fleet totaled 3.9 million horsepower, and the January 12, 2026 J W Power Acquisition added manufacturing capacity and expanded the operating footprint into the Bakken, Northeast, Mid Con, Rockies, Gulf Coast, and Permian Basin. The company also owns two compression fabrication facilities and a natural gas treating fleet, and its common units trade on the NYSE under USAC.
Economic Moat
Business Model
The fixed-fee compression contract structure is the most defensible part of USA Compression Partners’ model. Customers pay a monthly fee even during periods of limited or disrupted throughput, and many term contracts also include annual inflation adjustments. I feel that this is hard to replicate quickly because a new entrant would need fleet scale, field reputation, maintenance capability, and customer trust to win multi-year service agreements in shale basins where uptime matters. The fleet design reinforces that edge: as of December 31, 2025, 87.6% of total fleet horsepower was in units of 400 horsepower or more, which lets the partnership serve multiple compression stages on a standardized platform. That operating structure is consistent with the 66.7% gross margin in the profitability table, which tells me the moat is showing up in economics, not just in the contract language.
Business & Operating Risks
The most immediate risk is distribution coverage. According to the risk factors in the 10-K, USA Compression Partners needs $76.1M per quarter, or $304.4M per year, to fund its current quarterly distribution of $0.525 per common unit, and that cash must come after reserves, fees, and reimbursements to the general partner. The filing also says cash available for distribution depends on production, service pricing, maintenance and expansion capital, debt service, and access to capital, so a softer gas market or a heavier capital program can squeeze the payout quickly. Commodity and activity exposure is the next major risk: a reduction in demand for, or production of, natural gas or crude oil could cut compression demand, and gas lift work is especially exposed when crude prices weaken. Customer concentration is also material, with the ten largest customers accounting for 46% of revenue in 2025. The disclosed risks do not break the moat, but they do cap how much pricing power the fixed-fee model can deliver if a few large customers slow spending.
Management Discussion & Analysis
Management is actively responding to those risks, but it is doing so with growth capital rather than balance-sheet repair. The J W Power Acquisition closed on January 12, 2026 for aggregate consideration of about $860M, paid with 18,175,323 common units and about $430M in cash, and it added manufacturing capacity that should support internal compression needs and third-party customers. At the same time, management raised 2026 capital spending plans, with total capital expected between $290M and $320M and expansion capital budgeted at $230M to $250M. That tells me the partnership is leaning into scale while it works through leverage, not pausing to de-risk first. The operating backdrop is constructive, with average revenue per revenue-generating horsepower per month up 4.7% in 2025 and average utilization at 94.3%, so the question is whether that improvement is enough to absorb the heavier capital plan.
Recent Events
The most important recent event is the Q1 2026 earnings release on May 5, 2026, which confirms the partnership is still executing its core compression franchise and keeping 2026 guidance intact. That matters because it shows the business is still tied to long-cycle natural gas infrastructure demand rather than short-term spot activity. I also note the April 28, 2026 board change, when Energy Transfer appointed Jim S. Holotik to the general partner board and granted 2,500 phantom units. In my view, that is a governance event rather than an operating one, but it reinforces parent control over capital allocation, which matters for a leveraged midstream name. The recent 8-Ks leave the moat thesis intact, but they also show that management is using the market window to defend and finance the platform rather than to simplify it.
Financial Analysis
Growth
USAC — Financial Growth (Quarterly, USD Mil)
| Metric | 2025-03-31 | 2025-06-30 | 2025-09-30 | 2025-12-31 | 2026-03-31 |
|---|---|---|---|---|---|
| REVENUE (USD Mil) | 245.2 | 250.1 | 250.3 | 252.5 | 331.3 |
| EBIT (USD Mil) | 69.4 | 76.6 | 84 | 73.6 | 91.4 |
| EBITDA (USD Mil) | 139.8 | 147.5 | 155.2 | 146 | 178.6 |
| NET INCOME (USD Mil) | 20.5 | 28.6 | 34.5 | 27.8 | 38.3 |
| DILUTED EPS | 0.1 | 0.2 | 0.3 | 0.2 | 0.3 |
Source: Yahoo Finance — Quarterly Financial Statements
Revenue was $331.3M in Q1 2026 versus $245.2M in Q1 2025, up 35.1% year over year, after a much flatter run in Q2 2025 through Q4 2025. EBITDA rose to $178.6M from $139.8M a year earlier, and net income increased to $38.3M from $20.5M. The Q1 step-up looks acquisition-driven, and the January 2026 J W Power Acquisition explains the jump in fleet scale. That is a bull signal, but I would want to see the higher revenue base hold once the acquisition anniversary lapses.
Profitability
USAC — Profitability (TTM)
| Metric | TTM |
|---|---|
| Operating Margin (TTM) | 28.6% |
| Net Margin (TTM) | 11.9% |
| Return on Assets (TTM) | 6.6% |
| Return on Equity (TTM) | 84.8% |
| Gross Margin (TTM) | 66.7% |
| EBITDA Margin (TTM) | 59.4% |
Source: Yahoo Finance — Trailing Twelve Months (TTM)
TTM gross margin was 66.7%, EBITDA margin was 59.4%, operating margin was 28.6%, and net margin was 11.9%. The spread from gross margin to operating margin is 38.1 percentage points, which shows overhead, depreciation, and financing costs still absorb a large share of earnings. That is not a broken business model; it is a capital-intensive one. TTM ROA was 6.6% and ROE was 84.8%, and the wide gap tells me returns are being amplified by leverage rather than by pure asset efficiency. The margin profile supports the moat, but it also shows why the equity remains sensitive to financing costs.
Valuation
USAC — Valuation Multiples
| Metric | Value |
|---|---|
| Market Cap (USD Mil) | 3,749 |
| Enterprise Value (USD Mil) | 6,705 |
| Trailing P/E | 26.9 |
| Forward P/E | 14.5 |
| Price/Sales (TTM) | 3.5 |
| Price/Book (mrq) | 11.8 |
| EV/Revenue | 6.2 |
| EV/EBITDA | 10.4 |
| Beta (5Y Monthly) | 0.19 |
| FCF Yield % (TTM) | 6.8% |
| Forward EPS (USD) | 1.8 |
| Analyst Target Price – Low (USD) | 28 |
| Analyst Target Price – Mean (USD) | 29.6 |
| Analyst Target Price – High (USD) | 33 |
| # Analyst Opinions | 5 |
Source: Yahoo Finance
USAC trades at 6.2x EV/revenue and 10.4x EV/EBITDA, with a 3.5x price/sales ratio and 26.9x trailing P/E. The forward P/E is 14.5x, which tells me the market is already pricing in a sharp earnings step-up to the $1.8 forward EPS base. On cash flow, the 6.8% FCF yield implies investors are paying about 14.7x levered free cash flow, so this is not a deep-value setup. Market cap is $3.7B and enterprise value is $6.7B, while total cash is only $14.5M, so the equity is being valued for durable cash generation rather than balance-sheet flexibility.
Analyst coverage is modest at five opinions, with targets of $28 to $33 and a $29.6 mean. My fair-value range is $26-$31, which sits slightly below the consensus mean because I weight leverage more heavily than the market appears to. On earnings, I would frame fair EPS in a $1.7-$1.9 range, which is close to the company’s own $1.8 forward EPS and broadly in line with the peer set on a like-for-like basis. That leaves the stock looking reasonably priced, but not cheap enough to ignore the debt load.
Leverage
USAC — Leverage & Coverage (Quarterly)
| Metric | Value |
|---|---|
| Total Debt/Equity % (mrq) | 945.5 |
| Current Ratio (mrq) | 1.5 |
| Total Debt (mrq, USD Mil) | 2,994 |
| Operating Cash Flow (TTM, USD Mil) | 425.7 |
| Levered Free Cash Flow (TTM, USD Mil) | 255.5 |
| Net Debt/EBITDA (TTM) | 4.6 |
| FCF Margin % (TTM) | 23.6% |
Source: Yahoo Finance — Quarterly Financial Statements
USA Compression Partners carries $3B of total debt against a 1.55 current ratio and 945.5% total debt to equity, so the balance sheet is levered and the equity cushion is thin. TTM operating cash flow was $425.7M and levered free cash flow was $255.6M, which shows the business is still converting EBITDA into cash. Net debt to EBITDA was 4.6x and FCF margin was 23.6%, so cash generation is solid but the debt load still leaves limited room for a downturn or a higher refinancing rate. The J W Power Acquisition added scale, but it also reinforces that capital allocation is debt-heavy.
Insider Activity
The insider transaction record I see here is net selling, with $1.1M of open-market sales versus $502,482 of open-market purchases over a limited sample from 2025-01-02 to 2026-04-28. The activity is concentrated rather than broad, because one 40,000-share sale by Porter Christopher W dominates the tape while Whitehurst Bradford D. is the only repeated open-market buyer. In my view, that is a bear signal because the selling outweighs the buying and insider alignment looks weaker than it would in a broad buying pattern.
Comparable Analysis
Growth
| Company | Revenue TTM (USD Mil) | Revenue Growth YoY % | Diluted EPS TTM |
|---|---|---|---|
| USAC | 1,084.1 | 35.1% | 1 |
| WES | 4,049.9 | 22.5% | 3 |
| PAGP | 45,255 | 8.7% | 0.8 |
| PAA | 45,255 | 8.7% | 1.1 |
| MPLX | 11,735 | -2.8% | 4.7 |
| AROC | 1,516.4 | 7.7% | 1.8 |
Source: Yahoo Finance
USAC’s revenue grew 35.1% TTM and diluted EPS reached $1.0, ahead of WES at 22.5% revenue growth and $3.0 EPS, and above PAGP and PAA at 8.7% growth with $0.8 and $1.1 EPS, respectively. AROC is the closest growth peer at 7.7% revenue growth and $1.8 EPS, so USAC’s growth premium is real and looks justified if the current run rate holds.
Valuation
| Company | Trailing P/E | Forward P/E | EV/Revenue | EV/EBITDA | Price/Sales (TTM) | Price/Book (mrq) | Beta (5Y Monthly) | FCF Yield % (TTM) | Forward EPS | Analyst Target Price – Low | Analyst Target Price – Mean | Analyst Target Price – High | # Analyst Opinions |
|---|---|---|---|---|---|---|---|---|---|---|---|---|---|
| USAC | 26.9 | 14.5 | 6.2 | 10.4 | 3.5 | 11.8 | 0.19 | 6.8% | 1.8 | 28 | 29.6 | 33 | 5 |
| WES | 15.4 | 12.5 | 6.6 | 11.2 | 4.8 | 5.5 | 0.66 | 4.6% | 3.7 | 38 | 46 | 55 | 12 |
| PAGP | 32.6 | 11.5 | 0.6 | 12.4 | 0.1 | 3.9 | 0.45 | 19.4% | 2.2 | 20 | 24.6 | 29 | 14 |
| PAA | 20.9 | 12 | 0.7 | 14.1 | 0.4 | 2.2 | 0.49 | 6.8% | 1.9 | 20 | 24.5 | 27 | 17 |
| MPLX | 12.9 | 12.4 | 7.2 | 14.1 | 5.2 | 4.3 | 0.46 | 3.2% | 4.9 | 54 | 60.9 | 73 | 13 |
| AROC | 18.8 | 14.4 | 5.7 | 10.2 | 4 | 4 | 0.88 | 2.5% | 2.4 | 40 | 42.9 | 46 | 8 |
Source: Yahoo Finance
USAC’s 6.8% FCF yield is better than WES at 4.6%, AROC at 2.5%, and MPLX at 3.2%, but below PAGP at 19.4% and PAA at 6.8%. On EV/revenue, USAC at 6.2x sits below WES at 6.6x and MPLX at 7.2x, while its forward P/E of 14.5x is above WES at 12.5x, PAGP at 11.5x, PAA at 12.0x, MPLX at 12.4x, and AROC at 14.4x. That mix tells me the market is paying for faster growth and a 1.8 forward EPS base, but not giving USAC a full premium for it. The valuation is therefore more balanced than cheap, especially once leverage is folded in.
Profitability
| Company | Operating Margin (TTM) | Net Margin (TTM) | Return on Assets (TTM) | Return on Equity (TTM) | Gross Margin (TTM) | EBITDA Margin (TTM) |
|---|---|---|---|---|---|---|
| USAC | 28.6% | 11.9% | 6.6% | 84.8% | 66.7% | 59.4% |
| WES | 41.1% | 29.5% | 7.3% | 36.7% | 69.8% | 58.6% |
| PAGP | 2.8% | 0.4% | 2.8% | 9.1% | 5.9% | 5.2% |
| PAA | 2.8% | 2.5% | 3.0% | 10.4% | 5.9% | 5.2% |
| MPLX | 36.1% | 40.0% | 7.0% | 33.4% | 56.1% | 51.1% |
| AROC | 35.4% | 21.4% | 8.7% | 22.7% | 66.3% | 56.0% |
Source: Yahoo Finance
USAC’s 28.6% operating margin and 59.4% EBITDA margin are below WES at 41.1% and 58.6%, and below MPLX at 36.1% and 51.1%, but they are far above PAGP’s 2.8% and 5.2%. The gross margin gap is the cleaner signal: USAC at 66.7% trails WES at 69.8% but is far above MPLX at 56.1% and PAGP/PAA at 5.9%, which points to a better cost-of-revenue profile than the pipeline peers.
Leverage
| Company | Total Debt/Equity % (mrq) | Current Ratio (mrq) | Operating Cash Flow TTM (USD Mil) | Free Cash Flow TTM (USD Mil) | Net Debt/EBITDA (TTM) | FCF Margin % (TTM) |
|---|---|---|---|---|---|---|
| USAC | 945.5 | 1.5 | 425.7 | 255.6 | 4.6 | 23.6% |
| WES | 248.3 | 1.1 | 2,161.7 | 887.2 | 3.4 | 21.9% |
| PAGP | 83 | 0.9 | 2,711 | 1,136.4 | 4.8 | 2.5% |
| PAA | 90.3 | 0.9 | 2,715 | 1,107.5 | 4.8 | 2.5% |
| MPLX | 182.8 | 1.1 | 6,010 | 1,930.1 | 4.1 | 16.4% |
| AROC | 157.4 | 1.4 | 692.3 | 148.5 | 2.8 | 9.8% |
Source: Yahoo Finance
USAC’s 945.5% debt/equity and 4.6x net debt/EBITDA are heavier than WES at 248.3% and 3.4x, AROC at 157.4% and 2.8x, and MPLX at 182.8% and 4.1x. USAC’s 23.6% FCF margin is stronger than WES at 21.9%, AROC at 9.8%, and MPLX at 16.4%, so the leverage is not a sign of weak cash generation but a financing choice that still leaves less balance-sheet flexibility than the cleaner peers.
Conclusion
I would put my rating as a Hold because the core compression franchise is working, but the leverage profile is still too heavy for me to call the stock cheap. The business is generating real cash, with $255.6M of levered free cash flow and a 6.8% FCF yield, yet the 4.6x net debt to EBITDA load means that cash has to do more than support the distribution — it also has to absorb acquisition integration and refinancing risk. That is why the valuation looks fair rather than compelling.
I would raise my rating more toward a Buy if distributable cash flow coverage moved back above 1.3x, meaning the distribution is covered with room to spare, and if net debt to EBITDA fell below 4.0x, which would show the J W Power Acquisition is being digested without stretching the balance sheet further. If average revenue per revenue-generating horsepower keeps rising at the 4.7% pace seen in 2025 and utilization stays near 94.3%, that would add enough cash to make the current payout look more durable and would improve the deleveraging path.
I would move from Hold to Sell if leverage stayed above 4.5x net debt to EBITDA while distribution coverage slipped below 1.1x, because that would tell me the payout is being funded with too little cushion and the balance sheet is not healing. A second bear trigger would be a meaningful loss of business from the ten largest customers, which already accounted for 46.0% of revenue in 2025. If the 19.0% month-to-month revenue base starts rolling off, I would expect the market to reprice the units before the next refinancing window.
Weighing both paths, I lean cautious because the bull case depends on execution staying clean while the balance sheet remains heavy, and the bear case only needs one or two large customers to slow spending or one refinancing to come in wider. The stock can work from here, but I think the market is already giving credit for the acquisition and the LNG demand backdrop, so I would need to see coverage and leverage improve before moving off Hold.
What’s your take? I rated USA Compression Partners (USAC) HOLD above — but the goal here is to get this right, not just to publish an opinion. What would you add to this analysis, or which risk or catalyst do you think I’m under- or over-weighting? Tell me in the comments.
Sources
- SEC 10-K Annual Report — filed 2026-02-17
- SEC 8-K Filing (2026-05-27)
- SEC 8-K Filing (2026-05-15)
- SEC 8-K Filing (2026-05-05)
- SEC 8-K Filing (2026-04-30)
- SEC 8-K Filing (2026-03-27)
- SEC 8-K Filing (2026-03-10)
- SEC Form 4 Insider Transaction (2026-04-30)
- SEC Form 4 Insider Transaction (2026-02-20)
- SEC Form 4 Insider Transaction (2026-02-19)
- SEC 10-K Annual Report — FY2026
- SEC 10-K Annual Report — FY2025
- SEC 10-K Annual Report — FY2024
- SEC 10-K Annual Report — FY2023
- SEC 10-K Annual Report — FY2022
Data sourced from Yahoo Finance and SEC EDGAR. Not investment advice.
Leave a Comment