
Expected price range
Each range is set from the stock’s recent price history and our Hold rating, using its own 1-year realised volatility (50% annualised) as the width of a ~68% statistical band, and checked against that rating so the range leans the same way as our view. Starting price $13.10 (close 2026-10-27). The stock traded between $7.27 and $13.38 over the last 6 months and between $4.81 and $13.38 over the last year. This is an illustration of where our view and normal volatility point, not a forecast, price target or investment advice; the stock can move outside it.
| Company | Oct 25 | Nov 25 | Dec 25 | Jan 26 | Feb 26 | Mar 26 | Apr 26 | May 26 | Jun 26 | Jul 26 | Aug 26 | Sep 26 | 12-Mo |
|---|---|---|---|---|---|---|---|---|---|---|---|---|---|
| LFST | -11% | +33% | +8% | +0% | +2% | -12% | +19% | +2% | +39% | -2% | +18% | -3% | +119% |
| AVAH | +2% | +3% | -13% | +3% | -12% | -13% | +2% | +10% | +20% | +10% | +43% | -8% | +40% |
| ADUS | -1% | +3% | -11% | -4% | +0% | -10% | +3% | -5% | +10% | +15% | -1% | -4% | -6% |
| EVH | -21% | -37% | -5% | -20% | +1% | -30% | +64% | +5% | +37% | -43% | +46% | -22% | -59% |
| ALHC | -3% | +14% | +3% | +14% | -15% | -8% | +28% | -32% | +55% | -38% | -10% | -39% | -53% |
| AMN | +2% | -15% | -5% | +35% | -9% | -6% | +12% | +42% | +12% | +4% | +2% | +5% | +85% |
Source: Yahoo Finance monthly adjusted close.
Quick Thesis
- Rated Hold — growth is strong, but margins are still too thin for the current valuation.
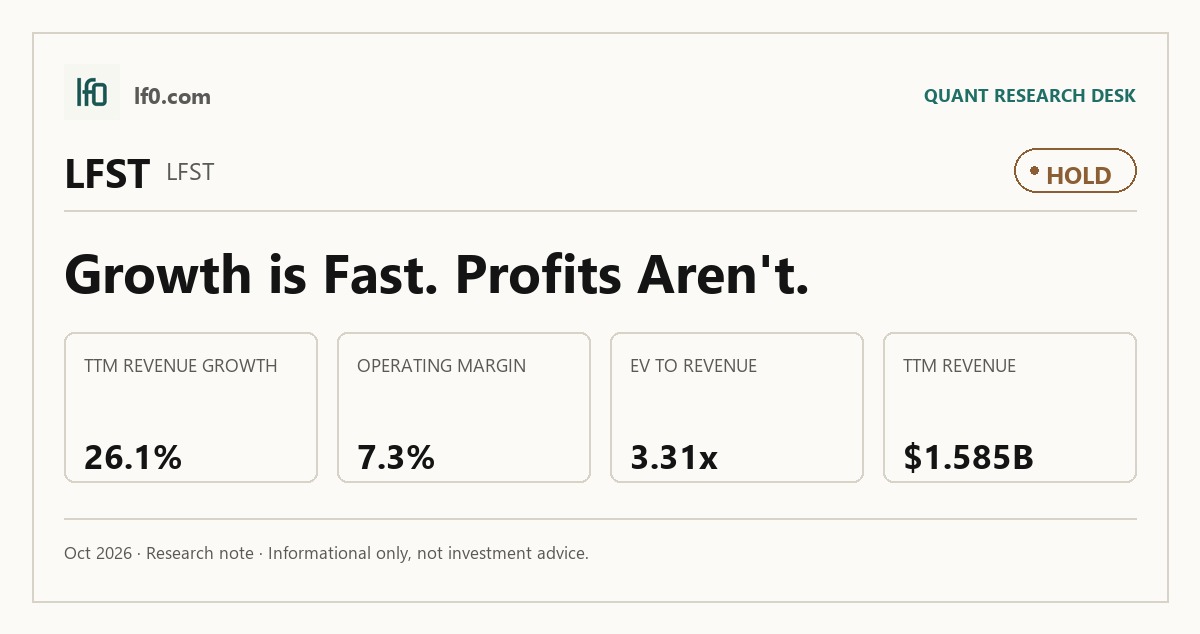
- Revenue reached $435.4M in Q2 2026, up 26.1% year over year.
- The main risk is payor concentration: UnitedHealthcare and Elevance Health together were 29.0% of 2025 revenue.
- LFST trades at 3.3x EV/revenue and 30.4x forward P/E, above most peers.
- I would turn more constructive if operating margin moved into the low teens and held there.
Executive Summary
Rating: HOLD | LFST
Measured from adjusted close on 2026-10-27 to 2026-10-27. Sell ratings are correct when the stock falls; Hold is tracked as a +/-10% range. Daily-close data, not intraday. Calls are tracked for 182 days from publication, then frozen as a final record.
I would put my rating as a Hold because LifeStance is scaling quickly, but the stock already prices in a margin profile the business has not yet delivered. Revenue grew 26.1% year over year to $435.4M in Q2 2026, yet operating margin is still only 7.3% TTM and net margin is 3.2%, so the market is paying for earnings power that remains ahead of the reported run rate.
The key question is whether that gap closes through operating leverage rather than just more visits. I would raise my rating more towards a Buy if operating margin moves into the low teens and stays there for two consecutive quarters, because that would show the clinician base and center network are finally absorbing overhead instead of simply adding volume.
Company Profile
LifeStance Health Group provides outpatient mental healthcare through a hybrid model that combines virtual and in-person visits. It operates through subsidiaries and supported practices, and it earns most of its revenue from fee-for-service reimbursement under in-network commercial payor contracts.
The company had 8,040 licensed clinicians across 33 states and 572 centers as of December 31, 2025, including 392 supported practices. In 2025, more than 1.0 million unique patients completed about 9.0 million visits, and 90% of revenue came from commercial in-network payors, which makes payer access and clinician density central to the model.
Economic Moat
Business Model
I feel the in-network, tech-enabled outpatient platform is the hardest part of LifeStance to replicate within 3 years. A new entrant would need to recruit clinicians, secure payer contracts, and build scheduling, referral, and billing infrastructure at the same time, while LifeStance already has 8,040 licensed clinicians in 33 states and a footprint of 572 centers that supports both virtual and in-person care.
The moat is not just scale; it is also referral flow. More than 13 integrated care programs connect the company with primary care and specialist physicians, which makes patient acquisition harder to displace than a standalone telehealth app. That structural advantage is visible in the financials too: 26.1% revenue growth in Q2 2026 is consistent with a network that is still gaining density rather than simply harvesting existing demand.
Business & Operating Risks
The most material disclosed risk is payor concentration and reimbursement pressure. UnitedHealthcare represented 14.0% of 2025 revenue and Elevance Health represented 15.0%, so two counterparties accounted for 29.0% of revenue, and the company also discloses that reimbursement can be narrowed, repriced, or terminated while clinician compensation does not fall in lockstep.
The 2024 Credit Agreement adds a second pressure point because it carried 282.8M of principal outstanding at December 31, 2025 and includes a leverage covenant. The filing also highlights corporate-practice-of-medicine and fee-splitting risk, telehealth reimbursement risk, and the possibility that the DEA’s temporary prescribing flexibility could tighten again, all of which matter because the model depends on supported practices, virtual access, and payer reimbursement working together. In my view, these risks do not break the moat, but they do test the part of the moat that depends on payer access and regulatory permission rather than clinician scale alone.
Management Discussion & Analysis
Management is responding to those risks by leaning into volume, footprint, and operating discipline rather than retreating from growth. Revenue rose to $435.4M in FY2025 from $1.2510B in FY2024, and management tied that increase to a net gain of 8,040 clinicians and 1.1 million more patient visits, which tells me the core engine is still hiring and utilization, not acquisition-led.
The company is also investing in IT, billing, and patient engagement infrastructure, which should help absorb reimbursement complexity if execution stays on track. That said, management has not yet shown me that scale is translating into cleaner pricing power; total revenue per visit fell because of a single payor rate decrease, so the operating plan is still volume-led rather than margin-led. The response is directionally right, but the margin recovery this thesis needs has not fully shown up yet.
Recent Events
The two secondary offerings in 2026 are the most important recent events because they added share supply without adding operating capital. LifeStance completed one on February 25, 2026 and another on May 7, 2026, and in both cases the company received no proceeds while selling stockholders sold 25.0 million shares and 35.0 million shares, respectively.
That does not change the operating moat, but it does matter for per-share upside because it increases supply while leaving the balance sheet unchanged. The March 10, 2026 promotion of Lisa Miller to Chief Operating Officer and Principal Operating Officer is the cleaner positive signal: she had already been running practice operations since February 2024, so the move looks like continuity in a business where execution discipline matters. The June 2, 2026 annual meeting was routine governance, not a strategic catalyst.
Financial Analysis
Growth
LFST — Financial Growth (Quarterly, USD Mil)
| Metric | 2025-03-31 | 2025-06-30 | 2025-09-30 | 2025-12-31 | 2026-03-31 | 2026-06-30 |
|---|---|---|---|---|---|---|
| REVENUE (USD Mil) | — | 345.3 | 363.8 | 382.2 | 403.5 | 435.4 |
| EBIT (USD Mil) | — | -3 | 7.4 | 18.1 | 21.6 | 30.1 |
| EBITDA (USD Mil) | — | 11 | 20.9 | 31.5 | 34.9 | 44.3 |
| NET INCOME (USD Mil) | — | -3.8 | 1.1 | 11.7 | 14.2 | 23.6 |
| DILUTED EPS | 0 | 0 | 0 | — | 0 | 0.1 |
Source: Yahoo Finance — Quarterly Financial Statements
Revenue rose from $345M in Q2 2025 to $435.4M in Q2 2026, a 26.1% increase, and EBITDA moved from $11M to $44.3M over the same period. Net income improved from a $3.8M loss to $23.6M, which tells me the business is finally converting top-line growth into bottom-line progress, even if the per-share effect is still modest.
The trend is encouraging because it is broad-based rather than a one-quarter spike. Revenue stepped up through the intervening quarters as well, and that pattern is consistent with a platform that is still adding clinicians and visits rather than relying on a single pricing event.
Profitability
LFST — Profitability (TTM)
| Metric | TTM |
|---|---|
| Operating Margin (TTM) | 7.2% |
| Net Margin (TTM) | 3.2% |
| Return on Assets (TTM) | 2.3% |
| Return on Equity (TTM) | 3.4% |
| Gross Margin (TTM) | 33.6% |
| EBITDA Margin (TTM) | 8.5% |
Source: Yahoo Finance — Trailing Twelve Months (TTM)
TTM operating margin was 7.3%, net margin was 3.2%, gross margin was 33.6%, EBITDA margin was 8.5%, ROA was 2.3%, and ROE was 3.4%. The spread from gross margin to operating margin is 26.3 points, which tells me the business still carries a heavy overhead load relative to revenue.
That is why I do not treat the current profitability profile as proof of durable scale. The company keeps about a third of revenue after direct costs, but clinical and corporate expenses still absorb most of the remainder, so the next leg of the thesis depends on operating leverage rather than gross margin expansion. I would want to see operating margin move into the low teens and net margin close the gap to EBITDA margin before I would call the earnings base genuinely strong.
Valuation
LFST — Valuation Multiples
| Metric | Value |
|---|---|
| Current Share Price (USD) | 13.1 |
| Market Cap (USD Mil) | 4,980 |
| Enterprise Value (USD Mil) | 5,238 |
| Trailing P/E | 100.8 |
| Forward P/E | 30.4 |
| Price/Sales (TTM) | 3.1 |
| Price/Book (mrq) | 3.4 |
| EV/Revenue | 3.3 |
| EV/EBITDA | 38.8 |
| Beta (5Y Monthly) | 1.24 |
| FCF Yield % (TTM) | 3.5% |
| Forward EPS (USD) | 0.4 |
| Analyst Target Price – Low (USD) | 12 |
| Analyst Target Price – Mean (USD) | 14.4 |
| Analyst Target Price – High (USD) | 18 |
| # Analyst Opinions | 10 |
Source: Yahoo Finance
LifeStance trades at 3.3x EV/revenue, 3.1x price/sales, 38.8x EV/EBITDA, and 30.4x forward P/E, while the current share price is $13.1 and the market cap is $5B. Those multiples are not cheap for a business with 7.3% operating margin and 8.5% EBITDA margin, so the stock is already discounting a cleaner earnings path than the current numbers show.
On the analysis here, I would put fair value in a range of roughly $0.4-$6.2 per share using peer EV/revenue as a rough anchor, then adjusting for LifeStance’s debt and cash position. That range sits well below the current price and below the $14.4 analyst mean target, which tells me my view is more conservative than consensus because I weight the current margin structure more heavily than the market appears to. With 10 analyst opinions, there is a real consensus to compare against, and the stock is trading below the high end of that range but above the low end, so the market is not ignoring the business — it is simply paying for a much better margin outcome.
I would also frame earnings power this way: the company’s forward EPS is 0.431, while peers such as AVAH at $0.9 and AMN at $0.9 have stronger near-term earnings per share, and ADUS at $7.5 is in a different earnings tier altogether. On a like-for-like basis, LFST’s earnings trajectory is still richer than its current profitability would suggest, which is why the multiple looks demanding rather than merely full.
Leverage
LFST — Leverage & Coverage (Quarterly)
| Metric | Value |
|---|---|
| Total Debt/Equity % (mrq) | 32.1 |
| Current Ratio (mrq) | 1.4 |
| Total Debt (mrq, USD Mil) | 474.1 |
| Operating Cash Flow (TTM, USD Mil) | 217.9 |
| Levered Free Cash Flow (TTM, USD Mil) | 172.4 |
| Net Debt/EBITDA (TTM) | 1.8 |
| FCF Margin % (TTM) | 10.9% |
Source: Yahoo Finance — Quarterly Financial Statements
LifeStance carries $474.1M of total debt against $225.9M of cash, so the balance sheet is workable but not loose. Net debt/EBITDA is 1.8x, current ratio is 1.4x, and total debt/equity is 32.1%, which means the company has enough liquidity to operate but not enough cushion to absorb a prolonged earnings setback without pressure.
Cash flow is the more reassuring part of the picture. TTM operating cash flow was $217.9M, levered free cash flow was $172.4M, and FCF margin was 10.9%, so the business is converting a meaningful share of earnings into cash. That said, the leverage profile does not create a valuation floor on its own; if growth slows while reimbursement pressure persists, the debt load would matter more quickly than the current ratio alone suggests.
Insider Activity
The insider transaction record is one-sided: there were 22 open-market sales and 0 open-market purchases over 2025-03-06 to 2026-05-12. The activity is concentrated rather than broad-based, with the largest block on 2026-05-12 dominated by BLACK DARREN M. and TPG GP A, LLC.
I read that as a negative signal because insiders are not showing willingness to buy at these levels. It does not prove the thesis is broken, but it does tell me management and owners are not using the open market to signal confidence.
Comparable Analysis
LF0 has published standalone analyses of these peers: Aveanna Healthcare (AVAH) (rated Hold); Addus HomeCare (ADUS) (rated Hold); Evolent Health (EVH) (rated Strong Sell); Alignment Healthcare (ALHC) (rated Hold).
Growth
| Company | Revenue TTM (USD Mil) | Revenue Growth YoY % | Diluted EPS TTM |
|---|---|---|---|
| LFST | 1,584.8 | 26.1% | 0.1 |
| AVAH | 2,602.8 | 13.7% | 1.3 |
| ADUS | 1,476.4 | 8.0% | 5.7 |
| EVH | 2,097 | 46.9% | -4.5 |
| ALHC | 4,577.3 | 31.6% | 0.2 |
| AMN | 3,434.3 | 2.3% | 2.7 |
Source: Yahoo Finance
LFST’s 26.1% revenue growth is ahead of AVAH at 13.7%, ADUS at 8.0%, and AMN at 2.3%, while EVH at 46.9% and ALHC at 31.6% are faster but much less stable in earnings quality. That puts LFST in the middle of the peer set on growth, which supports a premium to the slower growers but not a premium that assumes best-in-class acceleration.
Valuation
| Company | Current Share Price (USD) | Trailing P/E | Forward P/E | EV/Revenue | EV/EBITDA | Price/Sales (TTM) | Price/Book (mrq) | Market Cap (USD Mil) | Enterprise Value (USD Mil) | Beta (5Y Monthly) | FCF Yield % (TTM) | Forward EPS | Analyst Target Price – Low | Analyst Target Price – Mean | Analyst Target Price – High | # Analyst Opinions |
|---|---|---|---|---|---|---|---|---|---|---|---|---|---|---|---|---|
| LFST | 13.1 | 100.8 | 30.4 | 3.3 | 38.8 | 3.1 | 3.4 | 4,980 | 5,238 | 1.24 | 3.5% | 0.4 | 12 | 14.4 | 18 | 10 |
| AVAH | 12.7 | 10.1 | 14 | 1.6 | 13.7 | 1.1 | 9.6 | 2,772 | 4,272 | 1.95 | 3.7% | 0.9 | 13 | 15.1 | 16 | 10 |
| ADUS | 121.2 | 21.2 | 16.1 | 1.5 | 13.9 | 1.5 | 1.9 | 2,263 | 2,226 | 0.83 | 5.1% | 7.5 | 96 | 134.1 | 155 | 13 |
| EVH | 4.4 | — | 10.9 | 0.7 | 22.4 | 0.2 | 1.3 | 500 | 1,367 | 1.02 | 25.4% | 0.4 | 3 | 5.8 | 8 | 12 |
| ALHC | 8.1 | 42.4 | 12.4 | 0.3 | 14.5 | 0.4 | 6.3 | 1,670 | 1,265 | 1.14 | 11.3% | 0.7 | 9 | 12.3 | 26 | 13 |
| AMN | 46.8 | 17.5 | 49.9 | 0.7 | 7.5 | 0.5 | 2.4 | 1,813 | 2,312 | 0.40 | 24.6% | 0.9 | 28 | 36.6 | 43 | 7 |
Source: Yahoo Finance
LFST trades at 3.3x EV/revenue and 30.4x forward P/E, above AVAH at 1.6x and 14.0x, ADUS at 1.5x and 16.1x, EVH at 0.7x and 10.9x, ALHC at 0.3x and 12.4x, and AMN at 0.7x and 49.9x. On a peer EV/revenue range of 0.3x to 1.6x, LFST’s implied equity value comes out well below the current share price once debt and cash are considered, which is why I think the stock is already pricing in a much cleaner margin path than the peer set supports.
The valuation premium is easier to justify if growth and profitability move together, but they are not there yet. LFST’s 3.5% FCF yield is below ADUS at 5.1% and far below AMN at 24.6% and EVH at 25.4%, so the market is paying up without getting the best cash return.
Profitability
| Company | Operating Margin (TTM) | Net Margin (TTM) | Return on Assets (TTM) | Return on Equity (TTM) | Gross Margin (TTM) | EBITDA Margin (TTM) |
|---|---|---|---|---|---|---|
| LFST | 7.2% | 3.2% | 2.3% | 3.4% | 33.6% | 8.5% |
| AVAH | 12.6% | 10.6% | 9.7% | 198.6% | 32.0% | 12.0% |
| ADUS | 9.7% | 7.1% | 6.3% | 9.7% | 32.0% | 10.9% |
| EVH | -1.3% | -24.1% | -0.8% | -67.0% | 17.2% | 2.9% |
| ALHC | 3.2% | 0.9% | 3.1% | 20.0% | 12.6% | 1.9% |
| AMN | 4.0% | 3.1% | 4.4% | 15.6% | 27.8% | 8.9% |
Source: Yahoo Finance
LFST’s gross margin of 33.6% is slightly above AVAH and ADUS at 32.0%, and well above AMN at 27.8%, so the issue is not direct cost of service. The gap shows up below gross profit: operating margin is 7.3%, below AVAH at 12.6% and ADUS at 9.7%, while EBITDA margin at 8.5% also trails those peers.
That tells me the problem is overhead absorption, not the core service economics. Net margin of 3.2% is better than EVH’s -24.1% and slightly ahead of AMN at 3.1%, but it still leaves LFST behind the stronger operators on capital efficiency.
Leverage
| Company | Total Debt/Equity % (mrq) | Current Ratio (mrq) | Total Debt (mrq, USD Mil) | Operating Cash Flow TTM (USD Mil) | Free Cash Flow TTM (USD Mil) | Net Debt/EBITDA (TTM) | FCF Margin % (TTM) |
|---|---|---|---|---|---|---|---|
| LFST | 32.1 | 1.4 | 474.1 | 217.9 | 172.4 | 1.8 | 10.9% |
| AVAH | 522.7 | 1.2 | 1,505.3 | 168.2 | 103.8 | 4.5 | 4.0% |
| ADUS | 9.5 | 1.7 | 108.8 | 162.4 | 116.2 | 0.1 | 7.9% |
| EVH | 253.2 | 1.2 | 970.4 | 54.3 | 126.8 | 14 | 6.0% |
| ALHC | 124.7 | 1.7 | 330.5 | 205.6 | 188.6 | -4.2 | 4.1% |
| AMN | 104.7 | 1.1 | 775.8 | 470.8 | 445.8 | 1.3 | 13.0% |
Source: Yahoo Finance
LFST’s debt/equity of 32.1% and net debt/EBITDA of 1.8x are manageable, but they are not as clean as ADUS at 9.5% and 0.1x. They are also far better than AVAH at 522.7% and 4.5x, or EVH at 253.2% and 14.0x, so LFST sits in the middle of the group rather than at either extreme.
The more useful comparison is cash generation. LFST’s 10.9% FCF margin is better than AVAH at 4.0%, ALHC at 4.1%, and EVH at 6.0%, but below AMN at 13.0% and ADUS at 7.9%; that means the company can fund itself, yet its leverage does not give it a valuation edge over the cleaner balance sheets in the group.
Conclusion
I would put my rating as a Hold because the core tension is still unresolved: LifeStance is growing quickly, but the market is already paying for a margin profile that has not yet arrived. Revenue growth of 26.1% is strong, and the business is clearly scaling, but 7.3% operating margin and 3.2% net margin tell me the earnings base is still too thin to support a more aggressive call.
I would raise my rating more towards a Buy if operating margin moves into the low teens and holds there for two consecutive quarters, because that would show the clinician network and center footprint are finally producing operating leverage rather than just more revenue. On the current revenue base, that kind of margin move would add meaningful annual operating profit and make the 30.4x forward P/E much easier to defend.
The bear case is that reimbursement pressure and share supply keep the stock ahead of fundamentals. Two payors accounted for 29.0% of 2025 revenue, so a modest pricing reset would hit earnings quickly, and the 22 open-market sales with no purchases over 2025-03-06 to 2026-05-12 tell me insiders have not been stepping in at these levels. If FCF margin slips back below 8.0%, meaning cash conversion is no longer keeping pace with growth, the valuation would look much harder to support.
I think the bear case is more likely to show up first because the stock already trades at 3.3x EV/revenue and 30.4x forward P/E while the margin expansion still needs proof. Until the company shows that higher visit volume is turning into sustained operating leverage, I would stay at Hold.
What to Watch Next
- Operating margin into the low teens — would support moving the rating toward Buy.
- FCF margin staying above 8.0% — would show cash conversion is keeping pace with growth.
- UnitedHealthcare and Elevance concentration — any further increase would raise reimbursement risk.
- Net debt/EBITDA staying near 1.8x — would keep refinancing pressure manageable.
- Another quarter of 20%+ revenue growth — would confirm the clinician network is still scaling.
What’s your take? I rated LifeStance Health (LFST) HOLD above — but the goal here is to get this right, not just to publish an opinion. What would you add to this analysis, or which risk or catalyst do you think I’m under- or over-weighting? Tell me in the comments.
Our track record: every directional call is tracked publicly on The Scorecard, and Stocks Covered lists every company we have rated and when.
Sources
- SEC 10-K Annual Report — filed 2026-02-25
- SEC 8-K Filing (2026-06-04)
- SEC 8-K Filing (2026-05-12)
- SEC 8-K Filing (2026-05-07)
- SEC 8-K Filing (2026-03-11)
- SEC 8-K Filing (2026-03-02)
- SEC 8-K Filing (2026-02-25)
- SEC Form 4 Insider Transaction (2026-05-14)
- SEC Form 4 Insider Transaction (2026-05-14)
- SEC Form 4 Insider Transaction (2026-05-14)
- SEC 10-K Annual Report — FY2026
- SEC 10-K Annual Report — FY2025
- SEC 10-K Annual Report — FY2024
- SEC 10-K Annual Report — FY2023
- SEC 10-K Annual Report — FY2022
Data sourced from Yahoo Finance and SEC EDGAR. Not investment advice.
Leave a Comment