
Expected price range
Each range is set from the stock’s recent price history and our Hold rating, using its own 1-year realised volatility (71% annualised) as the width of a ~68% statistical band, and checked against that rating so the range leans the same way as our view. Starting price $8.05 (close 2026-10-27). The stock traded between $7.55 and $24.56 over the last 6 months and between $7.55 and $24.56 over the last year. This is an illustration of where our view and normal volatility point, not a forecast, price target or investment advice; the stock can move outside it.
| Company | Oct 25 | Nov 25 | Dec 25 | Jan 26 | Feb 26 | Mar 26 | Apr 26 | May 26 | Jun 26 | Jul 26 | Aug 26 | Sep 26 | 12-Mo |
|---|---|---|---|---|---|---|---|---|---|---|---|---|---|
| ALHC | -3% | +14% | +3% | +14% | -15% | -8% | +28% | -32% | +55% | -38% | -10% | -39% | -53% |
| AVAH | +2% | +3% | -13% | +3% | -12% | -13% | +2% | +10% | +20% | +10% | +43% | -8% | +40% |
| ADUS | -1% | +3% | -11% | -4% | +0% | -10% | +3% | -5% | +10% | +15% | -1% | -4% | -6% |
| EVH | -21% | -37% | -5% | -20% | +1% | -30% | +64% | +5% | +37% | -43% | +46% | -22% | -59% |
| LFST | -11% | +33% | +8% | +0% | +2% | -12% | +19% | +2% | +39% | -2% | +18% | -3% | +119% |
| AMN | +2% | -15% | -5% | +35% | -9% | -6% | +12% | +42% | +12% | +4% | +2% | +5% | +85% |
Source: Yahoo Finance monthly adjusted close.
Quick Thesis
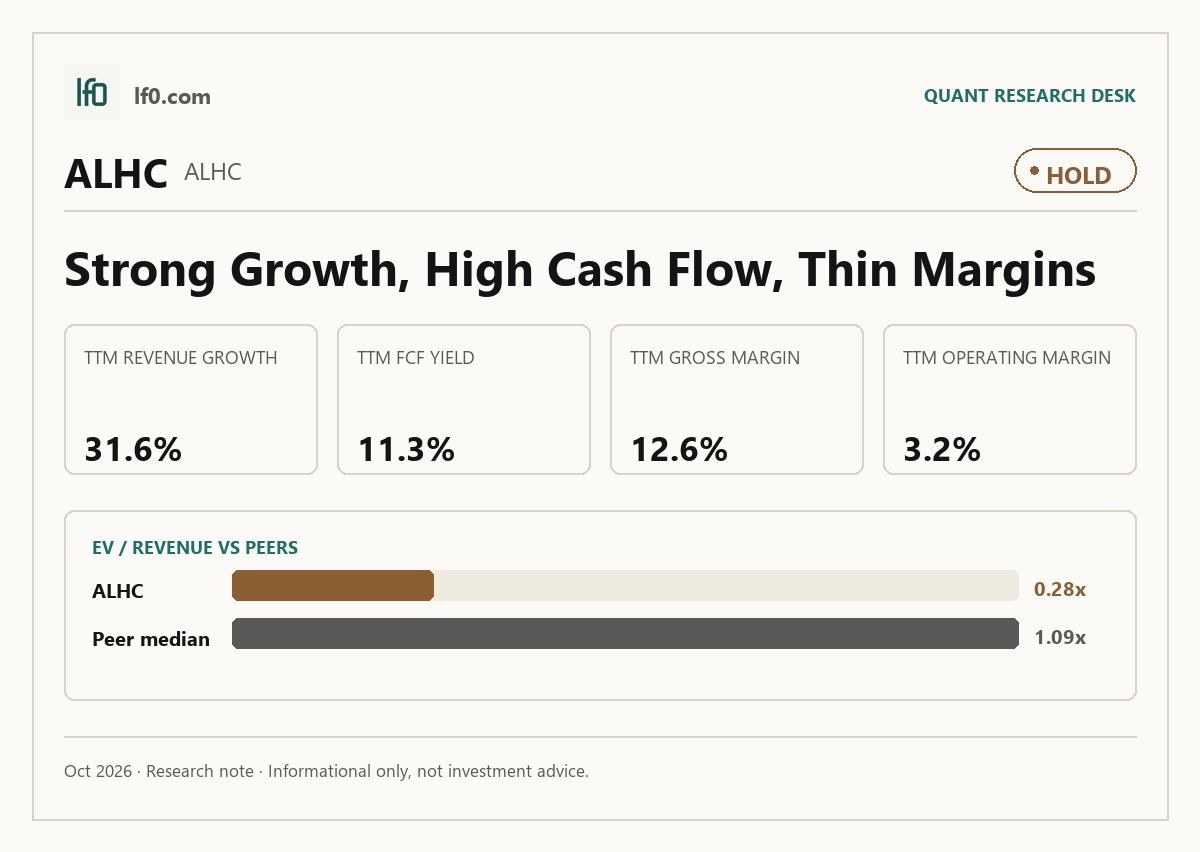
- Rated hold — fast growth, but margins are still too thin for a higher conviction call.
- Strongest strength: 31.6% TTM revenue growth, with Q2 2026 revenue at $1.3B.
- Biggest risk: Medicare Advantage and RADV exposure against only 0.9% TTM net margin.
- Valuation is mixed: 0.3x EV/revenue and 14.5x EV/EBITDA, but 42.4x trailing P/E.
- I would turn more constructive if 2026 adjusted EBITDA reaches about $145M and margins keep improving.
Executive Summary
Rating: HOLD | ALHC
Measured from adjusted close on 2026-10-27 to 2026-10-27. Sell ratings are correct when the stock falls; Hold is tracked as a +/-10% range. Daily-close data, not intraday. Calls are tracked for 182 days from publication, then frozen as a final record.
I would put my rating as a Hold because Alignment Healthcare is still growing fast enough to matter, but the margin structure is not yet strong enough to justify a more aggressive call. Revenue rose 31.6% TTM, and free cash flow yield was 11.3% TTM, yet gross margin was only 12.6% TTM and operating margin was 3.2% TTM, so the business is converting scale into cash before it is converting it into durable earnings power. I would raise my rating more towards a Buy if the company can hold membership growth near the 290,000 to 296,000 year-end 2026 target while pushing operating margin toward the high single digits, because that would show the larger member base is finally producing real operating leverage.
Company Profile
Alignment Healthcare, Inc. is a Medicare Advantage insurer and care-management platform for seniors. It earns revenue through capitated per member per month payments from the Centers for Medicare & Medicaid Services under annual contracts, and it also receives separate Part D prescription drug payments. Founded in 2013 as Alignment Healthcare Holdings, LLC, it completed its initial public offering restructuring in March 2021 and now trades on Nasdaq under ALHC. Health Plan Membership grew from about 13,000 at inception to 236,300 at December 31, 2025, across 45 markets in California, North Carolina, Nevada, Arizona and Texas, serving about 8.4 million Medicare-eligible seniors. The company is a holding company with operations run through subsidiaries and affiliated medical groups, and it had 1,849 full-time employees at December 31, 2025.
Economic Moat
Business Model
AVA, Alignment Healthcare’s proprietary technology platform, ingests longitudinal data from more than 200 sources and turns it into real-time care workflows. I feel that this is the hardest element for a well-funded competitor to copy within 3 years because it is tied to accumulated member data, embedded clinical workflows, and the company’s in-house Care Anywhere teams rather than to a single product feature. The model is reinforced by direct Medicare Advantage contracts with CMS, a 24/7 concierge service, and employed clinical staff that let Alignment manage care rather than simply process claims. According to their SEC filings, the company had 1,849 full-time employees as of December 31, 2025, including more than 450 full-time clinical employees, which shows the business is built around active care delivery instead of a light administrative platform. I also see a secondary moat in the annual CMS Star Ratings framework, because higher ratings support richer benefits and better enrollment economics, but that advantage still depends on execution rather than on structural scarcity.
Business & Operating Risks
The biggest disclosed risk is the company’s dependence on Medicare Advantage funding and CMS contract terms, because substantially all of 2025 revenue came from Medicare Advantage and the 10-K says the business had approximately 275,300 individual Medicare Advantage members as of January 1, 2026. That exposure is not abstract: CMS can change premium payments, member benefits, eligibility criteria, and risk-adjustment rules, and the filing also flags the 2018 Risk-Adjustment Data Validation audits, with findings expected in mid-calendar year 2026 and possible overpayment recovery. The financial data already shows why this matters for investors: the company is still operating with a net loss of $1M in FY2025 and an accumulated deficit of $1,009M as of December 31, 2025, so even a modest adverse payment adjustment would hit a thin earnings base rather than a mature profit pool.
The second risk is the combination of risk-adjustment coding exposure and the possibility of retroactive penalties. The company relies on providers and its AVA platform to document diagnosis data, and the filing warns that inaccurate or unsupportable risk-adjustment scores could cause revenue misstatements and penalties under the False Claims Act, where per-claim penalties were adjusted to $14,308 to $28,619 after July 3, 2025. That risk is already showing up in the financial profile because the business depends on precise member coding to support revenue, yet it is still loss-making and highly sensitive to any revenue reversal or refund. The filing’s own language makes the mechanism clear: CMS can audit, recoup, and even extrapolate findings, which means a coding problem can become a balance-sheet and cash-flow problem, not just a compliance issue.
A third company-specific risk is geographic concentration. Approximately 84% of members were in California as of December 31, 2025, and the business is concentrated in California, North Carolina, Nevada, Arizona and Texas, so a state-level reimbursement change, regulatory shift, or localized health shock would not be diversified away. That concentration is consistent with the operating data in this article, which shows a business still scaling from a narrow base rather than a nationally diversified platform. The filing also highlights that state insurance subsidiaries must maintain statutory capital and can only upstream limited dividends, which makes the concentration more relevant because cash trapped in regulated entities cannot freely offset a shock elsewhere. In my view, these risks do threaten the moat, but they attack the economics around AVA and the care model more than the technology platform itself; the real test is whether CMS and RADV pressure can erode the managed-care advantage that the integrated operating model is supposed to create.
Management Discussion & Analysis
Management is responding to the disclosed risks by leaning harder into scale, quality ratings, and balance-sheet simplification, but the CMS and RADV overhang is still unresolved. The clearest capital-allocation signal is the $330M of Convertible Senior Notes due November 15, 2029, issued at 4.25% and used to repay the Oxford term loans in full, which pushes refinancing risk out to 2029 and cuts interest expense to $15.8M in 2025 from $23.5M in 2024. That is balance-sheet reshaping rather than deleveraging, yet it does reduce near-term funding pressure while the company keeps investing.
Management is also still funding growth aggressively: selling, general and administrative expenses rose to $443.4M in 2025 from $371.4M in 2024, and the filing says those costs include sales and marketing, network development, and new market expansion activities. I read that as a deliberate choice to buy membership growth before margin expansion, and the numbers support it because health plan membership increased to 236,300 at December 31, 2025 from 189,100 at December 31, 2024 while revenue rose to $3.9B in 2025 from $2.7B in 2024. The gap is that management still expects to continue investing heavily and may need additional capital, although cash, cash equivalents and short-term investments were $604.2M at December 31, 2025 and the company says that is enough for at least the next 12 months.
The 2025 filing’s core claim was that the virtuous cycle would translate into growth and better unit economics, and the 2025 results broadly confirmed that: membership rose 25.0%, revenue rose 46.1%, and income from operations improved to $14.8M from a loss of $101.6M in 2024. Prior filings also emphasized that scale would improve selling, general and administrative expense leverage, and that proved directionally correct because SG&A fell to 11.2% of revenue in 2025 from 13.7% in 2024 even as absolute spending increased. The tone has been consistently optimistic across the last two filings, but the numbers now back it up better than they did in 2024, when management was still talking about a virtuous cycle while the company posted a $128.1M net loss.
Recent Events
The most significant development is the January 12, 2026 update on 2026 membership outlook: Alignment now expects about 275,300 Health Plan Members at January 1, 2026, up 31% year over year, and 290,000 to 296,000 by December 31, 2026. That strengthens the moat thesis because it shows the company is still scaling membership faster than the market may have assumed, which supports the operating leverage case in the core Medicare Advantage franchise.
What tempers that signal is the same filing’s 2026 profitability expectation of about $145M of adjusted EBITDA, which is only a forecast and not yet backed by reported results. In my view, that keeps the growth case intact but still tests execution, because the company has to convert the larger member base into margin expansion rather than just top-line growth.
The other material event is the March 2, 2026 secondary offering by a selling stockholder of 13.2 million shares, which closed on March 4, 2026 and did not provide proceeds to the company. I read that as a mild overhang on the equity because it adds supply without strengthening the balance sheet, while the May 6, 2026 bylaw amendment creating a Vice Chair role and the May 12, 2026 leadership-structure update suggest governance reorganization rather than a strategic reset. Overall, recent 8-Ks leave the investment case modestly stronger on operating scale, but not cleaner on capital structure.
Financial Analysis
Growth
ALHC — Financial Growth (Quarterly, USD Mil)
| Metric | 2025-06-30 | 2025-09-30 | 2025-12-31 | 2026-03-31 | 2026-06-30 |
|---|---|---|---|---|---|
| REVENUE (USD Mil) | 1,015.3 | 993.7 | 1,012.8 | 1,235.2 | 1,335.6 |
| EBIT (USD Mil) | 22.8 | 7.7 | -10.3 | 15.5 | 42.1 |
| EBITDA (USD Mil) | 29.9 | 15.7 | -2.5 | 23.4 | 50 |
| NET INCOME (USD Mil) | 15.7 | 3.7 | -11 | 11.4 | 36.6 |
| DILUTED EPS | 0.1 | 0 | -0.1 | 0.1 | 0.2 |
Source: Yahoo Finance — Quarterly Financial Statements
ALHC’s revenue has been choppy but upward over the last five quarters: $993.7M in Q3 2025, $1B in Q4 2025, $1.2B in Q1 2026, and $1.3B in Q2 2026. That implies a 33.0% YoY jump in Q1 2026 versus $1B in Q1 2025, then 34.4% YoY in Q2 2026 versus $993.7M in Q2 2025, so the top line is still compounding at a fast pace. EBITDA grew faster than revenue in Q2 2026, rising to $50M from $15.7M in Q3 2025 and $23.4M in Q1 2026, which suggests operating leverage is improving. The Q4 2025 EBITDA dip to negative $2.5M looks like a swing rather than a trend, and the broader pattern is consistent with the membership buildout described above.
Profitability
ALHC — Profitability (TTM)
| Metric | TTM |
|---|---|
| Operating Margin (TTM) | 3.2% |
| Net Margin (TTM) | 0.9% |
| Return on Assets (TTM) | 3.1% |
| Return on Equity (TTM) | 20.0% |
| Gross Margin (TTM) | 12.6% |
| EBITDA Margin (TTM) | 1.9% |
Source: Yahoo Finance — Trailing Twelve Months (TTM)
TTM operating margin of 3.2%, net margin of 0.9%, gross margin of 12.6%, EBITDA margin of 1.9%, ROA of 3.1%, and ROE of 20% show a business that is still early in its profit buildout. The 12.6% gross margin versus 3.2% operating margin leaves a 9.4-point gap, which means most of the gross profit is being absorbed by overhead and growth investment rather than by weak unit economics at the service level. EBITDA margin of 1.9% is already positive, so the core operations are close to breakeven before depreciation and amortisation, but the 0.9% net margin shows that financing and non-cash charges still leave very little bottom-line profit.
The 20.0% ROE versus 3.1% ROA gap suggests returns are being amplified by leverage rather than by deep operating profitability, so investors should watch whether ROA improves as the business scales. That matters because the moat is operational, not financial: if AVA and the care model are working, margin expansion should eventually show up in both operating margin and ROA, not just in revenue growth. The key next signal is a sustained move in operating and net margin toward positive territory, because that would show the company is converting growth into durable earnings instead of just covering fixed costs.
Valuation
ALHC — Valuation Multiples
| Metric | Value |
|---|---|
| Current Share Price (USD) | 8.1 |
| Market Cap (USD Mil) | 1,670 |
| Enterprise Value (USD Mil) | 1,265 |
| Trailing P/E | 42.4 |
| Forward P/E | 12.4 |
| Price/Sales (TTM) | 0.4 |
| Price/Book (mrq) | 6.3 |
| EV/Revenue | 0.3 |
| EV/EBITDA | 14.5 |
| Beta (5Y Monthly) | 1.14 |
| FCF Yield % (TTM) | 11.3% |
| Forward EPS (USD) | 0.7 |
| Analyst Target Price – Low (USD) | 9 |
| Analyst Target Price – Mean (USD) | 12.3 |
| Analyst Target Price – High (USD) | 26 |
| # Analyst Opinions | 13 |
Source: Yahoo Finance
Alignment Healthcare trades at 0.3x enterprise value to revenue and 0.4x price to sales on TTM results, which is the primary anchor here because earnings are still too thin to support a clean earnings multiple. At a current share price of $8.1, the market is paying less than one third of annual revenue for the business, so the stock is priced as if membership growth and margin improvement will remain hard to convert into durable profit. The trailing P/E is 42.4x, but the forward P/E drops to 12.4x on forward EPS of $0.7, which tells me the market is already discounting a sharp earnings step-up rather than a steady run rate. FCF yield is 11.3% TTM, which is a meaningful cash-generation signal and helps explain why the equity is not priced as a distressed name. Price to book is 6.3x, so investors are also paying well above stated equity value for a business whose book value per share is only $1.3. Beta is 1.1, so the stock should still move more than the market.
On my read, fair value sits in a range of about $9 to $13 a share. That range is above the current price but still below the $12.3 analyst mean and well below the $26 high, which tells me the consensus is more optimistic than I am about how quickly margins can catch up. I would not call the stock cheap on a peer basis just because EV/revenue is low; with 31.6% TTM revenue growth and only 3.2% operating margin, the market is still paying for a growth path that has not yet fully converted into earnings. The valuation picture is therefore a neutral to slightly bullish signal because the revenue multiple is low, but the earnings and book multiples already assume a meaningful improvement.
Leverage
ALHC — Leverage & Coverage (Quarterly)
| Metric | Value |
|---|---|
| Total Debt/Equity % (mrq) | 124.7 |
| Current Ratio (mrq) | 1.7 |
| Total Debt (mrq, USD Mil) | 330.5 |
| Operating Cash Flow (TTM, USD Mil) | 205.5 |
| Levered Free Cash Flow (TTM, USD Mil) | 188.6 |
| Net Debt/EBITDA (TTM) | -4.2 |
| FCF Margin % (TTM) | 4.1% |
Source: Yahoo Finance — Quarterly Financial Statements
Alignment Healthcare’s leverage is manageable, but it is not a cushion I would call comfortable. Total Debt/Equity was 124.7%, Current Ratio was 1.7, and Total Debt was $330.5M, so the balance sheet is levered but not stretched to the point of immediate distress. Cash generation is the stronger part of the picture: Operating Cash Flow was $205.5M, Levered Free Cash Flow was $188.6M, and FCF Margin was 4.1%, which means earnings are converting into real cash rather than disappearing into capex or interest. Net Debt/EBITDA was -4.2x, a sign that cash exceeds debt on a net basis and gives the company room to absorb a downturn.
That cash position matters because it links the growth and valuation cases: the company can fund expansion without leaning on the market immediately, but the leverage profile also means growth has to keep translating into cash if the current multiple is going to hold. In my opinion, refinancing risk is low near term because liquidity is adequate and net cash is positive, but it would become a concern if cash generation weakened for several quarters or if a refinancing date arrived after a sustained margin squeeze.
Insider Activity
The insider transaction record I see here is overwhelmingly net selling, with only 1 open-market purchase versus 113 open-market sales across the 2024-03-13 to 2026-06-02 window. The selling is broad and concentrated at the top, led by the CEO and President, so this is not just one isolated holder trimming a position. In my view, that pattern points to weak insider alignment with shareholders, and it is a bear signal.
Comparable Analysis
LF0 has published standalone analyses of these peers: Aveanna Healthcare (AVAH) (rated Hold); Addus HomeCare (ADUS) (rated Hold); Evolent Health (EVH) (rated Strong Sell).
Growth
| Company | Revenue TTM (USD Mil) | Revenue Growth YoY % | Diluted EPS TTM |
|---|---|---|---|
| ALHC | 4,577.3 | 31.6% | 0.2 |
| AVAH | 2,602.8 | 13.7% | 1.3 |
| ADUS | 1,476.4 | 8.0% | 5.7 |
| EVH | 2,097 | 46.9% | -4.5 |
| LFST | 1,584.8 | 26.1% | 0.1 |
| AMN | 3,434.3 | 2.3% | 2.7 |
Source: Yahoo Finance
ALHC’s 31.6% revenue growth in TTM is strong, but it is not the fastest in the peer set. EVH grew revenue 46.9%, LFST grew 26.1%, AVAH grew 13.7%, ADUS grew 8.0%, and AMN grew 2.3%, so ALHC sits in the upper half rather than at the top. That matters because the market is not paying a clear growth premium for ALHC relative to the faster growers, which makes the stock’s rerating harder to justify on growth alone.
Valuation
| Company | Current Share Price (USD) | Trailing P/E | Forward P/E | EV/Revenue | EV/EBITDA | Price/Sales (TTM) | Price/Book (mrq) | Market Cap (USD Mil) | Enterprise Value (USD Mil) | Beta (5Y Monthly) | FCF Yield % (TTM) | Forward EPS | Analyst Target Price – Low | Analyst Target Price – Mean | Analyst Target Price – High | # Analyst Opinions |
|---|---|---|---|---|---|---|---|---|---|---|---|---|---|---|---|---|
| ALHC | 8.1 | 42.4 | 12.4 | 0.3 | 14.5 | 0.4 | 6.3 | 1,670 | 1,265 | 1.14 | 11.3% | 0.7 | 9 | 12.3 | 26 | 13 |
| AVAH | 12.7 | 10.1 | 14 | 1.6 | 13.7 | 1.1 | 9.6 | 2,772 | 4,272 | 1.95 | 3.7% | 0.9 | 13 | 15.1 | 16 | 10 |
| ADUS | 121.2 | 21.2 | 16.1 | 1.5 | 13.9 | 1.5 | 1.9 | 2,263 | 2,226 | 0.83 | 5.1% | 7.5 | 96 | 134.1 | 155 | 13 |
| EVH | 4.4 | — | 10.9 | 0.7 | 22.4 | 0.2 | 1.3 | 500 | 1,367 | 1.02 | 25.4% | 0.4 | 3 | 5.8 | 8 | 12 |
| LFST | 13.1 | 100.8 | 30.4 | 3.3 | 38.8 | 3.1 | 3.4 | 4,980 | 5,238 | 1.24 | 3.5% | 0.4 | 12 | 14.4 | 18 | 10 |
| AMN | 46.8 | 17.5 | 49.9 | 0.7 | 7.5 | 0.5 | 2.4 | 1,813 | 2,312 | 0.40 | 24.6% | 0.9 | 28 | 36.6 | 43 | 7 |
Source: Yahoo Finance
ALHC trades at 0.3x EV/revenue and 0.4x price/sales, versus AVAH at 1.6x and 1.1x, ADUS at 1.5x and 1.5x, EVH at 0.7x and 0.2x, LFST at 3.3x and 3.1x, and AMN at 0.7x and 0.5x. On a peer-multiple basis, ALHC looks inexpensive on revenue, but that discount is partly explained by its weaker margin structure and the fact that the market is still waiting for those margins to catch up. The cleaner read is FCF yield: ALHC at 11.3% is ahead of AVAH at 3.7%, ADUS at 5.1%, LFST at 3.5%, and close enough to AMN at 24.6% to show that ALHC is not being priced like a cash burner. I would not use the peer set to argue for a much higher price without first seeing margin improvement, because the valuation gap is tied to profitability as much as to growth.
Profitability
| Company | Operating Margin (TTM) | Net Margin (TTM) | Return on Assets (TTM) | Return on Equity (TTM) | Gross Margin (TTM) | EBITDA Margin (TTM) |
|---|---|---|---|---|---|---|
| ALHC | 3.2% | 0.9% | 3.1% | 20.0% | 12.6% | 1.9% |
| AVAH | 12.6% | 10.6% | 9.7% | 198.6% | 32.0% | 12.0% |
| ADUS | 9.7% | 7.1% | 6.3% | 9.7% | 32.0% | 10.9% |
| EVH | -1.3% | -24.1% | -0.8% | -67.0% | 17.2% | 2.9% |
| LFST | 7.2% | 3.2% | 2.3% | 3.4% | 33.6% | 8.5% |
| AMN | 4.0% | 3.1% | 4.4% | 15.6% | 27.8% | 8.9% |
Source: Yahoo Finance
ALHC’s 12.6% gross margin, 3.2% operating margin, 0.9% net margin, and 1.9% EBITDA margin trail AVAH at 32.0%, 12.6%, 10.6%, and 12.0%, ADUS at 32.0%, 9.7%, 7.1%, and 10.9%, LFST at 33.6%, 7.2%, 3.2%, and 8.5%, and AMN at 27.8%, 4.0%, 3.1%, and 8.9%. The gap is mostly gross margin, not just overhead, which points to a cost-of-revenue issue rather than a pure scale problem. That is why ALHC’s growth deserves a discount until margins catch up.
Leverage
| Company | Total Debt/Equity % (mrq) | Current Ratio (mrq) | Total Debt (mrq, USD Mil) | Operating Cash Flow TTM (USD Mil) | Free Cash Flow TTM (USD Mil) | Net Debt/EBITDA (TTM) | FCF Margin % (TTM) |
|---|---|---|---|---|---|---|---|
| ALHC | 124.7 | 1.7 | 330.5 | 205.6 | 188.6 | -4.2 | 4.1% |
| AVAH | 522.7 | 1.2 | 1,505.3 | 168.2 | 103.8 | 4.5 | 4.0% |
| ADUS | 9.5 | 1.7 | 108.8 | 162.4 | 116.2 | 0.1 | 7.9% |
| EVH | 253.2 | 1.2 | 970.4 | 54.3 | 126.8 | 14 | 6.0% |
| LFST | 32.1 | 1.4 | 474.1 | 217.9 | 172.4 | 1.8 | 10.9% |
| AMN | 104.7 | 1.1 | 775.8 | 470.8 | 445.8 | 1.3 | 13.0% |
Source: Yahoo Finance
Total debt/equity of 124.7% is higher than ADUS at 9.5% and LFST at 32.1%, but ALHC’s net debt/EBITDA is -4.2x because it holds $701.7M of cash against $330.5M of debt, while AVAH sits at 4.5x and EVH at 14.0x. That cash position also supports a 4.1% FCF margin and $188.6M of TTM free cash flow, or about $0.9 per share, so the balance sheet is a real buffer rather than a cosmetic metric. Relative to peers, ALHC’s leverage is one of the clearest reasons the stock can trade at a lower revenue multiple without looking distressed.
Conclusion
I would put my rating as a Hold because Alignment Healthcare has already proven it can grow membership, but it has not yet proven to me that it can turn that growth into durable margin expansion without leaning on heavy overhead. The key tension is that the business is cash-generative enough to avoid a balance-sheet problem today, yet the 0.3x EV/revenue multiple is only attractive if the margin profile keeps improving from here.
I would raise my rating more towards a Buy if the company can hold membership growth near the 290,000 to 296,000 year-end 2026 target while pushing operating margin toward the high single digits, because that would show the larger member base is finally producing real operating leverage. If adjusted EBITDA reaches about $145M in 2026 and free cash flow stays positive near the current $188.6M TTM pace, the market would have to treat the current multiple as too low for a business with this growth rate and cash conversion.
I would move from Hold to Sell if the 2026 CMS risk-adjustment review or RADV findings force a meaningful revenue clawback, because this is still a thinly profitable insurer with $1M of FY2025 net loss and $1,009M of accumulated deficit. A modest adverse adjustment would hit a small earnings base, and if operating margin slipped back toward breakeven while insider selling continued, the current valuation would start to look like a growth premium without the earnings to justify it.
Weighing both sides, I think the bear case arrives first unless the next two quarters show cleaner margin expansion, because the company has already proven it can grow membership but has not yet proven it can do so without heavy overhead. The balance sheet and cash flow keep the downside contained, but I am not ready to pay for a rerating until the margin profile catches up with the top line.
What to Watch Next
- Membership near 290,000 to 296,000 by year-end 2026 — would support a Buy case.
- Operating margin moving toward the high single digits — would show real operating leverage.
- Adjusted EBITDA around $145M in 2026 — would confirm the scale-up is working.
- RADV and CMS risk-adjustment findings — a meaningful clawback would pressure the thesis.
- Free cash flow staying near $188.6M TTM — would keep the balance sheet flexible.
What’s your take? I rated Alignment Healthcare (ALHC) HOLD above — but the goal here is to get this right, not just to publish an opinion. What would you add to this analysis, or which risk or catalyst do you think I’m under- or over-weighting? Tell me in the comments.
Our track record: every directional call is tracked publicly on The Scorecard, and Stocks Covered lists every company we have rated and when.
Sources
- SEC 10-K Annual Report — filed 2026-02-27
- SEC 8-K Filing (2026-05-12)
- SEC 8-K Filing (2026-04-30)
- SEC 8-K Filing (2026-03-04)
- SEC 8-K Filing (2026-02-26)
- SEC 8-K Filing (2026-01-12)
- SEC Form 4 Insider Transaction (2026-06-02)
- SEC Form 4 Insider Transaction (2026-05-19)
- SEC Form 4 Insider Transaction (2026-05-13)
- SEC 10-K Annual Report — FY2026
- SEC 10-K Annual Report — FY2025
Data sourced from Yahoo Finance and SEC EDGAR. Not investment advice.
Leave a Comment