Expected price range
Each range is a ~68% statistical band built from the stock’s own 1-year realised volatility (49% annualised), centred on a path that closes a quarter of the gap to our fair-value midpoint by 3 months and half by 6 months. Starting price $188 (close 2026-10-19). This is an illustration of where our view and normal volatility point, not a forecast, price target or investment advice; the stock can move outside it.
| Company | Oct 25 | Nov 25 | Dec 25 | Jan 26 | Feb 26 | Mar 26 | Apr 26 | May 26 | Jun 26 | Jul 26 | Aug 26 | Sep 26 | 12-Mo |
|---|---|---|---|---|---|---|---|---|---|---|---|---|---|
| AEM | -5% | +8% | -3% | +12% | +32% | -19% | -7% | -3% | -15% | -6% | +40% | -10% | +10% |
| NEM | -4% | +12% | +10% | +13% | +16% | -17% | +3% | -1% | -15% | +0% | +35% | -8% | +38% |
| CDE | -8% | +1% | +3% | +15% | +33% | -31% | -4% | +8% | -16% | -9% | +39% | -15% | -6% |
| GFI | -8% | +12% | +2% | +15% | +17% | -21% | -6% | -6% | -16% | -3% | +43% | -20% | -9% |
Source: Yahoo Finance monthly adjusted close.
Quick Thesis
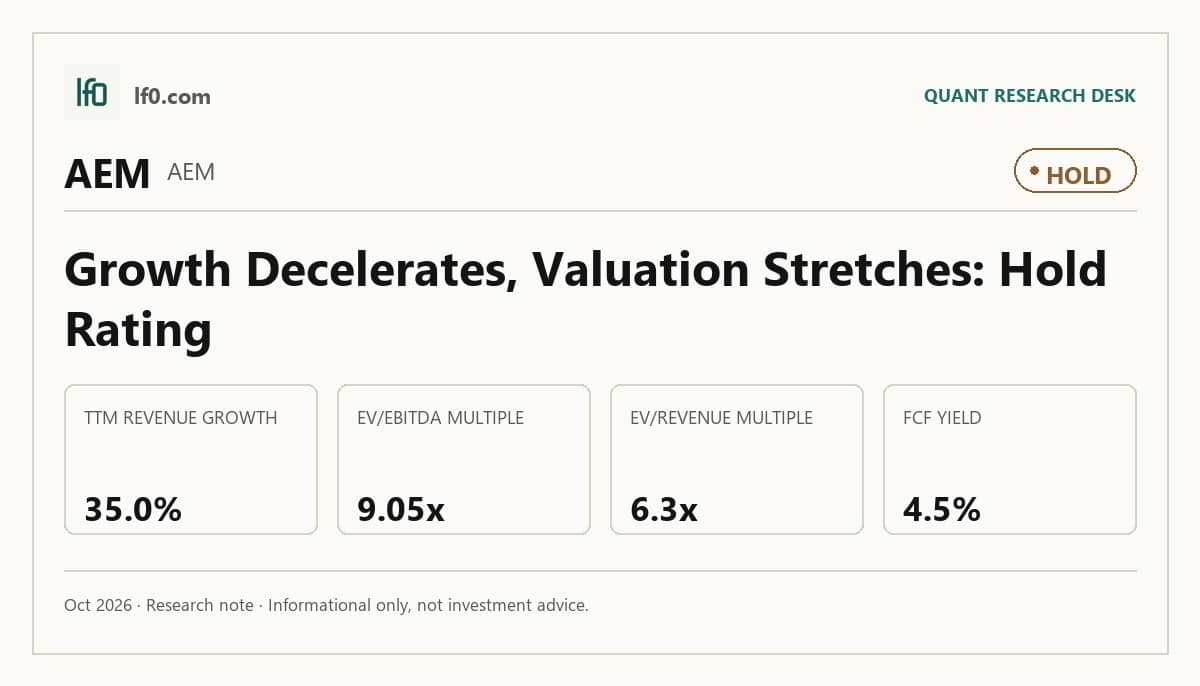
- Rated Hold — quality is strong, but the valuation already discounts it.
- TTM EBITDA margin is 69.9%, showing exceptional operating efficiency.
- Q2 2026 revenue fell to $3.8B from $4.1B in Q1, so growth is decelerating.
- EV/EBITDA is 9x and FCF yield is 4.5%, which looks rich versus peers.
- I would turn more constructive if revenue growth re-accelerates above 30% and the stock moves closer to peer-implied value.
Executive Summary
Rating: HOLD | AEM
Measured from adjusted close on 2026-10-20 to 2026-10-20. Sell ratings are correct when the stock falls; Hold is tracked as a +/-10% range. Daily-close data, not intraday. Calls are tracked for 182 days from publication, then frozen as a final record.
I would put my rating as a Hold because AEM’s operating quality is already visible in the numbers, but the stock still trades at a premium that assumes growth and cash conversion stay near current levels. The company generated $3.8B of revenue in Q2 2026, $2.8B of EBITDA, and $1.6B of net income, while TTM EBITDA margin reached 69.9% and free cash flow margin was 29.5%, so this is a high-quality business rather than a weak one. My hesitation is valuation: at 6.3x EV/Revenue, 9x EV/EBITDA, and 4.5% FCF yield, the shares already price in a lot of that quality.
I would become more constructive if revenue growth re-accelerates above 30% year over year and EBITDA margin stays near 70%, because that would tell me the Q2 slowdown was a pause rather than a trend break. If growth slips into the low 30s or below while the stock remains at this multiple, I would view the current price as too demanding for a Hold.
Company Profile
AEM is a gold producer with a large, cash-generative asset base and a market value of 95B. Its business model is straightforward: it turns mined output into revenue, then converts a high share of that revenue into EBITDA, operating income, and free cash flow. The current share price of $187.6 and forward EPS of 12 imply that investors are paying for earnings power, not for a turnaround.
The company’s profile matters because it explains why the market tolerates a premium multiple. AEM is not a low-margin commodity processor; it is a high-margin producer with strong cash conversion, which gives it more resilience than a typical cyclical miner when prices or volumes soften.
Economic Moat
Business Model
AEM’s moat is built on scale, margin discipline, and cash conversion. TTM gross margin of 74.5%, EBITDA margin of 69.9%, and operating margin of 58.1% show that the business keeps a large share of revenue after direct costs and overhead, which is the clearest sign of structural strength in this model.
That operating profile is also supported by balance-sheet flexibility. Net debt/EBITDA is -0.3x, so the company is in net cash territory on a leverage basis, and that gives management room to keep investing without depending on external financing.
Business & Operating Risks
The main disclosed risk is not existential, but it is real: this is still a commodity-linked business, so revenue and margins can soften if the operating environment turns less favorable. The Q2 2026 revenue decline to $3.8B from $4.1B in Q1 shows how quickly the top line can cool even when the longer trend remains healthy.
I do not see those risks threatening the moat itself. They pressure the pace of cash generation, but they do not yet look like a structural break in the company’s cost or margin advantage.
Management Discussion & Analysis
Management appears to be responding to the slowdown by preserving the cash profile rather than chasing growth at any cost. The company still produced 4.3B of levered free cash flow over the last twelve months, which tells me capital allocation remains disciplined even as quarterly growth moderates.
That matters because the moat here depends on converting strong margins into cash, not just on posting a high revenue number. So far, management is still doing that.
Recent Events
The most recent quarter shows a business that is still strong, but no longer accelerating at the same pace as earlier in the year. Revenue rose from $2.8B in Q2 2025 to $4.1B in Q1 2026 before easing to $3.8B in Q2 2026, while diluted EPS moved from 2.1 to 3.4 and then 3.2 over the same span.
I read that as a test of the moat rather than a break in it. The company is still converting scale into profit, but the latest quarter says the market should stop assuming every period will look better than the last.
Financial Analysis
Growth
AEM — Financial Growth (Quarterly, USD Mil)
| Metric | 2025-06-30 | 2025-09-30 | 2025-12-31 | 2026-03-31 | 2026-06-30 |
|---|---|---|---|---|---|
| REVENUE (USD Mil) | 2,816.1 | 3,059.5 | 3,564 | 4,099.6 | 3,802.8 |
| EBIT (USD Mil) | 1,644 | 1,599.7 | 2,276.6 | 2,575.4 | 2,338.9 |
| EBITDA (USD Mil) | 2,021 | 2,029.7 | 2,698.2 | 2,995.6 | 2,762.2 |
| NET INCOME (USD Mil) | 1,068.7 | 1,055 | 1,523.1 | 1,695.5 | 1,600.5 |
| DILUTED EPS | 2.1 | 2.1 | 3 | 3.4 | 3.2 |
Source: Yahoo Finance — Quarterly Financial Statements
Revenue grew from $2.8B in Q2 2025 to $3.1B in Q3 2025, $3.6B in Q4 2025, and $4.1B in Q1 2026 before slipping to $3.8B in Q2 2026. That sequence still leaves the business well ahead of the prior year, but the sequential decline and slower year-over-year pace in Q2 tell me growth is decelerating rather than compounding cleanly.
EBITDA followed the same broad pattern, rising to $3B in Q1 2026 and then easing to $2.8B in Q2 2026. The important point is that the business is still growing, but the market should not extrapolate the Q1 run rate as if it were permanent.
Profitability
AEM — Profitability (TTM)
| Metric | TTM |
|---|---|
| Operating Margin (TTM) | 58.1% |
| Net Margin (TTM) | 40.4% |
| Return on Assets (TTM) | 15.7% |
| Return on Equity (TTM) | 23.0% |
| Gross Margin (TTM) | 74.5% |
| EBITDA Margin (TTM) | 69.9% |
Source: Yahoo Finance — Trailing Twelve Months (TTM)
TTM profitability remains the strongest part of the case. Gross margin was 74.5%, EBITDA margin 69.9%, operating margin 58.1%, and net margin 40.4%, which is an unusually strong spread for a capital-intensive producer.
The return metrics reinforce that point: ROA was 15.7% and ROE was 23%. In my view, that combination says the company is not just growing; it is growing efficiently, with the margin structure doing most of the work.
Valuation
AEM — Valuation Multiples
| Metric | Value |
|---|---|
| Current Share Price (USD) | 187.6 |
| Market Cap (USD Mil) | 94,999 |
| Enterprise Value (USD Mil) | 91,842 |
| Trailing P/E | 16 |
| Forward P/E | 15.6 |
| Price/Sales (TTM) | 6.5 |
| Price/Book (mrq) | 3.3 |
| EV/Revenue | 6.3 |
| EV/EBITDA | 9 |
| Beta (5Y Monthly) | 0.64 |
| FCF Yield % (TTM) | 4.5% |
| Forward EPS (USD) | 12 |
| Analyst Target Price – Low (USD) | 87 |
| Analyst Target Price – Mean (USD) | 216.9 |
| Analyst Target Price – High (USD) | 300 |
| # Analyst Opinions | 14 |
Source: Yahoo Finance
I would keep the valuation call simple: the stock is not cheap. AEM trades at 16x trailing P/E, 15.6x forward P/E, 6.5x price/sales, and 9x EV/EBITDA, while FCF yield is 4.5%. That is a full price for a business with excellent margins, but it is not a bargain.
My fair-value range on the analysis here is roughly $128-$161 per share, based on peer EV/Revenue and the company’s own cash and leverage profile. That range sits below the current $187.6 share price and also below the $216.9 analyst mean target, so I am more conservative than consensus because I weight the recent growth deceleration more heavily than the market appears to. The analyst range is still useful, though: with 14 opinions, there is real coverage, and my range sits below the consensus mean but above the $87 low, which tells me the market is not uniformly bearish. On earnings, I would frame fair value around 11-$13 of forward EPS, which is close to the company’s own 12 forward EPS and modestly richer than NEM’s 10.1, but that premium is only justified if AEM keeps converting earnings into cash at the current rate.
The rating justification is the same in one sense and different in another: the stock deserves a premium for quality, but not this much of one. I would not call it expensive on a distressed basis; I would call it expensive relative to the growth and cash yield the market is already discounting.
Leverage
AEM — Leverage & Coverage (Quarterly)
| Metric | Value |
|---|---|
| Total Debt/Equity % (mrq) | 1.1 |
| Current Ratio (mrq) | 2.9 |
| Total Debt (mrq, USD Mil) | 320.4 |
| Operating Cash Flow (TTM, USD Mil) | 7,417.4 |
| Levered Free Cash Flow (TTM, USD Mil) | 4,282.3 |
| Net Debt/EBITDA (TTM) | -0.3 |
| FCF Margin % (TTM) | 29.5% |
Source: Yahoo Finance — Quarterly Financial Statements
Leverage is a clear support for the thesis. Total debt/equity is 1.1%, current ratio is 2.9x, total debt is $320.4M, and net debt/EBITDA is -0.3x, so the balance sheet is effectively net cash.
That matters because it reduces the chance that a softer quarter turns into a financing problem. With $7.4B of operating cash flow and $4.3B of levered free cash flow over the last twelve months, the company has enough liquidity to absorb volatility without changing the equity story.
Insider Activity
Insider ownership is 7.0%, while institutional ownership is 71.3%. I view that mix as neutral to slightly supportive: institutions clearly matter in the stock, but insider alignment is still meaningful enough that management has skin in the game.
Comparable Analysis
LF0 has published standalone analyses of these peers: Newmont Corporation (NEM) (rated Hold); Coeur Mining (CDE) (rated Hold); Gold Fields (GFI) (rated Buy).
Growth
| Company | Revenue TTM (USD Mil) | Revenue Growth YoY % | EBITDA TTM (USD Mil) | Diluted EPS TTM |
|---|---|---|---|---|
| AEM | 14,525.9 | 35.0% | 10,149.3 | 11.7 |
| NEM | 25,767 | 15.1% | 17,058 | 7.9 |
| CDE | 3,171.2 | 125.9% | 1,629.4 | 1.2 |
| GFI | 11,370.5 | 78.9% | 7,129.7 | 4.9 |
Source: Yahoo Finance
AEM’s revenue growth was 35.0% TTM, ahead of NEM at 15.1% and GFI at 78.9% on the table, while CDE’s 125.9% reflects a much smaller base. The key takeaway is that AEM is growing faster than the large-cap peer, but not so fast that it should automatically command a much richer multiple.
Valuation
| Company | Current Share Price (USD) | Trailing P/E | Forward P/E | EV/Revenue | EV/EBITDA | Price/Sales (TTM) | Price/Book (mrq) | Beta (5Y Monthly) | FCF Yield % (TTM) | Forward EPS | Analyst Target Price – Low | Analyst Target Price – Mean | Analyst Target Price – High | # Analyst Opinions |
|---|---|---|---|---|---|---|---|---|---|---|---|---|---|---|
| AEM | 187.6 | 16 | 15.6 | 6.3 | 9 | 6.5 | 3.3 | 0.64 | 4.5% | 12 | 87 | 216.9 | 300 | 14 |
| NEM | 118 | 15 | 11.6 | 4.7 | 7.1 | 4.8 | 3.5 | 0.53 | 7.1% | 10.1 | 67 | 137.4 | 165 | 21 |
| CDE | 15.3 | 13.2 | 8.4 | 4.9 | 9.5 | 5 | 1.5 | 1.37 | 5.1% | 1.8 | 18 | 23.3 | 30 | 11 |
| GFI | 36.7 | 7.5 | 7.5 | 5.8 | 9.3 | 2.9 | 7.3 | 0.64 | 12.8% | 4.9 | 38 | 47.3 | 57 | 8 |
Source: Yahoo Finance
AEM trades at 6.3x EV/Revenue and 9x EV/EBITDA, versus NEM at 4.7x and 7.1x, CDE at 4.9x and 9.5x, and GFI at 5.8x and 9.3x. On a $1 invested basis, AEM returned 6.0% over the past year, below NEM’s 25.5% but above GFI’s -11.8% and CDE’s -30.3%, which tells me the market has rewarded NEM’s cheaper cash profile more than AEM’s higher quality.
Profitability
| Company | Operating Margin (TTM) | Net Margin (TTM) | Return on Assets (TTM) | Return on Equity (TTM) | Gross Margin (TTM) | EBITDA Margin (TTM) |
|---|---|---|---|---|---|---|
| AEM | 58.1% | 40.4% | 15.7% | 23.0% | 74.5% | 69.9% |
| NEM | 51.6% | 33.4% | 15.8% | 25.9% | 68.0% | 66.2% |
| CDE | 19.4% | 26.8% | 7.1% | 12.8% | 56.3% | 51.4% |
| GFI | 55.0% | 38.7% | 28.5% | 58.7% | 57.8% | 62.7% |
Source: Yahoo Finance
AEM’s operating margin of 58.1% and net margin of 40.4% are better than NEM’s 51.6% and 33.4%, and far above CDE’s 19.4% and 26.8%. GFI posts stronger ROE and ROA at 58.7% and 28.5%, but AEM’s 23.0% ROE and 15.7% ROA still place it in the upper tier of the group.
Leverage
| Company | Total Debt/Equity % (mrq) | Current Ratio (mrq) | Net Debt/EBITDA (TTM) | FCF Margin % (TTM) |
|---|---|---|---|---|
| AEM | 1.1 | 2.9 | -0.3 | 29.5% |
| NEM | 15.8 | 2.5 | -0.2 | 34.2% |
| CDE | 6.9 | 3.7 | -0.2 | 25.1% |
| GFI | 28.6 | 1.9 | 0.1 | 36.7% |
Source: Yahoo Finance
AEM’s debt/equity of 1.1% and net debt/EBITDA of -0.3x are much cleaner than NEM’s 15.8% and -0.2x, CDE’s 6.9% and -0.2x, and GFI’s 28.6% and 0.1x. That balance-sheet strength helps explain why AEM can trade at a premium to some peers even though its FCF yield of 4.5% is below NEM’s 7.1% and GFI’s 12.8%.
Conclusion
I would put my rating as a Hold because the core tension is now clear: AEM’s margins and balance sheet are strong enough to support a premium, but the latest quarter shows growth slowing while the stock still trades as if execution will stay near peak levels. The numbers do not show a broken business; they show a good business that is already priced for a lot of success.
The bull case is straightforward. If revenue growth moves back above 30% year over year and EBITDA margin stays near 70%, then the Q2 2026 slowdown looks temporary and the current valuation becomes easier to defend. I would also become more constructive if free cash flow stays around $4.3B over the next twelve months, because that would confirm the company can keep compounding without stretching the balance sheet.
The bear case is just as clear. If revenue growth stays in the low 30s or slips lower and EBITDA growth continues to lag revenue, then the market will be paying 9x EV/EBITDA and 4.5% FCF yield for a business that is no longer accelerating. In that case, I would expect the shares to drift toward the lower end of the peer-implied range rather than justify a richer multiple.
My final view is still Hold because the downside is cushioned by cash generation and net cash leverage, but the upside needs either a cleaner re-acceleration or a better entry point. Until one of those shows up, I think the stock is good enough to own and not cheap enough to chase.
What to Watch Next
- Revenue growth back above 30% YoY — would support a move toward Buy.
- EBITDA margin holding near 70% — would confirm the operating model is intact.
- Levered free cash flow staying near $4.3B — would support the current balance-sheet strength.
- EV/EBITDA falling closer to peer levels — would improve the valuation case.
- Another quarter of sequential revenue decline — would strengthen the bear case.
What’s your take? I rated Agnico Eagle Mines (AEM) HOLD above — but the goal here is to get this right, not just to publish an opinion. What would you add to this analysis, or which risk or catalyst do you think I’m under- or over-weighting? Tell me in the comments.
Data sourced from Yahoo Finance and SEC EDGAR. Not investment advice.
Leave a Comment