
Expected price range
Each range is a ~68% statistical band built from the stock’s own 1-year realised volatility (23% annualised), centred on a path that closes a quarter of the gap to our fair-value midpoint by 3 months and half by 6 months. Starting price $93.39 (close 2026-10-19). This is an illustration of where our view and normal volatility point, not a forecast, price target or investment advice; the stock can move outside it.
| Company | Oct 25 | Nov 25 | Dec 25 | Jan 26 | Feb 26 | Mar 26 | Apr 26 | May 26 | Jun 26 | Jul 26 | Aug 26 | Sep 26 | 12-Mo |
|---|---|---|---|---|---|---|---|---|---|---|---|---|---|
| CL | -3% | +4% | -2% | +15% | +10% | -14% | +1% | +6% | +2% | +0% | -2% | -5% | +9% |
| KMB | -4% | -9% | -6% | -1% | +11% | -12% | +2% | -1% | +14% | -0% | -1% | -9% | -18% |
| CLX | -8% | -4% | -7% | +13% | +13% | -19% | -6% | -7% | +6% | +0% | +3% | -17% | -31% |
| CHD | +0% | -3% | -2% | +15% | +9% | -11% | +4% | -1% | +1% | +2% | +1% | -6% | +9% |
| KVUE | -11% | +22% | -1% | +1% | +11% | -10% | +2% | -0% | +11% | +1% | -1% | -5% | +15% |
Source: Yahoo Finance monthly adjusted close.
Quick Thesis
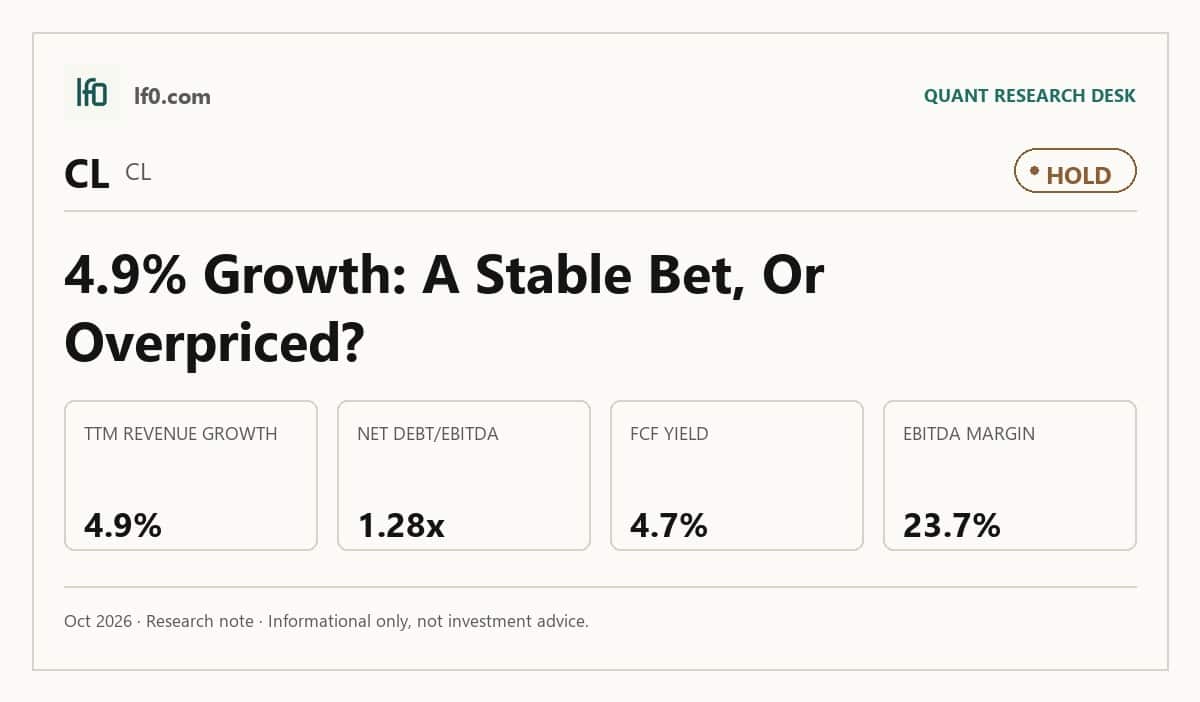
- Rated hold — quality franchise, but valuation already reflects it.
- Strongest support: 21.0% TTM operating margin and 60.4% gross margin.
- Main risk: 1.3x net debt/EBITDA and only 1.0x current ratio.
- Valuation is fair, with 3.9x EV/revenue and 22.8x forward P/E.
- I would turn more constructive if operating margin stays above 21.0% and FCF yield tops 5.0%.
Executive Summary
Rating: HOLD | CL
Measured from adjusted close on 2026-10-20 to 2026-10-20. Sell ratings are correct when the stock falls; Hold is tracked as a +/-10% range. Daily-close data, not intraday. Calls are tracked for 182 days from publication, then frozen as a final record.
I would put my rating as a Hold because Colgate-Palmolive combines a defensible global brand base with a valuation that already discounts much of that quality. TTM operating margin was 21.0% and gross margin was 60.4%, which supports the franchise, but the stock still trades at 22.8x forward P/E and 3.9x EV/revenue, so investors are paying for steady execution rather than a clear mispricing. I would raise my rating more towards a Buy if the Strategic Growth and Productivity Program starts to show through in the numbers, specifically if operating margin moves above 22.0%, meaning the company is turning more of its gross profit into operating profit, and if FCF yield holds above 5.0%, which would show that cash conversion is improving faster than the market expects.
Company Profile
Colgate-Palmolive was founded in 1806 and incorporated in Delaware in 1923. It is a consumer staples company listed on the New York Stock Exchange under CL, and it sells oral care, personal care, home care, and pet nutrition products in over 200 countries and territories. Revenue comes mainly from toothpaste, toothbrushes, mouthwash, soaps, cleaners, fabric conditioners, and Hill’s Pet Nutrition, with 2025 net sales split 44% Oral Care, 17% Personal Care, 16% Home Care, and 23% Pet Nutrition. Oral Care is led by Colgate, Darlie, elmex, hello, meridol, Sorriso, and Tom’s of Maine; Hill’s sells in over 80 countries through Science Diet, Prescription Diet, and Prime100. As of December 31, 2025, it had about 33,600 employees in over 100 countries, with roughly two-thirds of revenue outside the United States.
Economic Moat
Business Model
Colgate’s global brand penetration and category leadership are the hardest parts of the model to replicate within 3 years, in my view, because the company sells into over 200 countries and territories and holds global leadership in toothpaste, manual toothbrushes, and liquid hand soap according to its 2026 10-K. That scale is reinforced by a broad trademark portfolio that includes Colgate, Palmolive, Darlie, elmex, hello, meridol, Sorriso, Tom’s of Maine, EltaMD, Filorga, Irish Spring, Lady Speed Stick, PCA SKIN, Protex, Sanex, Softsoap, Speed Stick, Ajax, Axion, Fabuloso, Murphy, Soupline, Suavitel, Hill’s Science Diet, Hill’s Prescription Diet, and Prime100, and those rights endure for as long as they are used or registered. I also view the company’s omni-channel demand generation, data, analytics and AI capabilities as a secondary advantage because they help defend shelf space and consumer attention in a market that is increasingly shaped by eCommerce, social commerce, and direct-to-consumer competition. The supply chain is another support, but it is secondary because the filing frames it as agile and resilient rather than exclusive or hard to copy.
In 2022, Colgate’s business was already global and category-led, but the mix was narrower: prior filings showed Oral, Personal and Home Care at 44%, 20%, and 17% of net sales, with no separate Pet Nutrition emphasis in the business description. By 2023 and 2024, the company had added more explicit premium and fabric-care positioning, including market leadership in fabric conditioners under Suavitel, Soupline, and Cuddly, which signaled a broader household-care franchise. Today, the 2026 10-K shows a more balanced portfolio, with Oral, Personal and Home Care at 44%, 17%, and 16% of 2025 net sales and Pet Nutrition at 23%, which means the business is less dependent on any single household category and has a more diversified growth base. The Hill’s Pet Nutrition segment, marketed in over 80 countries and territories, is now a much larger part of the story than it was in the earliest filings, and that shift matters because it gives Colgate a second branded platform with different demand drivers. On balance, the business is structurally stronger than 5 years ago because the portfolio is broader, the pet franchise is more material, and the company has kept its category leadership while expanding its mix.
Business & Operating Risks
The most material disclosed risk is foreign currency and trade exposure across a business that generates approximately two-thirds of net sales outside the United States, because exchange-rate moves, tariffs, and repatriation limits can hit both reported sales and cash flow at the same time. According to the risk factors in their SEC 10-K, Colgate also faces changes in exchange rates for foreign currencies, trade restrictions and tariffs, and exchange controls and other limits on importing, exporting, or repatriating cash. The financial data in this article makes that risk real rather than hypothetical: the company’s global footprint means translation can move reported results even when local demand is stable, so this is a direct earnings and cash conversion headwind, not just a legal disclosure. The filing also says these measures have not and may not in the future fully offset the impact, which means pricing and hedging are partial defenses, not a full shield.
The second risk is retailer bargaining power in a more concentrated omni-channel market, where key customers can demand higher trade discounts, slotting fees, and assortment changes. The filing is explicit that large retailers have greater bargaining strength, exclusive access to valuable first-party consumer data and analytics, and can force higher trade discounts, allowances, slotting fees or delist products. That is already showing up in the business model pressure described in the filing, because Colgate is increasingly dependent on a smaller set of powerful channels while private label competition remains a direct substitute. The financial data in this article is consistent with that pressure: if retailers push harder on price and mix, the company’s margin structure can absorb it, but only by giving up some profitability or volume.
The third risk is input-cost inflation and supply-chain disruption, especially for raw and packaging materials, logistics, and concentrated third-party suppliers. The filing names resins, essential oils, tropical oils, pulp, tallow, corn, poultry and soybeans and says the company buys certain key materials from single-source suppliers or a limited number of suppliers. That risk has already materialized in the sense that the filing says these costs have affected margins and may continue to do so, so this is not a distant possibility. The same logic applies to the Strategic Growth and Productivity Program, which was approved on July 31, 2025; the company is trying to offset cost pressure through restructuring, which tells me management sees the issue as ongoing rather than temporary. These risks do not break the moat, but they do pressure the very scale and brand advantages that support it, because the moat only stays valuable if Colgate can keep converting global reach into margin, not just volume.
Management Discussion & Analysis
Management is actively responding to the cost and channel pressures above through the Strategic Growth and Productivity Program, but the latest margin data shows the response is still in progress rather than complete. The program was approved on July 31, 2025 with a pre-tax charge of $200M to $300M, and the company later lifted the expected cumulative pre-tax charge to $350M to $550M from $200M to $300M, which tells me management is willing to spend more to simplify the cost base and support the 2030 strategy. That is a credible response to the risks, but it also means the near-term cash burden is larger than first planned.
The operating numbers show why that matters. Gross margin was 60.4% TTM, yet operating margin was 21.0%, so the company is still carrying a large overhead structure even after years of productivity work. The 2025 gross profit margin also slipped to 60.1% from 60.5% on a non-GAAP basis, while operating profit margin fell to 21.3% from 21.7%, which suggests the savings are not yet outrunning inflation. I read that as disciplined but not fully self-funding execution: management is protecting the franchise, but the margin bridge still needs to widen before the market should pay for a cleaner earnings compounding story.
Capital allocation is more shareholder-friendly than conservative. The company authorized $5 billion of share repurchases on March 20, 2025 and paid $1.8B of dividends in 2025, while total debt rose to $8B and long-term debt also reached $8B. That mix tells me management is comfortable using balance-sheet capacity to support per-share returns, which is sensible as long as cash conversion stays strong. The Prime100 acquisition, bought on April 30, 2025 for AU $471, or about $301M, adds a fresh pet-food adjacency, but it is still too small to change the overall earnings base in a meaningful way.
Recent Events
The most significant development I see is the April 30, 2026 expansion of Colgate-Palmolive’s Strategic Growth and Productivity Program, disclosed on May 1, 2026. The company lifted the expected cumulative pre-tax charge to $350M to $550M from $200M to $300M, with 80% to 90% of that expected to be cash costs by December 31, 2028. In my view, that strengthens the long-term operating case because it signals a more aggressive effort to simplify the cost base and support the 2030 strategy, but it also tests near-term cash conversion because the restructuring bill is now materially larger.
Two governance changes point in the same direction of orderly transition rather than disruption. On March 12, 2026, Christopher S. Boerner was elected to the board, bringing global healthcare and commercialization experience, while Steven A. Cahillane said he will not stand for reelection at the May 8, 2026 annual meeting. Then on April 8, 2026, Jennifer M. Daniels announced her retirement and Betsy Fishbone was elected Chief Legal Officer and Secretary effective June 1, 2026. I read both moves as reinforcing board and management continuity, not weakening the franchise.
The May 8, 2026 annual meeting, disclosed on May 13, 2026, also matters because shareholders approved executive compensation and rejected the proposals to remove diversity, equity and inclusion considerations from board nominations and to require an independent board chair. That outcome leaves the current governance structure intact, which supports strategic consistency. Recent 8-K disclosures therefore leave the investment case modestly stronger, with the main offset being the larger restructuring charge.
Financial Analysis
Growth
CL — Financial Growth (Quarterly, USD Mil)
| Metric | 2025-06-30 | 2025-09-30 | 2025-12-31 | 2026-03-31 | 2026-06-30 |
|---|---|---|---|---|---|
| REVENUE (USD Mil) | 5,110 | 5,131 | 5,230 | 5,324 | 5,361 |
| EBIT (USD Mil) | 1,078 | 1,059 | 172 | 954 | 1,012 |
| EBITDA (USD Mil) | 1,229 | 1,217 | 345 | 1,110 | 1,167 |
| NET INCOME (USD Mil) | 743 | 735 | -37 | 646 | 693 |
| DILUTED EPS | 0.9 | 0.9 | -0.1 | 0.8 | 0.9 |
Source: Yahoo Finance — Quarterly Financial Statements
Revenue is still inching higher, but the pace is modest: 5.1B in Q2 2025, 5.1B in Q3 2025, 5.2B in Q4 2025, 5.3B in Q1 2026, and 5.4B in Q2 2026. That is only about 5% growth from Q2 2025 to Q2 2026, so the top line looks steady rather than fast. EBITDA moved more unevenly, from 1.2B in Q2 2025 to 345M in Q4 2025 before rebounding to 1.1B in Q1 2026 and 1.2B in Q2 2026, which means profit growth has been more volatile than sales. The Q4 2025 drop is the swing to watch, and it matters because the moat only translates into equity value if the company can keep growth and earnings moving together.
Profitability
CL — Profitability (TTM)
| Metric | TTM |
|---|---|
| Operating Margin (TTM) | 21.0% |
| Net Margin (TTM) | 9.7% |
| Return on Assets (TTM) | 15.8% |
| Return on Equity (TTM) | 267.4% |
| Gross Margin (TTM) | 60.4% |
| EBITDA Margin (TTM) | 23.7% |
Source: Yahoo Finance — Trailing Twelve Months (TTM)
TTM operating margin of 21.0%, gross margin of 60.4%, and EBITDA margin of 23.7% show a profitable core business with a 39.4 percentage point gap between gross and operating margin, which points to heavy selling, general and administrative expense rather than a weak product model. That gap matters because investors should weight operating leverage more than gross margin here: the company is already converting a large share of gross profit into operating profit, so the next step is not fixing the product, but continuing to spread overhead across a larger base.
TTM net margin of 9.68% is well below operating margin, so interest, taxes, and other below-the-line items still absorb a meaningful slice of earnings. TTM return on assets of 15.8% and return on equity of 267% both indicate strong capital efficiency, but the ROE figure is amplified by leverage and a very small equity base, so ROA is the cleaner measure of underlying profitability. The company is moving toward stronger earnings quality in the sense that margins are already positive and substantial, but the key watchpoint is whether net margin keeps closing the gap to operating margin rather than relying on financial leverage to flatter returns.
Valuation
CL — Valuation Multiples
| Metric | Value |
|---|---|
| Current Share Price (USD) | 93.4 |
| Market Cap (USD Mil) | 74,448 |
| Enterprise Value (USD Mil) | 81,182 |
| Trailing P/E | 36.8 |
| Forward P/E | 22.8 |
| Price/Sales (TTM) | 3.5 |
| Price/Book (mrq) | 315.5 |
| EV/Revenue | 3.9 |
| EV/EBITDA | 16.3 |
| Beta (5Y Monthly) | 0.32 |
| FCF Yield % (TTM) | 4.7% |
| Forward EPS (USD) | 4.1 |
| Analyst Target Price – Low (USD) | 87 |
| Analyst Target Price – Mean (USD) | 98.2 |
| Analyst Target Price – High (USD) | 110 |
| # Analyst Opinions | 20 |
Source: Yahoo Finance
Colgate-Palmolive trades at 3.9x EV/revenue and 3.5x price/sales on TTM results, which is the cleanest anchor here because the 22.8x forward P/E and 16.3x EV/EBITDA already assume the company keeps converting a mature consumer staples revenue base into steady cash flow. At the current share price of 93.4, the market is paying for a business that can sustain 21.0% operating margin and keep earnings compounding without a major reset in margins or cash conversion.
The rest of the stack points the same way. Trailing P/E is 36.8x, so the stock is not cheap on reported earnings, while forward P/E of 22.8x implies investors are already looking through the recent earnings dip and expecting EPS of 4.09. Price/book is 316x, which is not a useful cheapness signal here because book value per share is only 0.296 and accumulated distributions and buybacks have left equity capital very thin relative to market value. FCF yield is 4.7%, or about 3.5B of levered free cash flow on a 74.4B market cap, which is respectable but not enough to call the stock inexpensive. PEG is 1.7x, so the valuation is fair to slightly rich rather than distressed.
On my read, fair value sits in a broad 87–110 range, which lines up with the analyst target range and brackets the current price. The 98.2 mean target is close to where I would anchor the stock if margin execution improves, but I would not pay above the high end without clearer evidence that the productivity program is lifting operating margin and free cash flow at the same time. Forward EPS of 4.09 also looks reasonable against peers, but the market is already paying for that earnings profile through a premium EV/revenue multiple, so the stock is fairly valued rather than obviously cheap.
Leverage
CL — Leverage & Coverage (Quarterly)
| Metric | Value |
|---|---|
| Total Debt/Equity % (mrq) | 1,388.2 |
| Current Ratio (mrq) | 1 |
| Total Debt (mrq, USD Mil) | 7,857 |
| Operating Cash Flow (TTM, USD Mil) | 4,456 |
| Levered Free Cash Flow (TTM, USD Mil) | 3,458.4 |
| Net Debt/EBITDA (TTM) | 1.3 |
| FCF Margin % (TTM) | 16.4% |
Source: Yahoo Finance — Quarterly Financial Statements
Colgate-Palmolive’s leverage is elevated but manageable: Total Debt/Equity % (mrq) was 1388%, Current Ratio (mrq) was 1.026, Total Debt (mrq, USD Mil) was 7857, Operating Cash Flow (TTM, USD Mil) was 4456, Levered Free Cash Flow (TTM, USD Mil) was 3458, Net Debt/EBITDA (TTM) was 1.3x, and FCF Margin % (TTM) was 16.4%. In my opinion, this is medium refinancing risk because the company generates enough cash to service debt and still convert 16.4% of revenue into free cash flow, but the 1.0 current ratio leaves only a thin near-term liquidity cushion. EBITDA is turning into cash well, so the balance sheet is not strained today; the main watchpoint is whether working capital or a rate shock erodes that cushion before the next refinancing window. That leverage profile also helps explain why the market can tolerate a premium valuation: the company is not using debt to force growth, but it is using cash generation to keep the balance sheet flexible.
Insider Activity
The insider transaction record I see here is one-sided selling: 12 open-market sales for $26.9M and no open-market purchases over the 2025-01-02 to 2026-05-15 window. The activity is somewhat concentrated because the largest sale came from Panagiotis Tsourapas, but it is also broad enough to include multiple insiders, which suggests weak alignment rather than a single isolated event. I do not read this as a thesis breaker, but it is a bear signal because the pattern is persistent net open-market selling with no offsetting insider buying.
Comparable Analysis
LF0 has published standalone analyses of these peers: Kimberly-Clark (KMB) (rated Hold).
Growth
| Company | Revenue TTM (USD Mil) | Revenue Growth YoY % | EBITDA TTM (USD Mil) | Diluted EPS TTM |
|---|---|---|---|---|
| CL | 21,047 | 4.9% | 4,983 | 2.5 |
| KMB | 16,582 | 0.6% | 3,481 | 5.1 |
| CLX | 6,720 | -2.0% | 1,140 | 4.8 |
| CHD | 6,229.1 | 1.6% | 1,354.8 | 3.1 |
| KVUE | 15,408 | 3.0% | 3,481 | 0.9 |
Source: Yahoo Finance
CL’s revenue grew 4.9% TTM and diluted EPS reached 2.5 TTM, ahead of KMB’s 0.6% revenue growth and 5.1 EPS, CHD’s 1.6% growth and 3.1 EPS, and well above CLX’s -2.0% revenue decline and 4.8 EPS. KVUE is closer on top line at 3.0% growth but still trails CL on growth quality, so the premium growth profile is real, though not so wide that it alone justifies a large valuation gap.
Valuation
| Company | Current Share Price (USD) | Trailing P/E | Forward P/E | EV/Revenue | EV/EBITDA | Price/Sales (TTM) | Price/Book (mrq) | Market Cap (USD Mil) | Enterprise Value (USD Mil) | Beta (5Y Monthly) | FCF Yield % (TTM) | Forward EPS | Analyst Target Price – Low | Analyst Target Price – Mean | Analyst Target Price – High | # Analyst Opinions |
|---|---|---|---|---|---|---|---|---|---|---|---|---|---|---|---|---|
| CL | 93.4 | 36.8 | 22.8 | 3.9 | 16.3 | 3.5 | 315.5 | 74,448 | 81,182 | 0.32 | 4.7% | 4.1 | 87 | 98.2 | 110 | 20 |
| KMB | 105.4 | 20.8 | 14.2 | 2.5 | 11.7 | 2.1 | 20 | 34,990 | 40,764 | 0.28 | 2.7% | 7.4 | 90 | 114.8 | 162 | 15 |
| CLX | 85.6 | 17.8 | 13.9 | 2.4 | 14 | 1.5 | 115 | 10,347 | 15,964 | 0.57 | 1.1% | 6.2 | 74 | 96.4 | 154 | 17 |
| CHD | 104.1 | 33.4 | 25.8 | 4.3 | 19.8 | 4 | 5.7 | 24,691 | 26,864 | 0.48 | 3.8% | 4 | 78 | 104.6 | 115 | 19 |
| KVUE | 18.9 | 21.9 | 15.2 | 2.8 | 12.6 | 2.4 | 3.4 | 36,245 | 43,748 | 0.45 | 5.3% | 1.2 | 18 | 19.5 | 23 | 12 |
Source: Yahoo Finance
CL trades at 4.7% FCF yield TTM, 3.9x EV/revenue, 36.8x trailing P/E, and 22.8x forward P/E, versus KMB at 2.7%, 2.5x, 20.8x, and 14.2x; CLX at 1.1%, 2.4x, 17.8x, and 13.9x; CHD at 3.8%, 4.3x, 33.4x, and 25.8x; and KVUE at 5.3%, 2.8x, 21.9x, and 15.2x. On FCF yield, CL sits between the higher-yielding KVUE and CHD and the lower-yielding KMB and CLX, which means the stock is not cheap enough to call a clear value name, but it is also not priced like the weakest cash generator in the group. Using peer EV/revenue of 2.4x to 4.3x on CL’s $21B TTM revenue implies an enterprise value of $50.1B to $90.8B, or about $53.7 to $107.3 per share after netting $7.9B of debt and $1.5B of cash and dividing by 797.2M shares outstanding; that range brackets the 93.4 current share price, so the market is already paying for a mid-to-upper peer multiple. That premium is easier to justify because CL’s 1.3x net debt/EBITDA is better than KMB’s 1.6x and far better than CLX’s 4.8x, so investors are paying for both quality and balance-sheet resilience, not just for the brand.
Profitability
| Company | Operating Margin (TTM) | Net Margin (TTM) | Return on Assets (TTM) | Return on Equity (TTM) | Gross Margin (TTM) | EBITDA Margin (TTM) |
|---|---|---|---|---|---|---|
| CL | 21.0% | 9.7% | 15.8% | 267.4% | 60.4% | 23.7% |
| KMB | 19.0% | 11.8% | 10.2% | 104.9% | 37.6% | 21.0% |
| CLX | 12.9% | 8.7% | 8.3% | 163.8% | 42.3% | 17.0% |
| CHD | 18.1% | 12.0% | 7.9% | 17.0% | 45.6% | 21.8% |
| KVUE | 19.4% | 10.8% | 7.0% | 15.6% | 58.4% | 22.6% |
Source: Yahoo Finance
CL’s 21.0% operating margin, 9.68% net margin, 60.4% gross margin, and 23.7% EBITDA margin all sit above KMB’s 19.0%, 11.8%, 37.6%, and 21.0%, and above CLX’s 12.9%, 8.7%, 42.3%, and 17.0%, while CHD and KVUE are closer on operating margin at 18.1% and 19.4%. The standout is gross margin, where CL’s 60.4% is far above every peer, which points to a stronger cost-of-revenue structure rather than just lower opex; the operating-margin lead is smaller, so some of that gross advantage is being reinvested or spent below the line.
Leverage
| Company | Total Debt/Equity % (mrq) | Current Ratio (mrq) | Total Debt (mrq, USD Mil) | Operating Cash Flow TTM (USD Mil) | Free Cash Flow TTM (USD Mil) | Net Debt/EBITDA (TTM) | FCF Margin % (TTM) |
|---|---|---|---|---|---|---|---|
| CL | 1,388.2 | 1 | 7,857 | 4,456 | 3,458.4 | 1.3 | 16.4% |
| KMB | 348.9 | 0.9 | 6,539 | 3,333 | 941.1 | 1.6 | 5.7% |
| CLX | 2,221.4 | 0.7 | 5,598 | 612 | 110.4 | 4.8 | 1.6% |
| CHD | 55.9 | 1.1 | 2,428.3 | 1,260.5 | 939.3 | 1.6 | 15.1% |
| KVUE | 81.6 | 1 | 8,613 | 2,325 | 1,907.5 | 2.2 | 12.4% |
Source: Yahoo Finance
CL’s 1.3x net debt/EBITDA and 16.4% FCF margin are better than KMB’s 1.6x and 5.7%, CLX’s 4.8x and 1.6%, and CHD’s 1.6x and 15.1%, while KVUE is more levered at 2.2x but still generates 12.4% FCF margin. The raw debt/equity figure of 1388% looks extreme, but net debt/EBITDA shows the real picture: CL is not lightly levered, yet its cash generation is strong enough that the balance sheet is a financing choice rather than a stress point.
Conclusion
I would put my rating as a Hold because Colgate-Palmolive is a high-quality cash generator, but the current 93.4 share price already reflects most of that stability while the latest quarter still showed only 4.9% TTM revenue growth and a 1.3x net debt to EBITDA profile. The strongest support is free cash flow yield, which was 4.7% on TTM results, or $3.5B of levered free cash flow on a $74.4B market cap, so the stock is not expensive on cash generation. The main risk is leverage and liquidity discipline: current ratio was 1.0x and total debt was $7.9B in the most recent quarter, which leaves little room if working capital tightens.
I would move more towards a Buy if operating margin stays above 21.0% and the Strategic Growth and Productivity Program starts lifting gross margin beyond 60.4% in the next two quarters, because that would show the restructuring is improving earnings quality rather than just adding charges. I would also want FCF yield to hold above 5.0%, meaning cash conversion is improving faster than the market expects, while net debt/EBITDA stays near 1.3x so the company is not buying growth with a weaker balance sheet.
I would move from Hold to Sell if revenue growth slips below 3.0% for two consecutive quarters while operating margin falls back under 20.0%, because that would mean the premium multiple is being supported by slower growth and weaker profitability at the same time. The other bear trigger is a sustained deterioration in cash conversion, especially if FCF margin drops below 15.0%, since that would show the current dividend and buyback profile is being funded with less room to absorb currency or input-cost pressure.
Weighing both sides, I lean to Hold because the bull case depends on margin improvement that is plausible but not yet visible in a durable way, while the bear case needs a clear break in a business that still generates strong cash and owns leading positions in its categories. The stock is good enough to own, but not cheap enough to chase.
What to Watch Next
- Operating margin above 21.0% — would support moving the rating toward Buy.
- FCF yield above 5.0% — would show cash conversion is improving.
- Net debt/EBITDA near 1.3x — would confirm leverage remains manageable.
- Revenue growth below 3.0% for two quarters — would pressure the valuation case.
- FCF margin below 15.0% — would weaken support for the dividend and buybacks.
What’s your take? I rated Colgate-Palmolive (CL) HOLD above — but the goal here is to get this right, not just to publish an opinion. What would you add to this analysis, or which risk or catalyst do you think I’m under- or over-weighting? Tell me in the comments.
Sources
- SEC 10-K Annual Report — filed 2026-02-23
- SEC 8-K Filing (2026-05-13)
- SEC 8-K Filing (2026-05-01)
- SEC 8-K Filing (2026-04-09)
- SEC 8-K Filing (2026-03-17)
- SEC 8-K Filing (2026-03-12)
- SEC 8-K Filing (2026-01-30)
- SEC Form 4 Insider Transaction (2026-05-18)
- SEC Form 4 Insider Transaction (2026-05-13)
- SEC Form 4 Insider Transaction (2026-05-13)
- SEC 10-K Annual Report — FY2026
- SEC 10-K Annual Report — FY2025
- SEC 10-K Annual Report — FY2024
- SEC 10-K Annual Report — FY2023
- SEC 10-K Annual Report — FY2022
Data sourced from Yahoo Finance and SEC EDGAR. Not investment advice.
Leave a Comment