
| Company | Oct 25 | Nov 25 | Dec 25 | Jan 26 | Feb 26 | Mar 26 | Apr 26 | May 26 | Jun 26 | Jul 26 | Aug 26 | Sep 26 | 12-Mo |
|---|---|---|---|---|---|---|---|---|---|---|---|---|---|
| UMAC | -1% | -42% | +46% | +9% | -1% | -9% | +18% | +118% | -30% | -5% | +12% | +3% | +62% |
| ONDS | -17% | +23% | +24% | +6% | -3% | -10% | +11% | +32% | -38% | -9% | +2% | -4% | -5% |
| RCAT | +9% | -34% | +7% | +70% | -14% | +12% | -10% | +24% | -27% | -29% | +14% | -25% | -38% |
| ZENA | -4% | -26% | -6% | +6% | -22% | -13% | -1% | -28% | -8% | -15% | +37% | -25% | -73% |
| OUST | +23% | -31% | -6% | -4% | -9% | -3% | +47% | +71% | +36% | -38% | -12% | +17% | +49% |
| AVAV | +17% | -24% | -13% | +15% | -9% | -27% | +7% | +6% | -20% | -10% | -1% | -4% | -55% |
Source: Yahoo Finance monthly adjusted close.
Quick Thesis
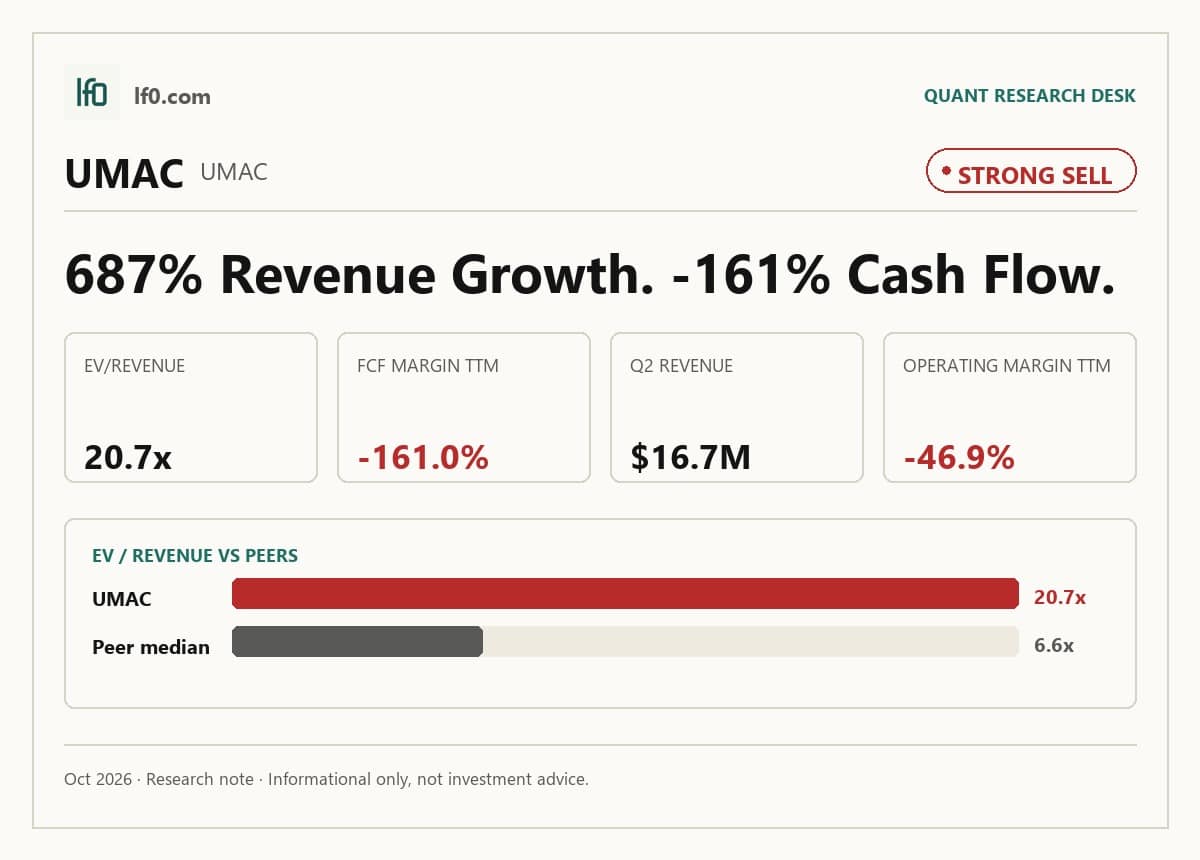
- Rated strong sell — valuation assumes a clean operating turn that the numbers do not yet support.
- Biggest strength: domestic drone supply-chain positioning, with $16.7M quarterly revenue in Q2 2026.
- Biggest risk: cash burn remains heavy, with -$56.2M operating cash flow TTM and -$51.3M levered free cash flow TTM.
- Valuation is rich at 20.7x EV/revenue and 30.5x price/sales.
- I would turn more constructive only if operating cash flow turns positive and free cash flow becomes positive.
Executive Summary
Rating: STRONG SELL | UMAC
Measured from adjusted close on 2026-10-14 to 2026-10-14. Sell ratings are correct when the stock falls; Hold is tracked as a +/-10% range. Daily-close data, not intraday. Calls are tracked for 182 days from publication, then frozen as a final record.
I would put my rating as a strong sell because Unusual Machines is priced for a clean operating turn that is not yet visible in the numbers. Revenue reached $16.7M in Q2 2026, but the business still posted -$56.2M of operating cash flow TTM and -$51.3M of levered free cash flow TTM, so growth is still being funded by cash burn rather than self-financing scale. The domestic drone supply chain is a real strategic asset, yet the stock already trades at 20.7x EV/revenue and 30.5x price/sales, which leaves little room for execution misses. I would become more constructive only if operating cash flow turns positive and free cash flow moves into positive territory, because that would show the revenue surge is finally converting into cash.
Company Profile
Unusual Machines, Inc. is a Nevada corporation organized in 2024 and a successor to a Puerto Rican corporation formed in 2019. It designs, manufactures, and sells drone components and complete drones through business-to-business channels and a curated retail platform, with enterprise customers becoming the primary revenue driver in 2025. The company is listed on Nasdaq under UMAC.
Its core business is Group 1 unmanned aerial systems, the small-drone segment used for first-person view, tactical, mapping, and recreational applications. Unusual Machines operates five facilities in the Orlando area as of March 2026, including its corporate office, and it is expanding domestic production in a deliberate way to add new component categories such as batteries and cameras as demand supports it. In September 2025, it acquired Rotor Lab Pty. Ltd., an Australian drone company, to broaden its manufacturing base and product set.
The company is focused on U.S.-made, National Defense Authorization Act-compliant components and has six Blue Framework approved components or variants since August 2024.
Economic Moat
Business Model
The domestic supply chain for National Defense Authorization Act-compliant drone components is the clearest structural edge here, and in my view it is the one advantage a well-funded competitor would struggle to replicate within 3 years. According to their SEC filings, Unusual Machines has already developed six components and variants that have been approved and added to the Blue Framework since August 2024, which matters because defense and federal buyers can only source from parts that clear the Defense Contract Management Agency audit process for supply chain and cybersecurity risk. The company also has brand recognition in Unusual Machines, Rotor Riot, and Fat Shark, especially in first-person view and small military niches, but I see that as secondary to the domestic manufacturing and compliance layer.
Competition is still intense, with DJI dominant in consumer and prosumer drones and T-Motor, Orqa, ModalAI, and ARK Electronics active in components. The investment case therefore depends on whether Unusual Machines can keep turning compliance into repeatable procurement access rather than just a one-time certification win.
Business & Operating Risks
The most material risk is inventory and customer concentration, because the company has already ordered substantial inventory before receipt of purchase orders and the largest disclosed order, the $12.8M Strategic Logix purchase order for the Rapid Reconfigurable Systems Line, has no formal contract backstopping it. That combination means a miss on expected follow-on orders could force inventory write-offs and margin pressure, and the filing is explicit that if anticipated orders do not arrive, inventory may become obsolete and any such write-off could be material.
A second company-specific risk is supplier dependence, especially the lack of long-term binding contracts with a select group of specialized suppliers and the Blue UAS source that comes from a privately held U.S. manufacturer with no supply agreement requiring the manufacturer to produce a specified volume per year. That leaves delivery timing, pricing, and future availability exposed. The third risk is manufacturing scale-up itself: the company has opened two manufacturing facilities and a fulfillment facility, plans a battery pack assembly and drone camera facility in late 2026, and says cost overruns on fixed-price orders could create operating losses.
Taken together, these risks do threaten the moat, but they do not erase it. They mainly test whether the compliance advantage can be converted into repeat orders fast enough to absorb inventory and scale-up risk.
Management Discussion & Analysis
Management is signaling a capital-light but highly dilutive growth plan. The company entered a Capital on Demand Sales Agreement on August 28, 2025 that allows up to $300M of equity issuance, and it already sold 4.7M shares in October 2025 for $72.1M of gross proceeds. That protects liquidity, but it also means existing holders should expect dilution if the business keeps scaling.
The operating plan is still aggressive, because management expects revenue to continue to grow quarterly in 2026 while gross margin is expected to decline in the first two quarters before improving in the second half as staff are trained, production shifts to multiple lines, and a highly automated motor line comes online. I read that as a real execution bridge, not a finished margin story. The company is also spending ahead of demand with $17.5M of investments in three private drone-related companies, which looks more like strategic option value than near-term earnings support.
Management is actively responding to the risks above, but not eliminating them. The equity facility and inventory build address supply and working-capital needs, while the margin guidance shows management knows the scale-up will be uneven; the unresolved issue is whether the order book grows fast enough to justify that pace.
Recent Events
The most significant development I see is the May 7, 2026 merger agreement to acquire Upgrade Energy LLC through a newly formed subsidiary for 1.8 million shares, $1M cash at closing, and up to $26M of earn-out tied to a $10M revenue target over the next 2 years. In my view, that strengthens the growth thesis because it adds a second operating platform and gives management a clear revenue hurdle, but the earn-out also tells me the deal is still contingent on execution, not a finished scale-up.
The May 5, 2026 purchase orders for about $75M of U.S. inventory are the other material signal. That looks like a deliberate supply-chain build, which should support product availability and reduce the risk of stockouts across the drone component line. I read that as a positive for competitive position because it suggests management is trying to secure input access before demand or procurement conditions tighten.
The May 21, 2026 amendment to the CEO management services agreement, extending the term to December 31, 2026 and lifting the annual fee to $350,000, is a smaller but still relevant governance event. It keeps leadership in place through the next phase of integration and sourcing, so the recent 8-Ks collectively strengthen the investment case by pairing supply assurance with a growth acquisition rather than signaling disruption.
Financial Analysis
Growth
UMAC — Financial Growth (Quarterly, USD Mil)
| Metric | 2025-03-31 | 2025-06-30 | 2025-09-30 | 2025-12-31 | 2026-03-31 | 2026-06-30 |
|---|---|---|---|---|---|---|
| REVENUE (USD Mil) | — | 2.1 | 2.1 | 4.9 | 8.1 | 16.7 |
| EBIT (USD Mil) | — | -7 | 1.6 | -10.6 | 10.3 | -7.8 |
| EBITDA (USD Mil) | — | -6.9 | 1.6 | -10.5 | 10.3 | -7.7 |
| NET INCOME (USD Mil) | — | -7 | 1.6 | -10.6 | 10.3 | -7.8 |
| DILUTED EPS | -0.2 | -0.3 | 0.1 | — | 0.2 | -0.2 |
Source: Yahoo Finance — Quarterly Financial Statements
Revenue accelerated from $2.1M in Q2 2025 to $2.1M in Q3 2025, then to $4.9M in Q4 2025 and $8.1M in Q1 2026 before reaching $16.7M in Q2 2026. The cleanest year-over-year read is Q2 2026 revenue of $16.7M versus $2.1M in Q2 2025, up 687.3%, while the step-up from Q1 to Q2 suggests order timing is still a major driver.
EBITDA moved faster than revenue in Q1 2026, with $10.3M EBITDA on $8.1M revenue, but swung back to -$7.7M in Q2 2026. That volatility tells me the business is still too early for a stable run-rate read, and the growth signal is bullish only if it starts to repeat across several quarters rather than one strong print.
Profitability
UMAC — Profitability (TTM)
| Metric | TTM |
|---|---|
| Operating Margin (TTM) | -46.8% |
| Net Margin (TTM) | -20.3% |
| Return on Assets (TTM) | -8.3% |
| Return on Equity (TTM) | -2.9% |
| Gross Margin (TTM) | 34.8% |
| EBITDA Margin (TTM) | -92.8% |
Source: Yahoo Finance — Trailing Twelve Months (TTM)
Gross margin was 34.8% TTM, but operating margin was -46.8% TTM and EBITDA margin was -92.8% TTM, so the business is still far from operating leverage. The 81.7-point gap between gross and operating margin shows that selling costs, overhead, and scale inefficiency are overwhelming the product margin.
Net margin was -20.3% TTM, while ROA was -8.27% and ROE was -2.94%, so capital is still earning negative returns rather than compounding value. The smaller gap between ROA and ROE suggests leverage is not the main driver of the return profile; the core issue is weak operating economics.
Valuation
UMAC — Valuation Multiples
| Metric | Value |
|---|---|
| Current Share Price (USD) | 19.4 |
| Market Cap (USD Mil) | 971 |
| Enterprise Value (USD Mil) | 658 |
| Forward P/E | -60.1 |
| EV/Revenue | 20.7 |
| EV/EBITDA | -22.3 |
| Analyst Target Price – Low (USD) | 30 |
| Analyst Target Price – Mean (USD) | 39 |
| Analyst Target Price – High (USD) | 45 |
Source: Yahoo Finance
Unusual Machines trades on EV/revenue because earnings are still deeply negative. EV/revenue is 20.7x, which means the market is paying $20.7 of enterprise value for each $1 of trailing revenue and is implicitly assuming a sharp move toward scale and positive operating leverage rather than the current TTM operating loss profile. Price/sales is 30.5x at a current share price of $19.4, so investors are paying a rich multiple of sales even before the company proves durable profitability.
Forward P/E is -60.1x and EV/EBITDA is -22.3x, both unusable as cheapness signals because forward EPS is -$0.323 and EBITDA is negative. FCF yield is -5.28%, which tells you the business is still consuming cash rather than returning it. Price/book is 2.5x, while book value per share is $7.768 and cash per share is $6.333, so the stock trades at about 2.5x book despite a balance sheet that is still mostly cash.
On my read, fair value sits well below the current quote. Using the peer EV/revenue range of 3.4x to 14.3x on UMAC’s $31.9M of revenue gives an illustrative EV of $108M to $456M, or roughly $2.2 to $8.2 per share after netting $316.4M of cash and $3.2M of debt. That range sits below the $39 analyst mean target and even below the $30 low target, which tells me the sell-side is giving more credit to future execution than I am. I would need to see the revenue base hold up while cash burn narrows before I would accept the current multiple as justified.
Leverage
UMAC — Leverage & Coverage (Quarterly)
| Metric | Value |
|---|---|
| Total Debt/Equity % (mrq) | 0.8 |
| Current Ratio (mrq) | 53.8 |
| Total Debt (mrq, USD Mil) | 3.2 |
| Operating Cash Flow (TTM, USD Mil) | -56.2 |
| Levered Free Cash Flow (TTM, USD Mil) | -51.3 |
| Net Debt/EBITDA (TTM) | 10.6 |
| FCF Margin % (TTM) | -161.0% |
Source: Yahoo Finance — Quarterly Financial Statements
Unusual Machines has $3.156M of total debt against a current ratio of 53.82 and $316.4M of cash, so near-term liquidity is not the issue. The more important signal is cash generation: operating cash flow was -$56.2M TTM, levered free cash flow was -$51.3M TTM, net debt/EBITDA was 10.6x, and FCF margin was -161.0% TTM.
That combination means EBITDA is not converting into cash, which usually points to heavy working capital use, capex, or both. The balance sheet can absorb a short-term shock, but the negative cash burn means that cushion erodes unless operating cash flow turns positive or the company taps the $300M equity facility.
Insider Activity
The insider transaction record I see here is one-sided selling: 14 open-market sales, $8M total, and no open-market purchases across the 2024-11-05 to 2026-06-04 window. The pattern is broad rather than concentrated, with the President, Chief Financial Officer, and a Director all selling, which weakens alignment and suggests insiders are using strength to reduce exposure.
Comparable Analysis
LF0 has published standalone analyses of these peers: Red Cat Holdings (RCAT) (rated Sell).
Growth
| Company | Revenue TTM (USD Mil) | Revenue Growth YoY % | EBITDA TTM (USD Mil) | Diluted EPS TTM |
|---|---|---|---|---|
| UMAC | 31.9 | 687.3% | -29.6 | -0.2 |
| ONDS | 174.1 | 1,235.4% | -180.6 | -0.1 |
| RCAT | 71.5 | 527.2% | -104 | -0.8 |
| ZENA | 27.3 | 316.3% | -58.6 | -1.4 |
| OUST | 204.9 | 55.9% | -58.2 | -0.8 |
| AVAV | 2,002.7 | 5.7% | 218.8 | -4 |
Source: Yahoo Finance
UMAC’s revenue growth was 687.3% TTM on $31.9M of revenue, but that still trails ONDS at 1,235.4% on $174.1M and sits above RCAT at 527.2% on $71.5M, ZENA at 316.3% on $27.3M, OUST at 55.9% on $204.9M, and AVAV at 5.7% on $2B. I read that as a growth premium that is only partly justified, because UMAC’s base is tiny and the business is still loss-making.
Valuation
| Company | Current Share Price (USD) | Forward P/E | EV/Revenue | EV/EBITDA | Forward EPS | Analyst Target Price – Low | Analyst Target Price – Mean | Analyst Target Price – High | # Analyst Opinions |
|---|---|---|---|---|---|---|---|---|---|
| UMAC | 19.4 | -60.1 | 20.7 | -22.3 | -0.3 | 30 | 39 | 45 | 8 |
| ONDS | 6.7 | -335.5 | 14.3 | -13.8 | 0 | 13 | 18.9 | 25 | 10 |
| RCAT | 5.2 | -9.3 | 6.7 | -4.6 | -0.6 | 9 | 16.5 | 25 | 8 |
| ZENA | 1.1 | -2.2 | 6.5 | -3 | -0.5 | 4 | 4.5 | 5 | 2 |
| OUST | 35.3 | -282.6 | 11.2 | -39.5 | -0.1 | 52 | 59.4 | 75 | 5 |
| AVAV | 127.1 | 28.7 | 3.3 | 30.7 | 4.4 | 148.6 | 216.5 | 315 | 21 |
Source: Yahoo Finance
UMAC trades at 20.7x EV/revenue and 30.5x price/sales on a negative FCF yield of -5.28% TTM, versus ONDS at 14.3x and 22.4x, RCAT at 6.7x and 11.1x, ZENA at 6.5x and 7.9x, OUST at 11.2x and 12.4x, and AVAX at 3.3x and 3.2x. Forward EPS is -$0.323 for UMAC versus 0 for ONDS, -$0.6 for RCAT, -$0.5 for ZENA, -$0.1 for OUST, and $4.4 for AVAV, so UMAC is paying a richer multiple than peers without the earnings visibility that would normally justify it.
Using the peer EV/revenue range of 3.3x to 14.3x on UMAC’s $31.9M revenue gives an illustrative EV of $108M to $456M, or roughly $2.2 to $8.2 per share after netting $316.4M of cash and $3.2M of debt. That is well below the $19.44 current share price, and it is also below the $39 analyst mean target, which tells me the market and the consensus are both leaning harder on future execution than the current cash-flow profile supports.
Profitability
| Company | Operating Margin (TTM) | Net Margin (TTM) | Gross Margin (TTM) | EBITDA Margin (TTM) |
|---|---|---|---|---|
| UMAC | -46.8% | -20.3% | 34.8% | -92.8% |
| ONDS | -166.3% | 96.2% | 43.7% | -103.7% |
| RCAT | -191.4% | -136.3% | 9.8% | -145.3% |
| ZENA | -234.7% | 0.0% | 100.0% | -215.0% |
| OUST | -46.6% | -26.0% | 46.6% | -28.4% |
| AVAV | -2.3% | -10.1% | 26.5% | 10.9% |
Source: Yahoo Finance
UMAC’s gross margin is 34.8%, below ONDS at 43.7%, OUST at 46.6%, and AVAV at 26.5%, while its operating margin is -46.8% and EBITDA margin is -92.8%. Because UMAC’s gross margin is not far from the better peers but operating and EBITDA margins are far weaker, the problem looks more like scale and overhead absorption than pure cost of revenue.
Leverage
| Company | Total Debt/Equity % (mrq) | Current Ratio (mrq) | Total Debt (mrq, USD Mil) | Operating Cash Flow TTM (USD Mil) | Free Cash Flow TTM (USD Mil) | Net Debt/EBITDA (TTM) | FCF Margin % (TTM) |
|---|---|---|---|---|---|---|---|
| UMAC | 0.8 | 53.8 | 3.2 | -56.2 | -51.3 | 10.6 | -161.0% |
| ONDS | 2.6 | 9.8 | 41.1 | -161.1 | -69.1 | 7.4 | -39.7% |
| RCAT | 3.2 | 14.9 | 14.9 | -139.1 | -117.1 | 3 | -163.6% |
| ZENA | 32.8 | 1.7 | 30 | -68.1 | -43.8 | 0.1 | -160.5% |
| OUST | 4.4 | 4.2 | 16.4 | -53.8 | -57.4 | 4.2 | -28.0% |
| AVAV | 19.4 | 4.3 | 850.8 | 58.8 | -25.9 | 1.2 | -1.3% |
Source: Yahoo Finance
UMAC’s debt/equity is only 0.813% and debt is just $3.2M, while cash is $316.4M, or $6.333 per share, and the current ratio is 53.82x. Yet net debt/EBITDA is 10.6x and FCF margin is -161.0%, which is worse than OUST at 4.2x and -28.0%, ONDS at 7.4x and -39.7%, and RCAT at 3.0x and -163.6%, so the balance sheet is cash-rich but the operating cash drain still matters because it limits how long that cash can support the equity story.
The leverage gap also helps explain part of the valuation gap: AVAV and OUST both trade on much lower EV/revenue multiples because they have either stronger cash generation or a more credible path to it, while UMAC still needs the market to underwrite both growth and financing at the same time.
Conclusion
I would put my rating as a strong sell because the stock is already discounting a much cleaner operating inflection than the current numbers support. EV/revenue is 20.7x on $31.9M of TTM revenue, while forward EPS is still -$0.323 and levered free cash flow is -$51.3M TTM, so the market is paying up before the business has shown durable earnings conversion.
The most credible bull case is that enterprise and defense demand keeps compounding while the domestic supply chain advantage turns into repeat orders rather than one-off certifications. If revenue can hold above $16.7M per quarter and gross margin stays near the 34.8% TTM level while operating losses narrow, I would become more constructive because that would imply the company is absorbing fixed costs and the current cash balance of $316.4M can fund the scale-up without immediate financing pressure. A further step-up in Blue Framework approvals and follow-on orders from the $12.8M Strategic Logix purchase order would strengthen that case.
The bear case is more immediate: inventory was built ahead of purchase orders, the largest disclosed order has no formal contract backstop, and the company is still burning -$56.2M of operating cash over the last 12 months. If quarterly revenue slips back toward the $8.1M level seen in Q1 2026, or if gross margin falls below the 34.8% TTM level as the company absorbs manufacturing and tariff pressure, then the current valuation would look even harder to defend because the cash burn would extend the timeline to profitability and raise the odds of dilution from the $300M equity facility.
Weighing both sides, I lean to the bear case because the stock already reflects a lot of faith in execution while the operating proof is still uneven. The domestic drone supply chain is a real asset, but until revenue and cash flow show a steadier pattern, I think the market is paying for a future that has not yet been earned.
What to Watch Next
- Quarterly revenue above $16.7M — would support the case that demand is becoming repeatable.
- Gross margin near 34.8% — would show the scale-up is not destroying product economics.
- Operating cash flow turning positive — would be the clearest sign that growth is self-funding.
- Levered free cash flow turning positive — would reduce dilution risk from the equity facility.
- Follow-on orders tied to Blue Framework approvals — would confirm the compliance moat is producing repeat business.
What’s your take? I rated Unusual Machines (UMAC) STRONG SELL above — but the goal here is to get this right, not just to publish an opinion. What would you add to this analysis, or which risk or catalyst do you think I’m under- or over-weighting? Tell me in the comments.
Sources
- SEC 10-K Annual Report — filed 2026-03-12
- SEC 8-K Filing (2026-05-29)
- SEC 8-K Filing (2026-05-26)
- SEC 8-K Filing (2026-05-14)
- SEC 8-K Filing (2026-05-11)
- SEC 8-K Filing (2026-05-05)
- SEC 8-K Filing (2026-04-21)
- SEC Form 4 Insider Transaction (2026-06-05)
- SEC Form 4 Insider Transaction (2026-06-02)
- SEC Form 4 Insider Transaction (2026-05-29)
- SEC 10-K Annual Report — FY2026
- SEC 10-K Annual Report — FY2025
- SEC 10-K Annual Report — FY2024
Data sourced from Yahoo Finance and SEC EDGAR. Not investment advice.
Leave a Comment