
| Company | Oct 25 | Nov 25 | Dec 25 | Jan 26 | Feb 26 | Mar 26 | Apr 26 | May 26 | Jun 26 | Jul 26 | Aug 26 | Sep 26 | 12-Mo |
|---|---|---|---|---|---|---|---|---|---|---|---|---|---|
| OTF | +4% | -3% | +8% | -8% | -16% | +15% | -8% | -2% | -3% | -4% | +18% | -13% | -19% |
| TBLD | +2% | -2% | +3% | +5% | +6% | -5% | +4% | +5% | -2% | -0% | +2% | -8% | +8% |
| PSHZF | +2% | +3% | +1% | -4% | -7% | -8% | +4% | -2% | -11% | +6% | +3% | -9% | -21% |
| CEF | +2% | +11% | +11% | +8% | +14% | -15% | -0% | +0% | -16% | -1% | +14% | -9% | +13% |
| EARN | -5% | +8% | -1% | +5% | -9% | -8% | +8% | +2% | -5% | -0% | +3% | -6% | -9% |
| BANX | -3% | +4% | +3% | -2% | -6% | -3% | +3% | +2% | -0% | +5% | +3% | -4% | +1% |
Source: Yahoo Finance monthly adjusted close.
Quick Thesis
- Rated Hold — cash generation is solid, but liquidity is too tight.
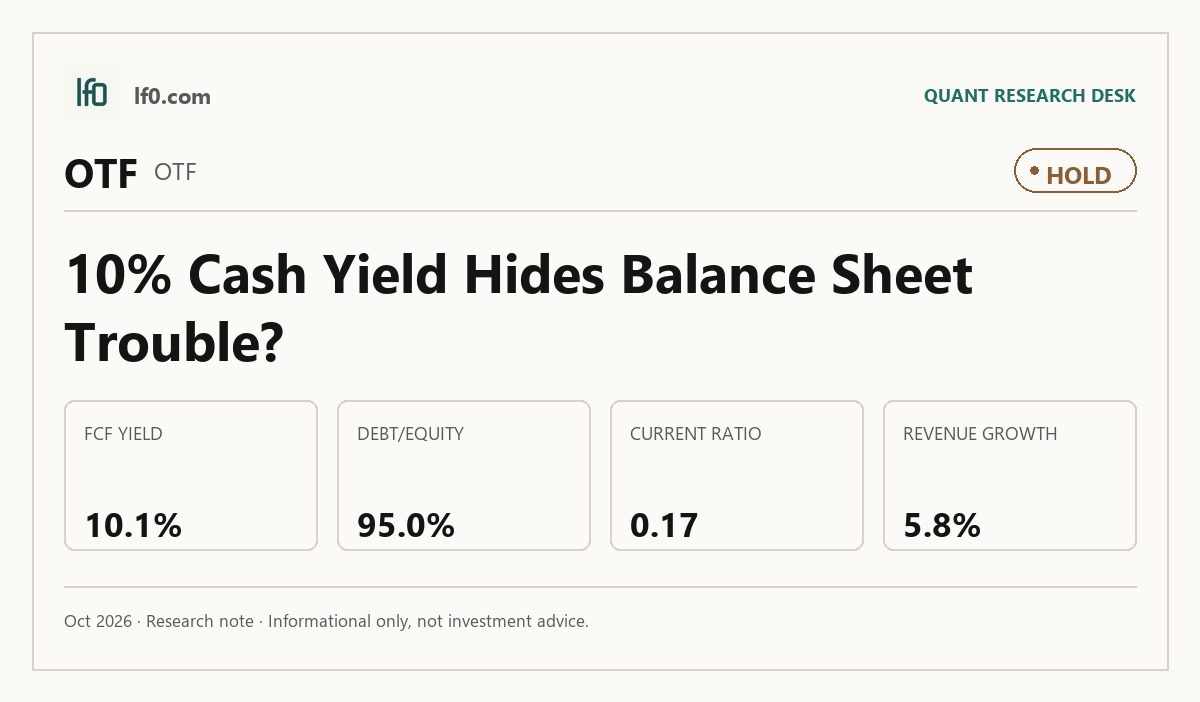
- TTM free cash flow yield is 10.1%, the clearest support for the thesis.
- The main risk is 94.9% debt/equity and a 0.17 current ratio.
- Valuation is mixed: 8.6x EV/revenue is not cheap, but 6.7x forward P/E is not demanding.
- I would turn more constructive if current ratio rises above 0.3, roughly doubling liquidity.
Executive Summary
Rating: HOLD | OTF
Measured from adjusted close on 2026-10-07 to 2026-10-07. Sell ratings are correct when the stock falls; Hold is tracked as a +/-10% range. Daily-close data, not intraday. Calls are tracked for 182 days from publication, then frozen as a final record.
I would put my rating as a Hold because Blue Owl Technology Finance Corp. still throws off a 10.1% free cash flow yield, but the balance sheet is too tight for me to call it a Buy. The company’s 94.9% debt/equity ratio and 0.17 current ratio tell me the cash return is real, yet the liquidity cushion is thin and refinancing risk remains part of the story.
The key tension is that the platform has access to Blue Owl’s co-investment and securitized funding channels, which supports asset growth, while the same structure leaves shareholders exposed to a stretched capital stack. I would become more constructive if current ratio moved above 0.3, roughly doubling liquidity, and if quarterly revenue growth stayed above 10.0% for two straight quarters.
Company Profile
Blue Owl Technology Finance Corp. is a business development company that originates and holds senior secured loans and other debt investments to technology and technology-enabled companies. It earns most of its revenue from interest income, fee income, and gains or losses on investments, and it is externally managed by Blue Owl Technology Credit Advisors LLC.
The company was formed in 2018 as Owl Rock Technology Finance Corp. and later adopted the Blue Owl name after the platform rebrand. Its portfolio is funded through Blue Owl’s lending platform and related financing vehicles, including Athena CLO II, Athena CLO IV, and Athena CLO V, which are collateralized loan obligation structures used to fund and recycle loan assets.
Economic Moat
Business Model
The strongest part of the moat is access to co-investment opportunities through Blue Owl’s affiliated lending platform. According to their SEC filings, the adviser and its affiliates can allocate investments across Blue Owl credit clients, and the company relies on exemptive relief that lets it co-invest with affiliates on the same terms and at the same time.
I feel that this is hard for a well-funded outsider to replicate quickly because it depends on an established advisory complex, a board-approved allocation policy, and regulatory permissions under the Investment Company Act of 1940. The non-exclusive Blue Owl name license is a secondary support, but it is branding rather than a true competitive barrier.
Business & Operating Risks
The most material disclosed risk is adviser conflict and opportunity allocation, because the same team that runs Blue Owl Technology Finance Corp. also manages a much larger pool of related accounts and can steer deals away from this vehicle. The filing says the Technology Lending Investment Committee managed 5 registered investment companies and BDCs with $77,056 of assets for Douglas I. Ostrover and Marc S. Lipschultz, plus 40 to 44 other pooled vehicles for those managers, while the company itself had only one seat in that broader platform.
That means deal flow can be diluted before it reaches shareholders, and the risk is more about access than about the core lending model itself. In my view, the conflict does not break the moat, but it does cap how much of Blue Owl’s platform advantage flows through to this vehicle.
Management Discussion & Analysis
Management is responding to the funding and access risks by broadening financing channels and extending maturities, which is the right answer for a business that depends on platform access. The company is not solving the adviser-conflict issue, but it is reducing balance-sheet pressure and preserving flexibility.
The June 5, 2026 issuance of $500M of 6.5% notes due 2029 is the clearest example. It pushes out near-term refinancing risk, although it also raises the all-in cost of capital, so the benefit is stability rather than cheaper funding.
Recent Events
The most important recent event was the May 21, 2026 Loan Financing and Servicing Agreement for Athena Funding III LLC, which added a new secured borrowing channel with an initial $150M capacity, expandable to $250M, and a 2031 maturity. I see that as constructive because it gives the company another asset-backed funding source and supports portfolio recycling without forcing common equity dilution.
The February 18, 2026 and May 6, 2026 8-Ks were routine earnings releases, and the April 1, 2026 filing simply set the Q1 2026 reporting date. Taken together, the recent disclosures strengthen the platform’s funding flexibility, but they do not yet show that the adviser-conflict issue has been solved.
Financial Analysis
Growth
OTF — Financial Growth (Quarterly, USD Mil)
| Metric | 2025-03-31 | 2025-06-30 | 2025-12-31 | 2026-03-31 | 2026-06-30 |
|---|---|---|---|---|---|
| REVENUE (USD Mil) | 90.9 | 215.4 | 223.8 | -204.4 | 169.3 |
| NET INCOME (USD Mil) | 78.1 | 201.5 | 205.8 | -219.9 | 154.2 |
| DILUTED EPS | 0.3 | 0.4 | — | -0.5 | 0.3 |
Source: Yahoo Finance — Quarterly Financial Statements
Revenue was $215.4M in Q2 2025, rose to $223.8M in Q4 2025, then swung to -$204.4M in Q1 2026 before recovering to $169.3M in Q2 2026. I do not read that as a clean growth path; the negative quarter is an outlier that makes the series look more volatile than durable.
Net income followed the same pattern, moving from $201.5M in Q4 2025 to -$219.9M in Q1 2026 and back to $154.2M in Q2 2026. That kind of swing tells me the earnings line is still too choppy to support a premium multiple on growth alone.
Profitability
OTF — Profitability (TTM)
| Metric | TTM |
|---|---|
| Operating Margin (TTM) | 73.3% |
| Net Margin (TTM) | 28.7% |
| Return on Assets (TTM) | 4.3% |
| Return on Equity (TTM) | 4.8% |
| Gross Margin (TTM) | 100.0% |
Source: Yahoo Finance — Trailing Twelve Months (TTM)
TTM operating margin is 73.3%, net margin is 28.7%, gross margin is 100.0%, ROA is 4.3%, and ROE is 4.8%. The gap between gross and operating margin shows the business converts revenue into gross profit cleanly, but a large part of that profit is lost below the operating line.
The small spread between ROE and ROA tells me leverage is not doing much of the work here. That makes returns look more stable, but it also means the company is not yet generating especially high capital efficiency.
Valuation
OTF — Valuation Multiples
| Metric | Value |
|---|---|
| Current Share Price (USD) | 9.2 |
| Market Cap (USD Mil) | 4,199 |
| Enterprise Value (USD Mil) | 11,233 |
| Trailing P/E | 11.5 |
| Forward P/E | 6.7 |
| Price/Sales (TTM) | 3.2 |
| Price/Book (mrq) | 0.6 |
| EV/Revenue | 8.6 |
| EV/EBITDA | — |
| FCF Yield % (TTM) | 10.1% |
| Forward EPS (USD) | 1.4 |
| Analyst Target Price – Low (USD) | 11 |
| Analyst Target Price – Mean (USD) | 13.6 |
| Analyst Target Price – High (USD) | 17 |
| # Analyst Opinions | 9 |
Source: Yahoo Finance
OTF trades at 8.6x EV/revenue and 3.2x price/sales, which is the cleanest anchor because the company is still producing positive earnings but the market is clearly valuing the business on revenue durability as much as on earnings. Trailing P/E is 11.5x and forward P/E is 6.7x, with forward EPS of 1.4, so the market is already discounting a sharp step-up in earnings power.
Price/book is 0.6x against book value per share of $16.48, which tells me the market is skeptical about how much of that book value can be monetized. On my read, fair value sits in a range of roughly $8.5-$10.5 per share, which is below the $13.6 analyst mean and inside the $11–$17 analyst range only at the low end; that gap reflects my heavier weight on leverage and liquidity than the consensus appears to assign.
The implied EPS range is roughly $1.2-$1.5, anchored around the current 1.4 forward EPS and consistent with the company’s margin profile. That is not expensive versus peers on a raw earnings basis, but it is also not enough to offset the balance-sheet risk unless cash conversion stays strong.
FCF yield is 10.1%, and that is the most supportive valuation signal because it says the stock is backed by real cash generation rather than accounting earnings alone. The valuation case is fair, not cheap enough for a higher rating on its own.
Leverage
OTF — Leverage & Coverage (Quarterly)
| Metric | Value |
|---|---|
| Total Debt/Equity % (mrq) | 94.9 |
| Current Ratio (mrq) | 0.2 |
| Total Debt (mrq, USD Mil) | 7,157.5 |
| Operating Cash Flow (TTM, USD Mil) | -1,562 |
| Levered Free Cash Flow (TTM, USD Mil) | 423.2 |
| FCF Margin % (TTM) | 32.4% |
Source: Yahoo Finance — Quarterly Financial Statements
OTF’s leverage profile is the main reason I stay at Hold. Total debt/equity is 94.9%, current ratio is 0.17, and total debt is $7.2B, which leaves very little near-term liquidity cushion.
Operating cash flow was -$1.6B TTM, while levered free cash flow was $423.2M and FCF margin was 32.4%. That mix tells me the business is still converting into cash at the levered level, but the operating line is not clean enough to make the debt stack feel comfortable.
Insider Activity
The insider transaction record is one-sided buying: 8 open-market purchases and 0 open-market sales across 9 filings parsed from 2025-03-24 to 2026-05-22. Chris Temple, Melissa Weiler, Eric A. Kaye, and President Erik Bissonnette all bought shares, which suggests the buying is broad rather than isolated.
I view that as a positive signal, but not a substitute for cleaner liquidity. Insider buying helps the thesis at the margin; it does not change the fact that the balance sheet is still the key constraint.
Comparable Analysis
Growth
| Company | Revenue TTM (USD Mil) | Revenue Growth YoY % | Diluted EPS TTM |
|---|---|---|---|
| OTF | 1,307.1 | 5.8% | 0.8 |
| TBLD | — | — | 4.4 |
| PSHZF | -837.6 | — | 12.2 |
| CEF | — | — | — |
| EARN | 41.6 | -19.3% | -1 |
| BANX | 26.5 | -0.2% | 1.1 |
Source: Yahoo Finance
OTF’s revenue growth was 5.8% YoY on $1.3B of TTM revenue, which is better than EARN’s -19.3% and BANX’s -0.2%, while TBLD and CEF do not provide comparable growth data here. The important point is that OTF is the only peer in this set with both positive top-line growth and scale, so it deserves some premium to the shrinking names, but not a large one.
Valuation
| Company | Current Share Price (USD) | Trailing P/E | Forward P/E | EV/Revenue | EV/EBITDA | Price/Sales (TTM) | Price/Book (mrq) | Market Cap (USD Mil) | Enterprise Value (USD Mil) | Beta (5Y Monthly) | FCF Yield % (TTM) | Forward EPS | Analyst Target Price – Low | Analyst Target Price – Mean | Analyst Target Price – High | # Analyst Opinions |
|---|---|---|---|---|---|---|---|---|---|---|---|---|---|---|---|---|
| OTF | 9.2 | 11.5 | 6.7 | 8.6 | — | 3.2 | 0.6 | 4,199 | 11,233 | — | 10.1% | 1.4 | 11 | 13.6 | 17 | 9 |
| TBLD | 20.3 | 4.6 | — | — | — | — | — | 651 | — | — | — | — | — | — | — | — |
| PSHZF | 49.5 | 4 | — | 5.2 | — | — | 0.7 | — | -4,322 | 0.53 | — | — | — | — | — | — |
| CEF | 40.7 | 3.7 | — | — | — | — | 1 | 7,139 | — | — | — | — | — | — | — | — |
| EARN | 3.5 | — | 3.7 | 7.7 | — | 3.3 | 0.8 | 138 | 319 | 1.30 | — | 0.9 | 5 | 5 | 5 | 1 |
| BANX | 19.9 | 18.6 | 8.8 | 8.8 | — | 7.3 | 0.9 | 193 | 232 | 0.29 | 7.0% | 2.3 | — | — | — | — |
Source: Yahoo Finance
OTF’s 10.1% FCF yield is the cleanest valuation anchor in the group, ahead of BANX’s 7.0% and much stronger than EARN’s missing yield disclosure. OTF also trades at 8.6x EV/revenue, 11.5x trailing P/E, and 6.7x forward P/E, versus BANX at 8.8x forward P/E and 7.3x price/sales, so OTF is not obviously cheap on revenue but is cheaper on earnings power and cash generation.
Using BANX’s 8.8x EV/revenue as the top peer multiple and OTF’s $1.3B revenue implies an illustrative EV near $11.5B, or roughly $8.5 per share after netting debt and cash, which is below the current $9.2. That is why I do not see a rerating case yet, even though the company’s cash yield is respectable.
Profitability
| Company | Operating Margin (TTM) | Net Margin (TTM) | Return on Assets (TTM) | Return on Equity (TTM) | Gross Margin (TTM) |
|---|---|---|---|---|---|
| OTF | 73.3% | 28.7% | 4.3% | 4.8% | 100.0% |
| TBLD | 0.0% | 0.0% | — | — | — |
| PSHZF | 105.9% | 0.0% | -4.2% | -9.6% | 100.0% |
| CEF | — | — | — | — | — |
| EARN | 68.0% | -81.2% | — | — | 100.0% |
| BANX | 75.1% | 50.8% | 5.3% | 7.4% | 100.0% |
Source: Yahoo Finance
OTF’s 73.3% operating margin and 28.7% net margin are weaker than BANX’s 75.1% operating margin and 50.8% net margin, but far better than EARN’s 68.0% operating margin and -81.2% net margin. The gross margin comparison is less useful because OTF and BANX both show 100.0% gross margin; the real difference is that BANX converts more of its revenue into bottom-line profit.
Leverage
| Company | Total Debt/Equity % (mrq) | Current Ratio (mrq) | Total Debt (mrq, USD Mil) | Operating Cash Flow TTM (USD Mil) | Free Cash Flow TTM (USD Mil) | FCF Margin % (TTM) |
|---|---|---|---|---|---|---|
| OTF | 94.9 | 0.2 | 7,157.5 | -1,562 | 423.2 | 32.4% |
| TBLD | — | — | — | — | — | — |
| PSHZF | 28 | 155.5 | 3,621.5 | -1,236 | -891.6 | 106.4% |
| CEF | — | — | — | — | — | — |
| EARN | 128.8 | 0.1 | 205.8 | — | — | — |
| BANX | 20.1 | 1.4 | 40.8 | -14.6 | 13.6 | 51.2% |
Source: Yahoo Finance
OTF’s 94.9% debt/equity is much higher than BANX’s 20.1% and sits alongside a 0.17 current ratio, which is far tighter than BANX’s 1.4. OTF’s $423.2M of levered free cash flow is much larger in dollar terms than BANX’s $13.6M, so the leverage profile looks more like financing around a larger asset base than a pure liquidity crisis, but the margin for error is still thin.
Conclusion
The central question is whether OTF’s 10.1% cash yield is enough to offset a 94.9% debt/equity ratio and a 0.17 current ratio. My answer is no, at least not yet: the company is generating cash, but the balance sheet is still too tight for me to treat that cash as fully durable.
I would raise my rating more toward a Buy if operating cash flow turns positive and stays there for two straight quarters, because that would show the current cash conversion gap is closing rather than being bridged by financing. I would also want quarterly revenue growth to hold above 10.0% for two consecutive quarters, since that would show the platform can grow without leaning harder on leverage. On the downside, I would move from Hold to Sell if the current ratio stays below 0.5 for another quarter and operating cash flow remains negative, because that would mean the debt load is still outrunning internal cash generation.
The insider buying and the new funding channels are real positives, and they make me think the platform is not under immediate stress. Even so, I am staying at Hold because the next leg of the thesis depends on cleaner liquidity, not just on a good cash yield.
What to Watch Next
- Current ratio above 0.3 — would show liquidity is improving.
- Operating cash flow turning positive for two straight quarters — would support a higher rating.
- Quarterly revenue growth above 10.0% for two quarters — would strengthen the growth case.
- Current ratio staying below 0.5 — would keep refinancing risk elevated.
- Levered free cash flow falling below $423.2M TTM — would weaken dividend support.
What’s your take? I rated Blue Owl Technology Finance (OTF) HOLD above — but the goal here is to get this right, not just to publish an opinion. What would you add to this analysis, or which risk or catalyst do you think I’m under- or over-weighting? Tell me in the comments.
Sources
- SEC 10-K Annual Report — filed 2026-02-18
- SEC 8-K Filing (2026-06-05)
- SEC 8-K Filing (2026-05-28)
- SEC 8-K Filing (2026-05-06)
- SEC 8-K Filing (2026-04-01)
- SEC 8-K Filing (2026-02-18)
- SEC 8-K Filing (2026-01-23)
- SEC Form 4 Insider Transaction (2026-05-27)
- SEC Form 4 Insider Transaction (2026-05-14)
- SEC Form 4 Insider Transaction (2026-05-12)
- SEC 10-K Annual Report — FY2026
- SEC 10-K Annual Report — FY2025
- SEC 10-K Annual Report — FY2024
- SEC 10-K Annual Report — FY2023
- SEC 10-K Annual Report — FY2022
Data sourced from Yahoo Finance and SEC EDGAR. Not investment advice.
Leave a Comment