| Company | Oct 25 | Nov 25 | Dec 25 | Jan 26 | Feb 26 | Mar 26 | Apr 26 | May 26 | Jun 26 | Jul 26 | Aug 26 | Sep 26 | 12-Mo |
|---|---|---|---|---|---|---|---|---|---|---|---|---|---|
| FIX | +17% | +1% | -4% | +22% | +25% | -3% | +33% | -1% | +8% | -13% | -11% | +7% | +101% |
| STRL | +11% | -9% | -11% | +17% | +20% | -5% | +27% | +67% | -2% | -29% | -21% | +5% | +45% |
| EME | +4% | -9% | -1% | +18% | +1% | +2% | +21% | -7% | +0% | -4% | -8% | +3% | +16% |
| MTZ | -4% | +5% | +2% | +11% | +24% | +8% | +22% | -4% | +10% | -37% | -9% | -11% | +0% |
| DY | -1% | +26% | -7% | +8% | +15% | -19% | +22% | +23% | -1% | -21% | -27% | -8% | -8% |
| MYRG | +5% | +3% | -3% | +14% | +8% | +5% | +43% | +15% | +8% | -33% | -13% | +0% | +41% |
Source: Yahoo Finance monthly adjusted close.
Quick Thesis
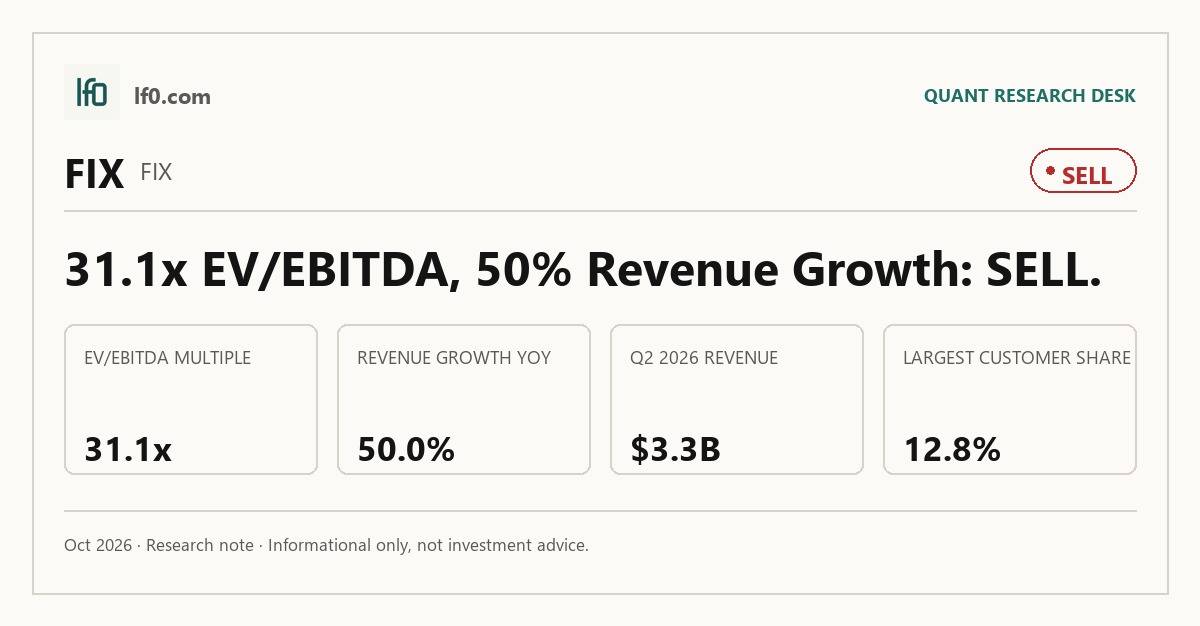
- Rated hold — excellent execution, but the stock already prices it in.
- Strongest financial point: $1.8B of levered free cash flow TTM.
- Main risk: $369.9M of debt and fixed-price project execution risk.
- Valuation is rich versus peers at 31.1x EV/EBITDA and 5.55x EV/revenue.
- I would turn more constructive if operating margin stays near 17.1% while backlog keeps converting.
Executive Summary
Rating: SELL | FIX
Measured from adjusted close on 2026-10-07 to 2026-10-09. Sell ratings are correct when the stock falls; Hold is tracked as a +/-10% range. Daily-close data, not intraday. Calls are tracked for 182 days from publication, then frozen as a final record.
I would put my rating as a Hold because Comfort Systems USA is compounding revenue and earnings quickly, but the shares already discount that strength at 30.2x forward P/E and 31.1x EV/EBITDA. Revenue reached $3.27e+03M in the quarter ended 2026-06-30 and levered free cash flow was $1.8B TTM, so the business is still turning growth into cash rather than just accounting profit. The main risk is execution on a $11.94B backlog, because fixed-price overruns or schedule slippage can hit margins quickly in a labor-heavy contractor. I would turn more constructive if backlog conversion keeps supporting an operating margin near 17.1% while the 2.9% free cash flow yield stays intact.
Company Profile
Comfort Systems USA, Inc. was established in 1997 as a Delaware corporation and is listed on the New York Stock Exchange under FIX. It provides mechanical and electrical contracting, including the installation, maintenance, repair, and replacement of mechanical, electrical, and plumbing systems, through 50 operating units with 190 locations in 142 U.S. cities. Mechanical services were 73.3% of 2025 revenue and electrical services were 26.7%, while 63.2% of revenue came from new construction and 36.8% from renovation, maintenance, and replacement work. The company serves commercial, industrial, and institutional customers, with 2025 revenue concentrated in technology, manufacturing, healthcare, education, and government facilities. As of 2025-12-31, it had 8,427 projects in process with $24.17B of aggregate contract value, and its average project was $2.9M over six to nine months. It employed about 22,700 people at year-end 2025.
Economic Moat
Business Model
The national footprint and project backlog are the most defensible parts of Comfort Systems USA’s model. In its 2026 10-K, the company says it builds, installs, maintains, repairs, and replaces mechanical, electrical, and plumbing systems through 50 operating units with 190 locations in 142 cities across the United States, and it had 8,427 projects in process with an aggregate contract value of approximately $24.17B as of 2025-12-31. I feel that this scale is hard for a well-funded competitor to replicate within 3 years because it combines local execution, national account coverage, and the ability to shift engineering, field, and supervisory labor across locations. The second layer is the design-and-build model, which the filing says is more integrated than plan-and-spec work and is supported by building information modeling, prefabrication, modular and off-site construction, and remote monitoring. That mix matters because it gives Comfort Systems more control over project quality and labor productivity than a bid-only contractor, which supports repeat business in complex commercial, industrial, and institutional jobs.
The business has clearly broadened over the last five years. In 2022, prior filings showed 41 operating units with 169 locations in 126 cities, while today it has 50 operating units with 190 locations in 142 cities, so the company has expanded both its geographic reach and its operating base. The mix also shifted: in 2022, 46.3% of revenue came from new construction and 53.7% from renovation and service, while in 2025 the split was 63.2% new construction and 36.8% renovation, expansion, maintenance, repair, and replacement. That change means the company is more exposed to large project execution today, but it also shows it has gained share in higher-complexity installation work rather than relying only on service. The company also moved deeper into modular and off-site construction through acquisitions and internal investment, and it has built out service growth initiatives and centralized fabrication to raise utilization. I do not see a major C-suite reset in the materials provided, so the key change is operational rather than leadership-driven. On balance, the business looks structurally stronger than five years ago because it is larger, more diversified, and more capable in design, prefabrication, and service, which should support more durable customer relationships and better labor deployment.
Business & Operating Risks
The biggest disclosed risk is execution on fixed-price work in a cyclical market. According to the risk factors in their SEC 10-K, Comfort Systems USA bears the risk of cost overruns on most contracts, and if estimates or assumptions prove inaccurate or inflation lifts labor and material costs, the company can take reduced profits or losses on affected projects. That is not abstract boilerplate: the filing also says backlog as of 2025-12-31 was $11.94B, but backlog can be cancelled or repriced, so a large book of work does not eliminate margin risk. The financial data in this article already shows the mechanism is live, because the business is operating in an environment where labor, materials, and interest costs remain a direct swing factor on project economics. A rough read is that even a small percentage miss on a $11.94B backlog would translate into a very large dollar hit to future revenue and profit, which is why this risk sits at the center of the thesis.
Customer concentration and project timing are the next pressure points. The filing says one customer represented approximately 5.0% of consolidated revenue in 2025, so the loss, delay, or renegotiation of that account would hit revenue and utilization quickly. The same filing warns that the bulk of performance generally occurs late in a construction project’s lifecycle, which means any slowdown in project completion can push revenue and profit out of the period investors are underwriting. That concern is consistent with the article’s financial data, because a late-stage project mix makes reported results more sensitive to schedule slippage than to headline backlog growth.
Labor, subcontractor, and surety constraints are also material. The 10-K says third parties contribute significantly to completion of many projects, and that labor shortages or increased labor costs from third parties could adversely impact results of operations. It also says a significant portion of the business depends on the ability to provide surety bonds, and if bonding capacity tightens, the company could be unable to bid on certain contracts. Those risks are already showing up in the business model the article is covering, because a labor-intensive contractor with a large backlog needs both people and bonding capacity to convert work into cash. In my view, these risks pressure execution more than the moat itself: the national footprint and project depth still look intact, but they can erode the margin advantage if labor or fixed-price discipline slips.
Management Discussion & Analysis
Management is signaling that it wants to keep leaning into growth while preserving balance-sheet flexibility. It lifted the revolving credit facility to $1.10B on 2025-08-27, with $921.0 million still available at 2025-12-31, which tells investors the company wants dry powder for working capital, acquisitions, and bonding rather than a near-term capital raise. That stance is supported by the 2025 acquisition cadence, with Century, Right Way, Feyen Zylstra, and Meisner all added during the year, and by the 0.4M shares repurchased for approximately $217.9M in 2025 at an average price of $489.40 per share, which signals confidence in the stock but also shows capital is being returned even while the business is still buying growth. The operating message is equally clear: management is preparing for high ongoing demand in 2026, especially in industrial and technology work, and the $11.94B backlog at 2025-12-31, up 99.3% from 2024-12-31, supports that view better than the narrative alone. I also see a gap between the tone and the capital-allocation math: the company is using debt capacity and buybacks at the same time, so investors should read this as an aggressive growth-and-return posture, not as balance-sheet repair. The fact that 2025 free cash flow was $1.04B and the company has generated positive free cash flow in each of the last 27 calendar years gives management room to do both, but the repurchase at $489.40 per share means buybacks are not obviously being done at a distressed valuation.
Management’s track record is strong, but not perfect. In 2025’s 10-K, management expected increasing demand to continue and said it would maintain an emphasis on free cash flow; 2025 revenue rose 29.5% to $9.10B and operating cash flow rose to $1.19B, so that call was confirmed by the numbers. Prior filings also stressed that price competition would continue and that labor and supply-chain pressure would persist, and the 2026 filing repeats the same message while saying the company is recognizing these challenges in job planning and pricing, which suggests the issue is recurring rather than temporary. CEO and CFO continuity appears intact across the provided history, with no disclosed leadership change in the current filing or the prior-year context, so there is no governance disruption to flag. Management’s tone has generally matched the trajectory of the business, which has been improving rather than deteriorating, so I would rate management credibility as high.
Recent Events
The most significant development I see is the 2026-02-19 earnings release, which was paired with a quarterly dividend declaration. That combination reinforces the thesis that Comfort Systems USA is still converting project demand into cash and returning part of it to shareholders, so the recent operating model remains intact rather than being stretched by growth.
The 2026-05-01 investor presentation is also constructive because it signals management is still actively marketing the company to analysts and investors with non-GAAP metrics that highlight core operating performance. In my view, that supports the market’s focus on execution quality and backlog visibility, which strengthens the competitive position if the presentation confirms the same operating discipline shown in the quarter.
The 2026-05-18 annual meeting was routine, but the board election and the 96.4% advisory vote in favor of executive pay suggest no governance break in the investment case. Taken together, the recent 8-Ks leave the thesis materially strengthened, with no disclosed event that weakens the company’s operating or capital-return profile.
Financial Analysis
Growth
FIX — Financial Growth (Quarterly, USD Mil)
| Metric | 2025-06-30 | 2025-09-30 | 2025-12-31 | 2026-03-31 | 2026-06-30 |
|---|---|---|---|---|---|
| REVENUE (USD Mil) | 2,173.3 | 2,451 | 2,646.1 | 2,865.3 | 3,265.7 |
| EBIT (USD Mil) | 298.1 | 373.4 | 419.3 | 484.3 | 567.7 |
| EBITDA (USD Mil) | 332.7 | 409 | 456.9 | 523.3 | 611 |
| NET INCOME (USD Mil) | 230.8 | 291.6 | 330.8 | 370.4 | 441.6 |
| DILUTED EPS | 6.5 | 8.2 | 9.4 | 10.5 | 12.5 |
Source: Yahoo Finance — Quarterly Financial Statements
Revenue accelerated across the last five reported quarters, rising from $2.17e+03M in 2025-06-30 to $3.27e+03M in 2026-06-30, a 50.3% increase year over year in the latest quarter. EBITDA grew faster than revenue, from $333M to $611M over the same span, up 83.7%, while net income rose from $231M to $442M, up 91.4%, so earnings are outpacing sales rather than lagging them. The step-up from 2026-03-31 to 2026-06-30 was also large, with revenue up 14.0%, which looks like continued project execution rather than a seasonal pattern. Growth is a bull signal because the company is scaling revenue and profits together, and the latest quarter shows no sign of deceleration.
Profitability
FIX — Profitability (TTM)
| Metric | TTM |
|---|---|
| Operating Margin (TTM) | 17.1% |
| Net Margin (TTM) | 12.8% |
| Return on Assets (TTM) | 17.0% |
| Return on Equity (TTM) | 55.3% |
| Gross Margin (TTM) | 25.7% |
| EBITDA Margin (TTM) | 17.8% |
Source: Yahoo Finance — Trailing Twelve Months (TTM)
TTM operating margin of 17.1%, gross margin of 25.7%, and EBITDA margin of 17.8% show a business that is already past the startup phase and converting a meaningful share of revenue into operating profit. The 8.6-point gap between gross margin and operating margin implies overhead and project execution costs still sit above the cost of labor and materials, so investors should watch whether scale lets that spread narrow rather than just assuming pricing power will do the work. TTM net margin of 12.8% is lower than operating margin, which means interest, taxes, and other below-the-line items still take a real cut, but the company is not far from a cleaner earnings profile. TTM ROA of 17% and TTM ROE of 55.3% point to strong capital efficiency, although the much higher ROE than ROA suggests leverage is amplifying returns rather than pure asset productivity. The profitability profile is a bull signal because margins are solid and the next signal to watch is whether operating margin can move toward the high teens while net margin keeps closing the gap.
Valuation
FIX — Valuation Multiples
| Metric | Value |
|---|---|
| Current Share Price (USD) | 1,818 |
| Market Cap (USD Mil) | 63,982 |
| Enterprise Value (USD Mil) | 62,340 |
| Trailing P/E | 44.7 |
| Forward P/E | 30.2 |
| Price/Sales (TTM) | 5.7 |
| Price/Book (mrq) | 19.9 |
| EV/Revenue | 5.6 |
| EV/EBITDA | 31.1 |
| Beta (5Y Monthly) | 1.66 |
| FCF Yield % (TTM) | 2.9% |
| Forward EPS (USD) | 60.2 |
| Analyst Target Price – Low (USD) | 1,910 |
| Analyst Target Price – Mean (USD) | 2,197 |
| Analyst Target Price – High (USD) | 2,500 |
| # Analyst Opinions | 8 |
Source: Yahoo Finance
Comfort Systems USA trades at 5.7x trailing P/E, 30.2x forward P/E, 5.7x price/sales, 19.9x price/book, 5.55x EV/revenue, and 31.1x EV/EBITDA, with a 2.9% FCF yield and a 0.57 PEG ratio. At a current share price of $1,818, the market is paying a premium multiple for a contractor that is still compounding earnings, so the key question is whether that growth stays fast enough to justify 30.2x forward earnings and 31.1x EBITDA. The PEG ratio of 0.57 says the stock is not expensive relative to expected growth, but the absolute multiples are still rich for an industrial services name. Book value per share is $91.55 and total cash per share is $54.26, so the stock trades at about 19.9x book and roughly 33.5x cash per share, which tells me investors are paying for earnings power, not asset backing.
On my read, fair value sits in a range of roughly $1,750-$2,050 a share. That range is a little below the $2.2e+03 analyst mean and still inside the $1.91e+03–$2.5e+03 analyst range, which tells me the Street is broadly constructive but not unanimous about how much of the growth can be sustained. I would not call the consensus thin at 8 opinions, so the comparison matters: my range sits below the mean because I weight the 31.1x EV/EBITDA and 2.9% FCF yield more heavily than the market appears to. Forward EPS of 60.2 is the highest in the peer set, but that also means the stock is already priced for leadership, not just solid execution.
Leverage
FIX — Leverage & Coverage (Quarterly)
| Metric | Value |
|---|---|
| Total Debt/Equity % (mrq) | 11.5 |
| Current Ratio (mrq) | 1.2 |
| Total Debt (mrq, USD Mil) | 369.9 |
| Operating Cash Flow (TTM, USD Mil) | 2,550.1 |
| Levered Free Cash Flow (TTM, USD Mil) | 1,841.9 |
| Net Debt/EBITDA (TTM) | -0.8 |
| FCF Margin % (TTM) | 16.4% |
Source: Yahoo Finance — Quarterly Financial Statements
Total debt was $369.9M mrq, with Total Debt/Equity % at 11.5% mrq and a Current Ratio of 1.214x mrq, so the balance sheet is lightly levered and still has some near-term liquidity cushion. Operating Cash Flow was $2550M TTM and Levered Free Cash Flow was $1842M TTM, which means EBITDA is converting into real cash at a healthy rate even after capex and financing costs. Net Debt/EBITDA was -0.767x TTM, so cash exceeds debt and refinancing risk is low unless cash falls sharply or a large acquisition changes the profile. FCF Margin % was 16.4% TTM, a strong cash margin that gives the company room to absorb a downturn and keep funding operations without leaning on external capital. In my view, this is a low refinancing-risk balance sheet because net cash, strong FCF, and a current ratio above 1.0x outweigh the modest debt load.
Insider Activity
The insider transaction record I see here is one-sided: 24 open-market sales and 0 open-market purchases over 2025-03-19 to 2026-05-27, so insiders are net sellers. The activity is broad rather than isolated, with the CEO, CFO, chief accounting officer, and multiple other insiders all selling, which points to weak alignment at the margin. That does not prove the stock is overvalued, but it does matter when the shares already trade at a premium multiple and the operating case depends on continued flawless execution.
Comparable Analysis
LF0 has published standalone analyses of these peers: MasTec (MTZ) (rated Sell); MYR Group (MYRG) (rated Sell).
Growth
| Company | Revenue TTM (USD Mil) | Revenue Growth YoY % | EBITDA TTM (USD Mil) | Diluted EPS TTM |
|---|---|---|---|---|
| FIX | 11,228 | 50.3% | 2,002.7 | 40.6 |
| STRL | 3,438.5 | 90.1% | 714 | 13.9 |
| EME | 18,597.8 | 19.8% | 1,990.5 | 32.1 |
| MTZ | 16,109.1 | 23.4% | 1,308.5 | 6.3 |
| DY | 6,880.1 | 45.6% | 932 | 10.9 |
| MYRG | 4,006.1 | 20.1% | 290.8 | 10.5 |
Source: Yahoo Finance
FIX’s revenue growth of 50.3% TTM is well ahead of EME at 19.8%, MTZ at 23.4%, MYRG at 20.1%, and close to DY at 45.6%, while STRL leads the group at 90.1%. The premium is partly justified because FIX also posted diluted EPS of 40.6 TTM, so this is not just top-line inflation; still, STRL is growing faster and FIX’s growth premium over DY is narrower than the valuation gap, which means the market is already paying up for quality.
Valuation
| Company | Current Share Price (USD) | Trailing P/E | Forward P/E | EV/Revenue | EV/EBITDA | Price/Sales (TTM) | Price/Book (mrq) | Market Cap (USD Mil) | Enterprise Value (USD Mil) | Beta (5Y Monthly) | FCF Yield % (TTM) | Forward EPS | Analyst Target Price – Low | Analyst Target Price – Mean | Analyst Target Price – High | # Analyst Opinions |
|---|---|---|---|---|---|---|---|---|---|---|---|---|---|---|---|---|
| FIX | 1,818 | 44.7 | 30.2 | 5.6 | 31.1 | 5.7 | 19.9 | 63,982 | 62,340 | 1.66 | 2.9% | 60.2 | 1,910 | 2,197 | 2,500 | 8 |
| STRL | 563.7 | 40.6 | 22.2 | 5 | 24 | 5 | 12.7 | 17,242 | 17,148 | 1.86 | 2.0% | 25.4 | 700 | 845.4 | 1,000 | 7 |
| EME | 824.5 | 25.7 | 22.4 | 1.9 | 18.1 | 2 | 8.9 | 36,369 | 35,994 | 1.12 | 2.7% | 36.8 | 885 | 1,033.3 | 1,200 | 7 |
| MTZ | 228.3 | 36.4 | 18.2 | 1.3 | 16.2 | 1.1 | 5.1 | 18,334 | 21,142 | 1.84 | -0.3% | 12.5 | 313 | 401.6 | 518 | 20 |
| DY | 290.4 | 26.5 | 14 | 1.7 | 12.3 | 1.3 | 4.2 | 8,760 | 11,456 | 1.50 | 3.7% | 20.8 | 375 | 520.9 | 625 | 11 |
| MYRG | 324.5 | 30.8 | 22.3 | 1.2 | 17.1 | 1.3 | 6.7 | 5,052 | 4,982 | 1.32 | 3.5% | 14.6 | 370 | 410.6 | 445 | 5 |
Source: Yahoo Finance
FIX trades at 5.55x EV/revenue, 31.1x EV/EBITDA, 44.7x trailing P/E, and 30.2x forward P/E, versus STRL at 5.0x, 24.0x, 40.6x, and 22.2x, EME at 1.9x, 18.1x, 25.7x, and 22.4x, MTZ at 1.3x, 16.2x, 36.4x, and 18.2x, DY at 1.7x, 12.3x, 26.5x, and 14.0x, and MYRG at 1.2x, 17.1x, 30.8x, and 22.3x. On FCF yield, FIX at 2.9% is not the cheapest in the group, but it does pair a 16.4% FCF margin with $1.8B of FCF TTM, so the premium is tied to cash generation rather than just earnings optics. Using peer EV/revenue of 1.2x to 5.6x on FIX’s $11.2B of revenue implies an enterprise value of about $13.9B to $62.3B, or roughly $393 to $1,765 per share after netting $1.9B of cash and $370M of debt and dividing by 35.2M shares; that range sits below the current $1,818 share price, which tells me the stock already discounts a best-in-class multiple. Forward EPS of 60.2 is also above STRL’s 25.4, EME’s 36.8, MTZ’s 12.5, DY’s 20.8, and MYRG’s 14.6, so FIX is priced as the earnings leader, not merely a fast grower.
Profitability
| Company | Operating Margin (TTM) | Net Margin (TTM) | Return on Assets (TTM) | Return on Equity (TTM) | Gross Margin (TTM) | EBITDA Margin (TTM) |
|---|---|---|---|---|---|---|
| FIX | 17.1% | 12.8% | 17.0% | 55.3% | 25.7% | 17.8% |
| STRL | 20.1% | 12.5% | 14.6% | 40.0% | 23.8% | 20.8% |
| EME | 10.6% | 7.7% | 12.0% | 40.3% | 19.4% | 10.7% |
| MTZ | 5.4% | 3.1% | 5.3% | 16.2% | 12.9% | 8.1% |
| DY | 9.6% | 4.8% | 7.1% | 19.2% | 20.5% | 13.6% |
| MYRG | 6.2% | 4.1% | 8.5% | 24.7% | 12.5% | 7.3% |
Source: Yahoo Finance
FIX’s 17.1% operating margin, 12.8% net margin, 25.7% gross margin, and 17.8% EBITDA margin sit above MTZ’s 5.4%, 3.1%, 12.9%, and 8.1%, DY’s 9.6%, 4.8%, 20.5%, and 13.6%, and MYRG’s 6.2%, 4.1%, 12.5%, and 7.3%, while STRL and EME are closer on operating margin at 20.1% and 10.6%. The fact that FIX’s gross margin is only modestly above STRL’s 23.8% but its operating margin is still strong suggests better scale and opex control, not just cheaper cost of revenue. FIX’s 55.3% ROE and 17% ROA also top the group, which tells me this is not just leverage dressing; it is stronger capital efficiency than peers.
Leverage
| Company | Total Debt/Equity % (mrq) | Current Ratio (mrq) | Total Debt (mrq, USD Mil) | Operating Cash Flow TTM (USD Mil) | Free Cash Flow TTM (USD Mil) | Net Debt/EBITDA (TTM) | FCF Margin % (TTM) |
|---|---|---|---|---|---|---|---|
| FIX | 11.5 | 1.2 | 369.9 | 2,550.1 | 1,841.9 | -0.8 | 16.4% |
| STRL | 24.2 | 1.1 | 336.8 | 597.7 | 349.4 | -0.2 | 10.2% |
| EME | 13.4 | 1.3 | 548 | 1,289.8 | 978.3 | -0.2 | 5.3% |
| MTZ | 89.9 | 1.4 | 3,235.4 | 582 | -57.9 | 2.2 | -0.4% |
| DY | 147.7 | 2.3 | 3,048.5 | 718.1 | 326.6 | 2.9 | 4.8% |
| MYRG | 8.9 | 1.4 | 67.1 | 298.5 | 177.3 | -0.2 | 4.4% |
Source: Yahoo Finance
FIX’s 11.5% debt/equity, -0.8x net debt/EBITDA, and 16.4% FCF margin are cleaner than MTZ’s 89.9%, 2.2x, and -0.4%, and DY’s 147.7%, 2.9x, and 4.8%, while STRL, EME, and MYRG also carry net cash at -0.2x, -0.2x, and -0.2x. FIX’s negative net debt/EBITDA is the key point: the balance sheet is a support, not a constraint, so the premium multiple is not being financed with leverage. That matters in the peer set because the market is paying a higher multiple for FIX even though several peers also have net cash; the difference is that FIX combines that balance-sheet safety with the strongest earnings power.
Conclusion
The tension in this name is simple: Comfort Systems USA is executing at a very high level, but the stock already prices in a lot of that execution. Revenue reached $3.27e+03M in the quarter ended 2026-06-30 and EBITDA reached $611M, so the business is still compounding, yet the market is paying 30.2x forward earnings and 31.1x EV/EBITDA for a contractor that already has $24.17B of project value in process and a 2.9% FCF yield. That combination leaves less room for disappointment than the operating momentum alone would suggest.
I would raise my rating more toward a Buy if revenue growth stays above 25.0% year over year for another two quarters and operating margin holds near 17.1%, because that would show the current scale is still translating into cash rather than just backlog. If EBITDA were to move from $611M to roughly $700M on the current revenue base, that would add about $89M of annual EBITDA, which would help justify the premium multiple and make the current valuation look less stretched.
I would move from Hold to Sell if revenue growth falls below 15.0% year over year or if operating margin slips under 15.0%, because that would tell me the market is paying peak-cycle multiples for a business whose execution edge is fading. A drop from 17.1% operating margin to 15.0% on the latest revenue base would cut annual operating profit by roughly $70M, and that kind of miss would matter quickly when the stock already trades at 30.2x forward earnings.
Weighing both cases, I lean to Hold rather than Buy because the bull case still needs another clean quarter or two to prove that the current pace is durable, while the bear case only needs a modest slowdown to pressure a valuation this rich. The balance sheet and cash generation are strong, but the shares already reflect a lot of that strength, so I would wait for either a cheaper entry point or another step-up in earnings before getting more constructive.
What to Watch Next
- Revenue growth above 25.0% YoY for two more quarters — would support a move toward Buy.
- Operating margin holding near 17.1% — would confirm the current execution edge.
- EBITDA approaching $700M on the current revenue base — would help justify the premium multiple.
- Revenue growth below 15.0% YoY — would raise concern that the cycle is cooling.
- Operating margin below 15.0% — would argue the valuation is too rich for the earnings profile.
What’s your take? I rated Comfort Systems USA (FIX) SELL above — but the goal here is to get this right, not just to publish an opinion. What would you add to this analysis, or which risk or catalyst do you think I’m under- or over-weighting? Tell me in the comments.
Sources
- SEC 10-K Annual Report — filed 2026-02-19
- SEC 8-K Filing (2026-05-21)
- SEC 8-K Filing (2026-05-01)
- SEC 8-K Filing (2026-04-23)
- SEC 8-K Filing (2026-02-20)
- SEC 8-K Filing (2026-02-19)
- SEC Form 4 Insider Transaction (2026-05-28)
- SEC Form 4 Insider Transaction (2026-05-22)
- SEC Form 4 Insider Transaction (2026-05-19)
- SEC 10-K Annual Report — FY2026
- SEC 10-K Annual Report — FY2025
- SEC 10-K Annual Report — FY2024
- SEC 10-K Annual Report — FY2023
- SEC 10-K Annual Report — FY2022
Data sourced from Yahoo Finance and SEC EDGAR. Not investment advice.
Leave a Comment