
| Company | Oct 25 | Nov 25 | Dec 25 | Jan 26 | Feb 26 | Mar 26 | Apr 26 | May 26 | Jun 26 | Jul 26 | Aug 26 | Sep 26 | 12-Mo |
|---|---|---|---|---|---|---|---|---|---|---|---|---|---|
| PWR | +8% | +4% | -9% | +12% | +19% | -2% | +33% | -2% | +1% | -7% | -9% | +6% | +55% |
| MTZ | -4% | +5% | +2% | +11% | +24% | +8% | +22% | -4% | +10% | -37% | -9% | -11% | +0% |
| FIX | +17% | +1% | -4% | +22% | +25% | -3% | +33% | -1% | +8% | -13% | -11% | +7% | +101% |
| EME | +4% | -9% | -1% | +18% | +1% | +2% | +21% | -7% | +0% | -4% | -8% | +3% | +16% |
| MYRG | +5% | +3% | -3% | +14% | +8% | +5% | +43% | +15% | +8% | -33% | -13% | +0% | +41% |
Source: Yahoo Finance monthly adjusted close.
Quick Thesis
- Rated Hold — growth is strong, but the stock already prices in a lot of it.
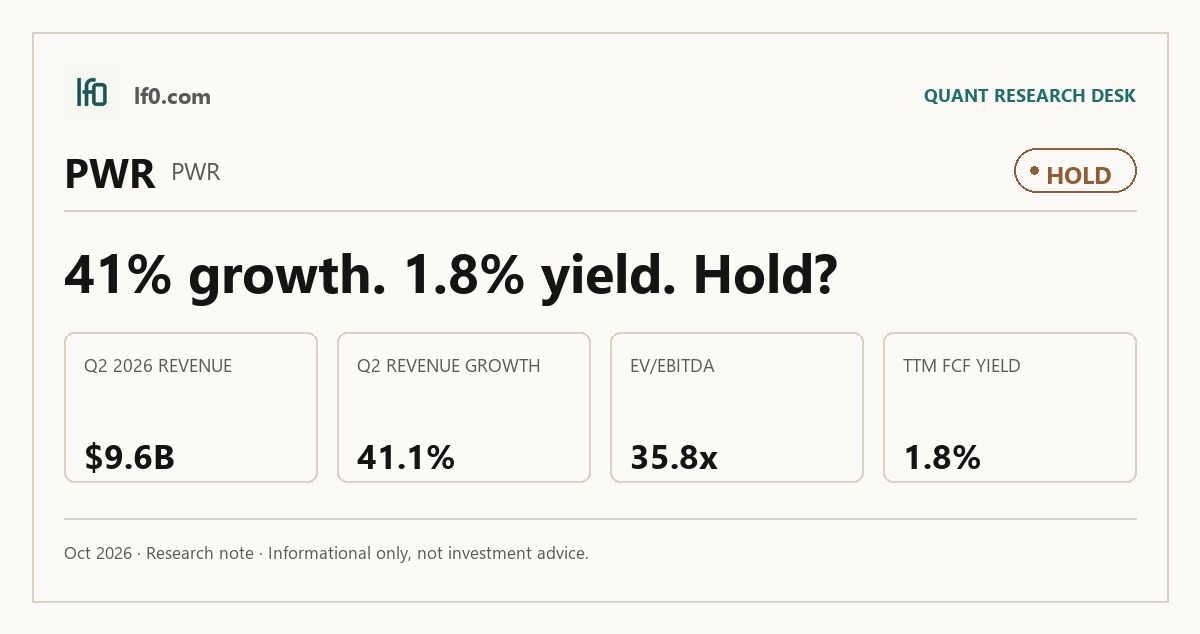
- Biggest strength: Q2 2026 revenue reached 9.6B, up 41.1% year over year.
- Biggest risk: TTM free cash flow yield is only 1.8%, so valuation has little cushion.
- Valuation is rich versus peers at 35.8x EV/EBITDA and 3.3x EV/revenue.
- I would raise the rating if quarterly revenue stays above 9B and operating margin tops 8.0%.
Executive Summary
Rating: HOLD | PWR
We’ll begin tracking this call’s performance since publication once sufficient adjusted-close data is available.
I would put my rating as a Hold because Quanta Services is growing fast enough to justify a premium, but not fast enough to make the valuation look cheap. Revenue rose 41.1% year over year in Q2 2026 to 9.6B, and EBITDA reached 964.8M, so the operating momentum is real. The problem is that the market is already paying 35.8x EV/EBITDA and 1.8% FCF yield, which leaves little room for disappointment.
In my view, the key question is whether the Q2 2026 step-up becomes a durable run rate rather than a single strong quarter. I would raise my rating more toward a Buy if quarterly revenue stays above 9B, meaning the business is sustaining that higher base, and if operating margin moves above 8.0%, which would show scale is turning into better earnings quality. If those two conditions do not hold, the current multiple looks fully worked.
Company Profile
Quanta Services, Inc. was founded in 1997 and is listed on the New York Stock Exchange under PWR. It provides design, engineering, procurement, construction, upgrade, and maintenance services for electric power, gas utility, communications, pipeline, renewable energy, and large load center infrastructure. Revenue comes mainly from master service agreements, repair contracts, and fixed-price or non-fixed-price projects.
The company operates in the United States, Canada, Australia, and select other international markets, and it derived 7.0% of 2025 revenue from foreign operations. Quanta runs two reportable segments, Electric Infrastructure Solutions and Underground Utility and Infrastructure Solutions. It had about 69,500 employees and an owned and leased fleet of roughly 80,000 units at December 31, 2025.
Economic Moat
Business Model
Quanta’s most defensible advantage is the combination of preferred service-provider status, long-standing customer relationships, and the scale to deliver turnkey infrastructure work across electric, gas, communications, and large load center projects. According to their SEC filings, many of those relationships sit inside master service agreements, strategic alliances, and long-term maintenance contracts that can include preferential bidding procedures, which makes it harder for a well-funded entrant to displace Quanta within 3 years.
I feel that the hardest piece to replicate is not any single truck fleet or crew base, but the integrated network of operating companies, training facilities, and craft labor that lets Quanta cross-sell from transmission to substations, data centers, and pipeline work while maintaining safety and execution standards. The 80,000-unit owned and leased fleet, the Quanta Advanced Training Center in Texas, and Northwest Lineman College reinforce that labor and equipment depth. Domestic manufacturing of power transformers and utility poles helps with supply chain control, and the 69,500-employee base, including 36% covered by collective bargaining agreements, supports scale that smaller contractors cannot match.
Business & Operating Risks
A wildfire or explosion tied to work on customer infrastructure is the clearest disclosed risk to Quanta Services, because the 2026 10-K says these events can create significant liabilities, may not be fully covered by insurance, and can arise even when Quanta is not the direct cause. The filing specifically points to wildfires in the United States, Canada and Australia, notes that certain customers have been determined to be or are potentially responsible for catastrophic wildfire events in the western United States, and says Quanta operating companies have received tenders of defense, demands for preservation of documents and indemnity, and subpoenas.
Contract execution and change-order recovery is the next major risk. Quanta says project delays, scope changes, permitting problems, and inaccurate cost estimates can lead to liquidated damages or project termination, and it disclosed $983.6M of unapproved change orders and claims as of December 31, 2025. That is a meaningful amount of revenue still tied up in disputed recovery, so working capital can be trapped for long periods and margins can reset downward if claims are not collected.
Labor scarcity and cost inflation remain a third pressure point. The 2026 filing says Quanta is labor-intensive, that the pool of skilled workers has been reduced by an aging utility workforce, and that approximately 36% of employees were covered by collective bargaining agreements as of December 31, 2025. It also warns that inflation has increased labor costs and can delay or cancel customer projects.
The disclosed risks do not directly threaten the moat itself; they test execution around it. In my view, the bigger issue is whether wildfire exposure and claims recovery can keep the preferred-service network from turning into a margin drag.
Management Discussion & Analysis
Management is actively responding to the operating risks by leaning into scale, backlog, and capital deployment rather than pulling back. Quanta issued $1.50B of senior notes in August 2025 and used the proceeds to repay borrowings tied to Dynamic Systems, which tells me management is refinancing acquisition debt rather than shrinking leverage. That fits with the $3.05B of cash used for acquisitions in 2025 and the $750M to $800M of expected capital expenditures in 2026.
Remaining performance obligations were $23.76B and backlog was $44B at December 31, 2025, up 41.8% and 27.3% from December 31, 2024. That gives management cover to keep investing, although I would note that backlog is being padded by acquisitions and by master service agreements, where customers are not committed to specific volumes. The gap is that 2025 operating margin stayed at 5.7% even as revenue rose 20.3% to 28.5B, so the growth is real but not yet translating into materially better margin quality.
Recent Events
The most significant development I see is the new $1B share repurchase authorization announced on May 22, 2026, one day after the 2026 Annual Meeting. That is a clear capital-allocation signal: management is choosing buybacks over balance-sheet hoarding, which supports the view that Quanta still sees its own equity as attractive relative to other uses of cash.
I also view the April 10, 2026 compensation award to senior leaders as constructive for execution. The five-year performance stock units run through December 31, 2030 and tie pay to adjusted EPS growth and total shareholder return, so the board is trying to keep leadership aligned with the long-duration growth plan rather than short-term optics. The February 26, 2026 incentive plan extends that same message across the broader workforce, with annual targets tied to EBITDA, EBITDA margin, and safety.
Financial Analysis
Growth
PWR — Financial Growth (Quarterly, USD Mil)
| Metric | 2025-06-30 | 2025-09-30 | 2025-12-31 | 2026-03-31 | 2026-06-30 |
|---|---|---|---|---|---|
| REVENUE (USD Mil) | 6,773 | 7,631.4 | 7,841.9 | 7,874.8 | 9,557 |
| EBIT (USD Mil) | 378.2 | 534.2 | 495.3 | 329.6 | 690.7 |
| EBITDA (USD Mil) | 590.1 | 771.3 | 749 | 595.3 | 964.8 |
| NET INCOME (USD Mil) | 229.2 | 339.4 | 315.4 | 220.6 | 451.4 |
| DILUTED EPS | 1.5 | 2.2 | 2.1 | 1.4 | 3 |
Source: Yahoo Finance — Quarterly Financial Statements
Revenue accelerated from 6.8B in Q2 2025 to 7.6B in Q3 2025, then to 7.8B in Q4 2025 before easing to 7.9B in Q1 2026 and jumping to 9.6B in Q2 2026. That is 41.1% year-over-year growth in Q2 2026, after 12.7% in Q3 2025, 15.9% in Q4 2025, and 16.3% in Q1 2026. EBITDA rose faster than revenue in Q2 2026, reaching 964.8M versus 590.1M a year earlier, while net income and diluted EPS also outpaced sales growth. I read that as a real acceleration, not a seasonal swing.
Profitability
PWR — Profitability (TTM)
| Metric | TTM |
|---|---|
| Operating Margin (TTM) | 7.2% |
| Net Margin (TTM) | 4.0% |
| Return on Assets (TTM) | 5.2% |
| Return on Equity (TTM) | 15.3% |
| Gross Margin (TTM) | 15.5% |
| EBITDA Margin (TTM) | 9.2% |
Source: Yahoo Finance — Trailing Twelve Months (TTM)
TTM operating margin of 7.2%, gross margin of 15.5%, and EBITDA margin of 9.2% show Quanta is already clearing a healthy spread above direct project costs, but the gap from gross to operating margin is still 8.3 points, which points to a business carrying meaningful overhead and project execution costs. TTM net margin of 4.0% confirms that most of the gross profit is converting into earnings, so this is not a margin structure that looks broken.
TTM return on assets of 5.2% and TTM return on equity of 15.3% show solid capital efficiency, and the ROE-to-ROA gap suggests leverage is amplifying returns rather than creating them from weak operating performance. That matters for the moat because the scale advantage described above is showing up in returns, even if it is not yet best in class. I would watch for operating margin moving above 8.0%, because that would show scale benefits are still flowing through.
Valuation
PWR — Valuation Multiples
| Metric | Value |
|---|---|
| Current Share Price (USD) | 718.4 |
| Market Cap (USD Mil) | 108,010 |
| Enterprise Value (USD Mil) | 108,948 |
| Trailing P/E | 82.3 |
| Forward P/E | 36.3 |
| Price/Sales (TTM) | 3.3 |
| Price/Book (mrq) | 11.2 |
| EV/Revenue | 3.3 |
| EV/EBITDA | 35.8 |
| Beta (5Y Monthly) | 1.27 |
| FCF Yield % (TTM) | 1.8% |
| Forward EPS (USD) | 19.8 |
| Analyst Target Price – Low (USD) | 410 |
| Analyst Target Price – Mean (USD) | 768 |
| Analyst Target Price – High (USD) | 945 |
| # Analyst Opinions | 29 |
Source: Yahoo Finance
Quanta Services trades at 35.8x EV/EBITDA, 3.3x EV/revenue, 3.3x price/sales, 82.3x trailing P/E, and 36.3x forward P/E, with a 1.5x PEG ratio and 1.8% FCF yield. At a current share price of $718.4, the market is paying for a business that can keep compounding earnings at a premium rate for several years, not just one strong cycle. The 35.8x EV/EBITDA multiple is the main anchor here because EBITDA margin is only 9.2% TTM, so the stock is not priced as a cash-rich mature contractor; it is priced as a long-duration infrastructure compounder.
The balance sheet is not stretched enough to explain the valuation: net debt/EBITDA is 2.0x, debt/equity is 67.8%, and book value per share is $64.1, so the equity trades at 11.2x book and far above the asset base. Total cash per share is $3.4, which is modest relative to the share price. With 29 analyst opinions, the consensus target range of $410.0 to $945.0 and mean of $768.0 gives me a useful benchmark, and my own fair-value range sits inside that band rather than outside it.
On the analysis here, I would put fair value around $680 to $780 per share. That range is narrower than the full analyst spread because I weight the current cash yield and leverage profile more heavily than the most optimistic growth assumptions, but it still leaves room for the market to reward execution if margins improve. Forward EPS of 19.8 also matters: against peers, that is not the highest absolute figure, so the stock is not cheap on earnings power alone. The implied EPS trajectory looks richer than MTZ and MYRG on a growth-adjusted basis, but less compelling than FIX, which combines stronger profitability with a higher earnings base.
Leverage
PWR — Leverage & Coverage (Quarterly)
| Metric | Value |
|---|---|
| Total Debt/Equity % (mrq) | 67.8 |
| Current Ratio (mrq) | 1.1 |
| Total Debt (mrq, USD Mil) | 6,603.1 |
| Operating Cash Flow (TTM, USD Mil) | 3,178.2 |
| Levered Free Cash Flow (TTM, USD Mil) | 1,955.5 |
| Net Debt/EBITDA (TTM) | 2 |
| FCF Margin % (TTM) | 5.9% |
Source: Yahoo Finance — Quarterly Financial Statements
Quanta Services’ leverage is moderate, not stretched. Total debt/equity was 67.8%, current ratio was 1.1, and total debt was $6.6B, so the balance sheet is carrying meaningful debt but still has near-term liquidity. Cash generation is the stronger part of the picture: operating cash flow was $3.2B and levered free cash flow was $2B, with FCF margin at 5.9%.
Net debt/EBITDA was 2.0x, which I view as manageable for a contractor with recurring utility and data-center demand. The cash conversion is decent but not exceptional because EBITDA is not fully converting into free cash flow, which means working capital and capex still absorb a meaningful share of earnings. That is why I do not see refinancing risk as the core issue; the real question is whether growth can keep outrunning the cash demands of the model.
Insider Activity
The insider transaction record I see here is one-sided: 27 open-market sales and 0 open-market purchases over 2025-02-27 to 2026-06-01, so insiders are net sellers. The activity is concentrated, with President and CEO Austin Earl C. Jr. accounting for the clear bulk of the open-market selling, while the rest of the record is sparse. In my view, that is a bear signal because alignment looks weaker when the only market-price transactions are sales.
Comparable Analysis
LF0 has published standalone analyses of these peers: MasTec (MTZ) (rated Sell); MYR Group (MYRG) (rated Sell).
Growth
| Company | Revenue TTM (USD Mil) | Revenue Growth YoY % | Diluted EPS TTM |
|---|---|---|---|
| PWR | 32,905.1 | 41.1% | 8.7 |
| MTZ | 16,109.1 | 23.4% | 6.3 |
| FIX | 11,228 | 50.3% | 40.6 |
| EME | 18,597.8 | 19.8% | 32.1 |
| MYRG | 4,006.1 | 20.1% | 10.5 |
Source: Yahoo Finance
PWR’s revenue growth of 41.1% TTM is ahead of MTZ at 23.4%, EME at 19.8%, and MYRG at 20.1%, but slightly behind FIX at 50.3% TTM. That premium is justified because PWR is still scaling a much larger base at 32.9B TTM revenue, so the gap says investors are paying for faster absolute dollar growth rather than the highest percentage growth.
Valuation
| Company | Current Share Price (USD) | Trailing P/E | Forward P/E | EV/Revenue | EV/EBITDA | Price/Sales (TTM) | Price/Book (mrq) | Market Cap (USD Mil) | Enterprise Value (USD Mil) | Beta (5Y Monthly) | FCF Yield % (TTM) | Forward EPS | Analyst Target Price – Low | Analyst Target Price – Mean | Analyst Target Price – High | # Analyst Opinions |
|---|---|---|---|---|---|---|---|---|---|---|---|---|---|---|---|---|
| PWR | 718.4 | 82.3 | 36.3 | 3.3 | 35.8 | 3.3 | 11.2 | 108,010 | 108,948 | 1.27 | 1.8% | 19.8 | 410 | 768 | 945 | 29 |
| MTZ | 229.4 | 36.6 | 18.3 | 1.3 | 15.6 | 1.1 | 5.2 | 18,446 | 20,437 | 1.84 | -0.3% | 12.5 | 313 | 406 | 518 | 20 |
| FIX | 1,805.8 | 44.4 | 30 | 5.2 | 29.3 | 5.7 | 19.7 | 63,556 | 58,654 | 1.66 | 2.9% | 60.2 | 1,910 | 2,197 | 2,500 | 8 |
| EME | 822.1 | 25.6 | 22.4 | 1.8 | 17.1 | 1.9 | 8.9 | 36,264 | 33,995 | 1.12 | 2.7% | 36.7 | 885 | 1,033.3 | 1,200 | 7 |
| MYRG | 326.9 | 31 | 22.4 | 1.2 | 16 | 1.3 | 6.7 | 5,089 | 4,641 | 1.32 | 3.5% | 14.6 | 375 | 412 | 445 | 5 |
Source: Yahoo Finance
PWR trades at 1.8% FCF yield TTM, 3.3x EV/revenue, 82.3x trailing P/E, and 36.3x forward P/E, versus FIX at 2.9%, 5.2x, 44.4x, and 30.0x, MTZ at -0.3%, 1.3x, 36.6x, and 18.3x, EME at 2.7%, 1.8x, 25.6x, and 22.4x, and MYRG at 3.5%, 1.2x, 31.0x, and 22.4x. PWR’s FCF yield is the weakest in the group, so the stock is priced for execution rather than cash return, and the $768.0 analyst mean target versus the $718.4 share price leaves only modest upside if growth cools. I also think the valuation premium is easier to defend because PWR’s leverage is moderate rather than stretched, but it still needs margin improvement to justify the gap.
Profitability
| Company | Operating Margin (TTM) | Net Margin (TTM) | Return on Assets (TTM) | Return on Equity (TTM) | Gross Margin (TTM) | EBITDA Margin (TTM) |
|---|---|---|---|---|---|---|
| PWR | 7.2% | 4.0% | 5.2% | 15.3% | 15.5% | 9.2% |
| MTZ | 5.4% | 3.1% | 5.3% | 16.2% | 12.9% | 8.1% |
| FIX | 17.1% | 12.8% | 17.0% | 55.3% | 25.7% | 17.8% |
| EME | 10.6% | 7.7% | 12.0% | 40.3% | 19.4% | 10.7% |
| MYRG | 6.2% | 4.1% | 8.5% | 24.7% | 12.5% | 7.3% |
Source: Yahoo Finance
PWR’s gross margin of 15.5%, EBITDA margin of 9.2%, operating margin of 7.2%, and net margin of 4.0% sit above MTZ’s 12.9%, 8.1%, 5.4%, and 3.1%, but below FIX’s 25.7%, 17.8%, 17.1%, and 12.8%, and also below EME’s 19.4%, 10.7%, 10.6%, and 7.7%. The pattern looks more like scale and project mix than a pure cost-of-revenue issue, because PWR’s margin gap versus FIX is wider at the operating and net lines than at gross margin, which points to heavier opex and integration costs rather than just weaker pricing.
PWR’s ROE of 15.3% and ROA of 5.2% are below FIX’s 55.3% and 17.0%, EME’s 40.3% and 12.0%, and MYRG’s 24.7% and 8.5%, while MTZ is close at 16.2% and 5.3%. The wide ROE gap versus the cash-rich peers is not just leverage, because PWR’s ROA also trails them, so the market is rewarding a good but not best-in-class capital efficiency profile.
Leverage
| Company | Total Debt/Equity % (mrq) | Current Ratio (mrq) | Total Debt (mrq, USD Mil) | Net Debt/EBITDA (TTM) | FCF Margin % (TTM) |
|---|---|---|---|---|---|
| PWR | 67.8 | 1.1 | 6,603.1 | 2 | 5.9% |
| MTZ | 89.9 | 1.4 | 3,235.4 | 2.2 | -0.4% |
| FIX | 11.5 | 1.2 | 369.9 | -0.8 | 16.4% |
| EME | 13.4 | 1.3 | 548 | -0.2 | 5.3% |
| MYRG | 8.9 | 1.4 | 67.1 | -0.2 | 4.4% |
Source: Yahoo Finance
PWR’s debt/equity of 67.8% and net debt/EBITDA of 2.0x are higher than FIX’s 11.5% and -0.8x, EME’s 13.4% and -0.2x, and MYRG’s 8.9% and -0.2x, while MTZ is the closest levered peer at 89.9% and 2.2x. PWR’s 5.9% FCF margin is far better than MTZ’s -0.4% and below FIX’s 16.4%, so the balance sheet is not stretched, but it is more financed than the cash-rich peers and that supports a premium only if cash conversion stays strong.
Conclusion
I would put my rating as a Hold because Quanta Services has the growth profile to justify a premium, but the stock already prices in a lot of that upside at 35.8x EV/EBITDA and 82.3x trailing P/E. The business is still compounding, with revenue up 41.1% TTM and levered free cash flow of $2B TTM, yet the 1.8% FCF yield and 0.7% insider ownership tell me the market is paying for execution that still has to keep landing.
The bull case is straightforward: if quarterly revenue stays above 9B, meaning the Q2 2026 step-up is holding, and operating margin moves above 8.0%, meaning scale is turning into better earnings quality, I would move the rating more toward a Buy. I would also become more constructive if levered free cash flow expands toward $2.5B, because that would show the higher revenue base is converting into real cash rather than just more activity. On the downside, I would move from Hold to Sell if revenue slips back below 8B in a quarter or if net debt/EBITDA rises above 2.5x, because that would tell me growth is fading while leverage is moving the wrong way.
For now, I think the stock is expensive but not broken. The next move is more likely to be sideways than sharply higher unless Quanta proves that the Q2 2026 revenue jump can hold and convert into a meaningfully better margin profile.
What to Watch Next
- Quarterly revenue above 9B — would support a move toward Buy.
- Operating margin above 8.0% — would show scale is improving earnings quality.
- Levered free cash flow near $2.5B — would strengthen the valuation case.
- Net debt/EBITDA above 2.5x — would raise balance-sheet risk.
- Quarterly revenue back below 8B — would argue the growth step-up is fading.
What’s your take? I rated Quanta Services (PWR) HOLD above — but the goal here is to get this right, not just to publish an opinion. What would you add to this analysis, or which risk or catalyst do you think I’m under- or over-weighting? Tell me in the comments.
Sources
- SEC 10-K Annual Report — filed 2026-02-19
- SEC 8-K Filing (2026-05-27)
- SEC 8-K Filing (2026-04-30)
- SEC 8-K Filing (2026-04-16)
- SEC 8-K Filing (2026-03-04)
- SEC 8-K Filing (2026-02-19)
- SEC Form 4 Insider Transaction (2026-06-03)
- SEC Form 4 Insider Transaction (2026-06-03)
- SEC Form 4 Insider Transaction (2026-06-03)
- SEC 10-K Annual Report — FY2026
- SEC 10-K Annual Report — FY2025
- SEC 10-K Annual Report — FY2024
- SEC 10-K Annual Report — FY2023
- SEC 10-K Annual Report — FY2022
Data sourced from Yahoo Finance and SEC EDGAR. Not investment advice.
Leave a Comment