
| Company | Oct 25 | Nov 25 | Dec 25 | Jan 26 | Feb 26 | Mar 26 | Apr 26 | May 26 | Jun 26 | Jul 26 | Aug 26 | Sep 26 | 12-Mo |
|---|---|---|---|---|---|---|---|---|---|---|---|---|---|
| CME | -2% | +6% | -3% | +6% | +11% | -5% | -3% | -5% | -19% | +21% | +7% | -8% | +1% |
| NDAQ | -3% | +6% | +7% | -0% | -10% | -3% | +8% | +1% | -15% | +20% | +5% | -6% | +5% |
| IBKR | +2% | -8% | -1% | +16% | -5% | -6% | +19% | +9% | +0% | +1% | +11% | -12% | +25% |
| ICE | -13% | +8% | +3% | +7% | -6% | -4% | +1% | -6% | -16% | +24% | +5% | -5% | -9% |
| CBOE | +0% | +5% | -3% | +6% | +13% | -6% | +7% | +11% | -27% | +28% | -3% | -8% | +13% |
| MKTX | -8% | +3% | +11% | -7% | +14% | -14% | -5% | -17% | -13% | +43% | +1% | +1% | -4% |
Source: Yahoo Finance monthly adjusted close.
Quick Thesis
- Rated Hold — exceptional franchise, but valuation already discounts it.
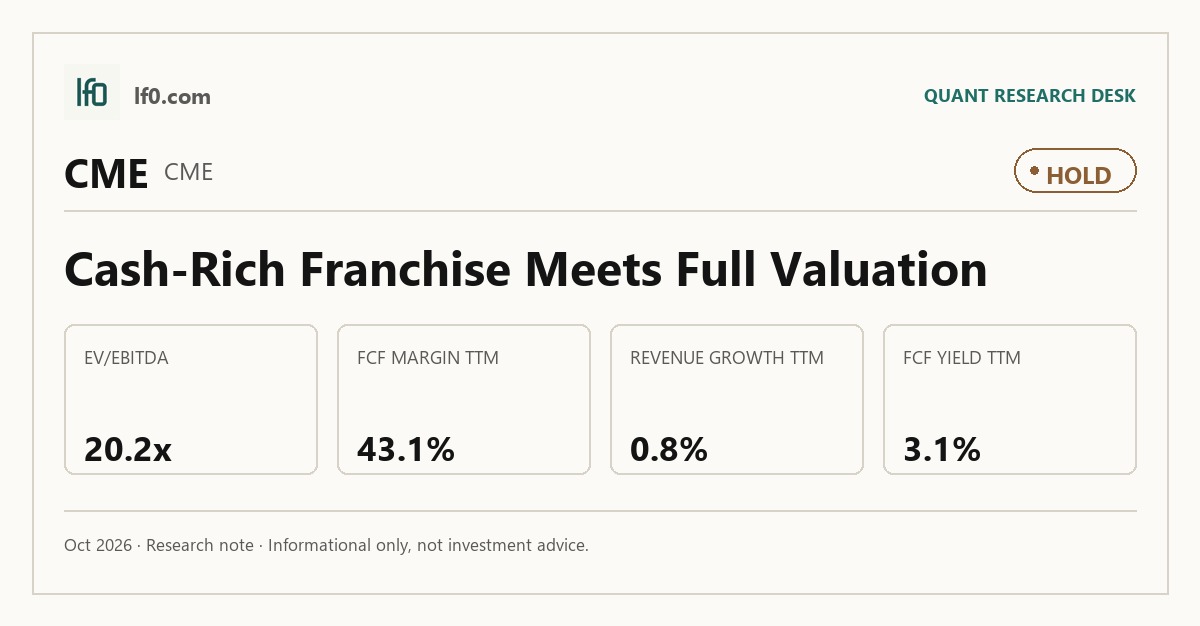
- Strongest strength: 43.1% FCF margin TTM and 0.3x net debt/EBITDA.
- Main risk: revenue growth was only 0.8% TTM.
- Valuation is rich at 20.2x EV/EBITDA and 22.5x trailing P/E.
- I would turn more constructive if revenue growth moves above 5.0% YoY.
Executive Summary
Rating: HOLD | CME
We’ll begin tracking this call’s performance since publication once sufficient adjusted-close data is available.
I would put my rating as a Hold because CME Group has a durable clearing and benchmark franchise, but the stock already prices in that quality at 20.2x EV/EBITDA and 22.5x trailing P/E. The business still converts revenue into cash at a very high rate, yet the latest 0.8% TTM revenue growth tells me the next leg has to come from acceleration, not just stability. I would become more constructive if revenue growth moves above 5.0% YoY and operating margin stays near 65.0%, because that would show the pricing actions and new product launches are adding to the core franchise rather than merely offsetting normal volume swings.
Company Profile
CME Group Inc. operates futures, options, cash and over-the-counter products, clears those trades, and sells market data and analytics. Revenue comes from transaction and clearing fees across its derivatives exchanges and cash markets, plus data services, licensing, and related technology products. The company runs CME, CBOT, NYMEX and COMEX, along with BrokerTec for cash fixed income and EBS for spot foreign exchange.
The group traces back to the Chicago Mercantile Exchange, founded in 1898, and the modern structure was formed through the 2007 merger of the Chicago Mercantile Exchange and the Chicago Board of Trade. It later expanded through the 2018 acquisition of NEX Group, which added BrokerTec and EBS. CME Group is listed on Nasdaq under CME and is headquartered in Chicago, with sales presence in more than 10 countries and a growing footprint in the Middle East, including Dubai.
Economic Moat
Business Model
The deepest structural advantage is the clearing-and-liquidity loop around CME Clearing and CME Globex, because the exchange sits at the center of execution, price discovery, and central counterparty clearing in one system. According to their SEC 10-K, the clearing house serves as the buyer to every seller and the seller to every buyer, marks positions to market at least twice each business day, and supported an average daily margin saving of about $72B in 2025. I feel that a well-funded competitor cannot replicate that network effect within 3 years, because liquidity, membership access, and margin offsets are built over years of open interest rather than bought with capital.
The second pillar is the benchmark franchise: CME Term SOFR, the S&P 500 index license, and exclusive Nasdaq and Russell index licenses through 2039 and 2037 give the company durable product anchors that are hard to dislodge. BrokerTec, EBS, and the Google Cloud migration add distribution and operating scale, but they reinforce the core franchise rather than replace it. That breadth matters because it gives CME more ways to monetize the same client relationship without weakening the clearing moat.
Business & Operating Risks
The biggest disclosed risk is volume sensitivity. CME says revenue is substantially derived from fees for transactions executed and cleared in its markets, and the 2026 10-K warns that trading activity can fall with reduced risk exposure, fluctuating interest rates, central bank asset purchase programs, and lack of available capital. That is the core earnings mechanism here: if contract volume softens, transaction fees and market data demand both come under pressure.
Regulatory burden is the next material risk. CME operates in a heavily regulated environment across the U.S., U.K. and EU, and new laws could force changes to governance, risk oversight, guaranty fund funding, or even add a transaction tax. The filing also flags event-based contracts, especially sports-event contracts, and says adverse rulings could affect the company’s ability to offer certain products. Technology and operating resilience are now more visible risks as well, especially after the November 27, 2025 critical cooling failure at CyrusOne, CME’s largest data center, which forced a temporary market halt.
The disclosed risks do not appear to threaten the clearing-and-liquidity moat itself, but they do test how much of that moat can be monetized if volume, regulation, or infrastructure reliability turns less favorable.
Management Discussion & Analysis
Management is responding to those risks by leaning on pricing, product breadth, and liquidity support rather than balance-sheet expansion. The company declared a regular quarterly dividend of $1.30 per share and an additional annual variable dividend of $6.15 per share on February 12, 2026, while keeping a $3B share repurchase authorization with $2.7B still available. That tells me management is still returning a large share of cash while preserving flexibility.
The strategic emphasis on maximizing futures and options growth globally, plus the Google Cloud partnership, points to product and technology investment. Yet the numbers show the cloud program is still a cost item rather than a visible earnings driver, so I would treat it as a medium-term efficiency project rather than a near-term profit catalyst. The 2025 fee increase and new product launches did more for revenue than the cloud project itself, which is consistent with a business that monetizes market access first and technology second.
Management’s track record is solid. Total contract volume rose 6.0% to 7,060.4M in 2025, with metals volume up 34.0% and equity index volume up 8.0%. That is also consistent with the moat: the broader platform is working, but it is still being measured by volume rather than by a step-change in margin.
Recent Events
The most important recent development was CME’s April 22, 2026 pricing change notice, communicated through Special Executive Report 9676 on February 2, 2026. I view that as a positive because exchange pricing is one of the few levers that can lift revenue without adding balance-sheet risk, and it fits a market-infrastructure model rather than a capital-intensive one.
The April 22, 2026 credit-facility amendment is the other material item. CME renewed its 7B 364-day multi-currency facility, expandable to 10B, which reinforces clearing-house liquidity backstops and supports the company’s role as a systemically important market utility. The May 14, 2026 annual meeting was routine on the governance side, with directors re-elected and the auditor and executive pay approved, although the adjournment of the Class B proposals to June 9, 2026 shows some shareholder-process friction. I do not see that as thesis-changing.
Financial Analysis
Growth
CME — Financial Growth (Quarterly, USD Mil)
| Metric | 2025-06-30 | 2025-09-30 | 2025-12-31 | 2026-03-31 | 2026-06-30 |
|---|---|---|---|---|---|
| REVENUE (USD Mil) | 1,692 | 1,537.6 | 1,648.7 | 1,880.1 | 1,706.2 |
| EBIT (USD Mil) | 1,374.3 | 1,221 | 1,622.1 | 1,554.5 | 1,371.3 |
| EBITDA (USD Mil) | 1,457.7 | 1,303.6 | 1,704.5 | 1,637.8 | 1,455.5 |
| NET INCOME (USD Mil) | 1,025.1 | 908 | 1,182.9 | 1,154.3 | 1,041.8 |
| DILUTED EPS | 2.8 | 2.5 | 3.2 | 3.2 | 2.9 |
Source: Yahoo Finance — Quarterly Financial Statements
Revenue at CME Group rose from $1.5B in Q3 2025 to $1.6B in Q4 2025 and $1.9B in Q1 2026, then eased to $1.7B in Q2 2026. That is 0.8% TTM growth, which is enough to keep the franchise stable but not enough to justify a growth multiple on its own. EBITDA moved in the same direction, from $1.3B in Q3 2025 to $1.7B in Q4 2025 and $1.6B in Q1 2026, so earnings are tracking activity rather than outrunning it.
The pattern looks like normal market-volume variability rather than a structural break. That matters because CME’s moat is built on activity and liquidity, so the growth line is really a test of whether the platform is deepening or simply holding steady.
Profitability
CME — Profitability (TTM)
| Metric | TTM |
|---|---|
| Operating Margin (TTM) | 65.0% |
| Net Margin (TTM) | 63.4% |
| Return on Assets (TTM) | 1.5% |
| Return on Equity (TTM) | 15.8% |
| Gross Margin (TTM) | 100.0% |
| EBITDA Margin (TTM) | 70.6% |
Source: Yahoo Finance — Trailing Twelve Months (TTM)
TTM gross margin of 100.0% and EBITDA margin of 70.6% show that CME’s core exchange model converts almost all revenue into pre-depreciation earnings. Operating margin of 65.0% and net margin of 63.4% leave only a 7.2-point gap to EBITDA, which tells me below-EBITDA charges are modest relative to the scale of the franchise. Return on assets of 1.5% versus return on equity of 15.8% shows equity returns are amplified by leverage rather than asset intensity, but the spread still fits a capital-light platform.
The key signal to watch is whether operating margin stays in the mid-60s while net margin remains close behind. If that holds, it would confirm that the earnings base is durable rather than dependent on add-backs. Profitability is the clearest bull signal in the file, and it is also the main reason the stock deserves a premium multiple at all.
Valuation
CME — Valuation Multiples
| Metric | Value |
|---|---|
| Current Share Price (USD) | 265 |
| Market Cap (USD Mil) | 95,306 |
| Enterprise Value (USD Mil) | 96,213 |
| Trailing P/E | 22.5 |
| Forward P/E | 20.5 |
| Price/Sales (TTM) | 14.1 |
| Price/Book (mrq) | 3.6 |
| EV/Revenue | 14.2 |
| EV/EBITDA | 20.2 |
| Beta (5Y Monthly) | 0.27 |
| FCF Yield % (TTM) | 3.0% |
| Forward EPS (USD) | 12.9 |
| Analyst Target Price – Low (USD) | 217 |
| Analyst Target Price – Mean (USD) | 283.4 |
| Analyst Target Price – High (USD) | 330 |
| # Analyst Opinions | 16 |
Source: Yahoo Finance
CME trades at 14.2x EV/Revenue and 20.2x EV/EBITDA, with a 22.5x trailing P/E and 20.5x forward P/E at a current share price of $265. The market is paying for a high-quality clearing and exchange franchise with 65.0% operating margin, 63.4% net margin, and 43.1% FCF margin, so the primary message is durability rather than cheapness. FCF yield is 3.1%, which is modest for a stock already near its 200-day moving average and well above a plain-vanilla cash-flow valuation.
On the analysis here, I would put fair value in a range of about $240-$290. That sits inside the analyst consensus range of $217-$$330 and a little below the $283 mean, which makes sense because I weight the slow 0.8% TTM growth more heavily than the consensus appears to. The implied earnings path is also not especially demanding: forward EPS of 12.9 is solid, but it is not enough by itself to make the current multiple look cheap versus peers with faster growth or lower leverage.
Using peer EV/Revenue as a cross-check gives a much lower illustrative range, but I would not anchor on that alone because CME’s margin profile and cash conversion are materially better than most of the group. Even so, the gap between the stock’s current price and the peer set tells me the market is already paying for quality, not for acceleration. That is why I still see valuation as the main constraint on the shares.
Leverage
CME — Leverage & Coverage (Quarterly)
| Metric | Value |
|---|---|
| Total Debt/Equity % (mrq) | 14.6 |
| Current Ratio (mrq) | 1 |
| Total Debt (mrq, USD Mil) | 3,868.5 |
| Operating Cash Flow (TTM, USD Mil) | 4,309 |
| Levered Free Cash Flow (TTM, USD Mil) | 2,909 |
| Net Debt/EBITDA (TTM) | 0.3 |
| FCF Margin % (TTM) | 43.0% |
Source: Yahoo Finance — Quarterly Financial Statements
CME’s leverage is modest. Total debt/equity was 14.6%, current ratio was 1.0x, and total debt was $3.9B. Cash generation is much stronger than the balance-sheet headline suggests, with operating cash flow of $4.3B and levered free cash flow of $2.9B.
Net debt/EBITDA was 0.3x and FCF margin was 43.1%, which tells me EBITDA is converting into cash efficiently rather than being absorbed by capex or interest. In my opinion, this is low refinancing risk because the company has a near-breakeven liquidity cushion, very low net leverage, and strong free cash flow generation. The balance sheet is a support for the thesis, not the reason to own it.
Insider Activity
The insider transaction record is net selling, with multiple open-market sales from the CEO and other senior executives and only a small open-market purchase by one director. I read that as a mild negative because it does not suggest strong insider conviction at the margin. It is not thesis-breaking, but it does not help the valuation case either.
Comparable Analysis
Growth
| Company | Revenue TTM (USD Mil) | Revenue Growth YoY % | EBITDA TTM (USD Mil) | Diluted EPS TTM |
|---|---|---|---|---|
| CME | 6,757.2 | 0.8% | 4,771.1 | 11.8 |
| NDAQ | 5,614 | 14.9% | 3,353 | 3.4 |
| IBKR | 6,835 | 26.3% | — | 2.5 |
| ICE | 10,558 | 4.8% | 6,714 | 7.1 |
| CBOE | 5,061.3 | 22.9% | 1,930.7 | 12.8 |
| MKTX | 870 | -0.5% | 435 | 8.5 |
Source: Yahoo Finance
CME’s revenue growth was 0.8% TTM, far below NDAQ at 14.9%, IBKR at 26.3%, ICE at 4.8%, and CBOE at 22.9%, while only MKTX lagged at -0.5%. That makes CME the slowest grower in the group, so its premium has to come from quality and cash generation rather than top-line acceleration. The gap is especially notable because the company’s moat is strong, yet the growth profile is still lagging the faster compounders.
Valuation
| Company | Current Share Price (USD) | Trailing P/E | Forward P/E | EV/Revenue | EV/EBITDA | Price/Sales (TTM) | Price/Book (mrq) | Market Cap (USD Mil) | Enterprise Value (USD Mil) | Beta (5Y Monthly) | FCF Yield % (TTM) | Forward EPS | Analyst Target Price – Low | Analyst Target Price – Mean | Analyst Target Price – High | # Analyst Opinions |
|---|---|---|---|---|---|---|---|---|---|---|---|---|---|---|---|---|
| CME | 265 | 22.5 | 20.5 | 14.2 | 20.2 | 14.1 | 3.6 | 95,306 | 96,213 | 0.27 | 3.0% | 12.9 | 217 | 283.4 | 330 | 16 |
| NDAQ | 90.7 | 26.5 | 19.4 | 10.6 | 17.7 | 9 | 4.3 | 50,724 | 59,259 | 1 | 3.3% | 4.7 | 84 | 109.2 | 132 | 16 |
| IBKR | 88.6 | 35.2 | 27.5 | 9.6 | — | 22.1 | 6.8 | 151,030 | 65,950 | 1.37 | — | 3.2 | 70 | 105.4 | 121 | 14 |
| ICE | 150 | 21.1 | 17 | 9.8 | 15.5 | 8 | 2.8 | 84,181 | 103,854 | 0.94 | 4.3% | 8.8 | 159 | 186.2 | 236 | 15 |
| CBOE | 272.6 | 21.2 | 18 | 5.4 | 14.3 | 5.6 | 5.1 | 28,466 | 27,554 | 0.41 | 2.4% | 15.2 | 258 | 312.8 | 354 | 15 |
| MKTX | 164 | 19.4 | 18.7 | 6.5 | 12.9 | 6.6 | 4.7 | 5,773 | 5,624 | 0.79 | -7.9% | 8.8 | 124 | 158 | 167 | 9 |
Source: Yahoo Finance
CME trades at 14.2x EV/Revenue, 22.5x trailing P/E, 20.5x forward P/E, and 14.1x Price/Sales, versus ICE at 9.8x, 21.1x, 17.0x, and 8.0x, and CBOE at 5.4x, 21.2x, 18.0x, and 5.6x. CME’s 3.1% FCF yield is better than NDAQ’s 3.3% only by a small margin and trails ICE’s 4.3%, which means the stock is not cheap even after adjusting for its 12.9 forward EPS. On a peer-multiple basis, the market is paying more for CME’s balance-sheet safety and cash conversion than for growth, and that is the right way to think about the premium.
Profitability
| Company | Operating Margin (TTM) | Net Margin (TTM) | Return on Assets (TTM) | Return on Equity (TTM) | Gross Margin (TTM) | EBITDA Margin (TTM) |
|---|---|---|---|---|---|---|
| CME | 65.0% | 63.4% | 1.5% | 15.8% | 100.0% | 70.6% |
| NDAQ | 49.3% | 35.0% | 5.9% | 16.5% | 100.0% | 59.7% |
| IBKR | 76.5% | 16.5% | 2.3% | 24.0% | 93.0% | — |
| ICE | 52.6% | 38.2% | 2.2% | 14.1% | 100.0% | 63.6% |
| CBOE | 34.6% | 26.7% | 11.6% | 26.3% | 54.1% | 38.1% |
| MKTX | 41.9% | 35.2% | 10.2% | 23.1% | 61.7% | 50.0% |
Source: Yahoo Finance
CME’s operating margin was 65.0% and EBITDA margin 70.6%, both above NDAQ’s 49.3% and 59.7%, ICE’s 52.6% and 63.6%, and CBOE’s 34.6% and 38.1%. Gross margin is 100.0% for CME, NDAQ, and ICE, so the real edge is not cost of revenue but scale and opex discipline. That margin premium helps explain why CME can trade richer than peers even with slower growth.
Leverage
| Company | Total Debt/Equity % (mrq) | Current Ratio (mrq) | Total Debt (mrq, USD Mil) | Operating Cash Flow TTM (USD Mil) | Free Cash Flow TTM (USD Mil) | Net Debt/EBITDA (TTM) | FCF Margin % (TTM) |
|---|---|---|---|---|---|---|---|
| CME | 14.6 | 1 | 3,868.5 | 4,309 | 2,909 | 0.3 | 43.0% |
| NDAQ | 77.7 | 1 | 9,317 | 2,246 | 1,691.5 | 2.6 | 30.1% |
| IBKR | 205.7 | 1.1 | 45,779 | 15,915 | — | — | — |
| ICE | 69.2 | 1 | 20,527 | 5,514 | 3,633.6 | 2.9 | 34.4% |
| CBOE | 28.1 | 1.6 | 1,580.3 | 1,962.8 | 678.2 | -0.4 | 13.4% |
| MKTX | 14.3 | 7.5 | 178.9 | 200.3 | -457.8 | -0.4 | -52.6% |
Source: Yahoo Finance
CME’s debt/equity was 14.6% and net debt/EBITDA 0.3x, versus NDAQ at 77.7% and 2.6x, ICE at 69.2% and 2.9x, and CBOE at 28.1% and net cash of 0.4x EBITDA. CME’s 43.1% FCF margin also tops NDAQ’s 30.1% and ICE’s 34.4%, so the balance sheet is not just safe, it is a source of valuation support because the business converts a larger share of revenue into cash. That lower leverage also helps explain why CME can command a premium to some peers even without the fastest growth.
Conclusion
I would put my rating as a Hold because CME’s franchise quality is already visible in the numbers, but the stock still trades at 20.2x EV/EBITDA and 22.5x trailing P/E. The tension is simple: the moat is real, yet the latest 0.8% TTM revenue growth does not show enough acceleration to justify a more aggressive call today. The 43.1% FCF margin and 0.3x net debt/EBITDA keep the downside from looking severe, but they also tell me the market is already paying for that safety.
I would raise my rating more towards a Buy if revenue growth moves above 5.0% YoY and operating margin stays near 65.0%, because that would show the pricing actions, new products, and securities-clearing build-out are adding to the core franchise rather than just offsetting normal volume swings. On CME’s roughly $6.8B revenue base, a 1.0 point margin gain would add about $68M of operating profit, so I would want to see both growth and flow-through improving together before I pay up further.
I would move from Hold to Sell if revenue growth slips below 0% TTM or if free cash flow margin falls materially below 40.0%, because that would tell me the exchange is losing the cash conversion that supports the premium valuation. A second warning sign would be a sustained rise in net debt above 1.0x EBITDA, since the current 0.3x level is part of the investment case and a move away from it would weaken the balance-sheet support under the shares. The bear case is therefore not about the franchise failing; it is about the market continuing to pay a premium for a business that is still growing too slowly.
What to Watch Next
- Revenue growth above 5.0% YoY — would support a move toward Buy.
- Operating margin holding near 65.0% — would confirm the franchise is still converting volume into profit.
- Free cash flow margin staying above 40.0% — would preserve the premium valuation case.
- Net debt/EBITDA staying near 0.3x and below 1.0x — would keep balance-sheet risk low.
- Pricing and product-launch follow-through — would need to show up in the next revenue run rate.
What’s your take? I rated CME Group (CME) HOLD above — but the goal here is to get this right, not just to publish an opinion. What would you add to this analysis, or which risk or catalyst do you think I’m under- or over-weighting? Tell me in the comments.
Sources
- SEC 10-K Annual Report — filed 2026-02-26
- SEC 8-K Filing (2026-05-19)
- SEC 8-K Filing (2026-04-27)
- SEC 8-K Filing (2026-04-22)
- SEC 8-K Filing (2026-02-04)
- SEC 8-K Filing (2026-02-02)
- SEC Form 4 Insider Transaction (2026-05-19)
- SEC Form 4 Insider Transaction (2026-05-18)
- SEC Form 4 Insider Transaction (2026-03-30)
- SEC 10-K Annual Report — FY2026
- SEC 10-K Annual Report — FY2025
- SEC 10-K Annual Report — FY2024
- SEC 10-K Annual Report — FY2023
- SEC 10-K Annual Report — FY2022
Data sourced from Yahoo Finance and SEC EDGAR. Not investment advice.
Leave a Comment